Abstract
Background and Purpose: Bone mineral density (BMD) decreases rapidly with prolonged non–weight bearing. Maximizing the BMD response to reloading activities after NWB is critical to minimizing fracture risk. Methods for measuring individual tarsal and metatarsal BMD have not been available. This case report describes tarsal and metatarsal BMD with a reloading program, as revealed by quantitative computed tomography (QCT).
Case Description: A 24-year-old woman was non–weight bearing for 6 weeks after right talocrural arthroscopy. Tarsal and metatarsal BMD were measured with QCT 9 weeks (before reloading) and 32 weeks (after reloading) after surgery. A 26-week progressive reloading program was completed. Change scores were calculated for BMD before reloading and BMD after reloading for the total foot (average of all tarsals and metatarsals), tarsals, metatarsals, bones of the medial column (calcaneus, navicular, cuneiforms 1 and 2, and metatarsal 1), and bones of the lateral column (calcaneus, cuboid, cuneiform 3, and metatarsals 2–5). The percent differences in BMD between the involved side and the uninvolved side were calculated.
Outcomes: Before reloading, BMD of the involved total foot was 9% lower than that on the uninvolved side. After reloading, BMD increased 22% and 21% for the total foot, 16% and 14% for the tarsals, 29% and 30% for the metatarsals, 14% and 15% for the medial column bones, and 28% and 26% for the lateral column bones on the involved and uninvolved sides, respectively. After reloading, BMD of the involved total foot remained 8% lower than that on the uninvolved side.
Discussion: The increase in BMD with reloading was not uniform across all pedal bones; the metatarsals showed a greater increase than the tarsals, and the lateral column bones showed a greater increase than the medial column bones.
Bone mineral density (BMD) is used as an indicator of bone strength and as a risk factor for low-trauma fractures.1 Lower-extremity injury often results in a period of limb disuse (immobilization and non–weight bearing) and has been associated with an acute loss of BMD in the injured extremity.2–8 A gain in BMD with reloading programs after immobilization has been documented for the lower extremity (femur,2 tibia,2 and calcaneus2,5). The recovery of BMD after immobilization often remains incomplete.2,5–7 A loss of lower-extremity BMD after injury places an individual at subsequent risk for further bone injury during the reloading program, and evidence exists that a prior history of a fracture is associated with a greater risk of future fractures.9
Previous studies of lower-extremity BMD focused primarily on the hip, tibia, and calcaneus.2–8 The BMD of the tarsals and metatarsals has not been studied, yet the tarsals and metatarsals are often the sites of complications related to lower-extremity loading during weight-bearing activities and reloading after injury. Calcaneal BMD has been used as the indicator of the response of the foot to an intervention.10 However, the method appropriate to the measurement of tarsal and metatarsal BMD has not been applied, and the relationship between calcaneal BMD and remaining tarsal and metatarsal BMD is unknown.
Quantitative computed tomography (QCT) is a well-established method of assessing 3-dimensional volumetric BMD and has been used to determine the density of vertebrae,11 the proximal femur,12,13 and the radius.14 Quantitative computed tomography is ideally suited to the comprehensive study of pedal BMD because it allows 3-dimensional volumetric calculation of individual tarsal and metatarsal BMD, but this technique has not yet been used.15 For this reason, we applied the established QCT BMD method to the foot and measured the BMD of each individual tarsal and metatarsal bone.
Recent evidence suggests that the loading pattern of the foot during walking (and running) may influence the magnitude of the response (change) of BMD in each small bone of the foot.16 Additionally, the loading pattern of the foot has been linked to a number of foot impairments as well as acute injury.17,18 Understanding how all bones of the foot respond to progressive loading programs may provide insight into the prevention of secondary complications from therapeutic interventions and guidance in maximizing bone health. Therefore, we applied the QCT method to the assessment of tarsal and metatarsal BMD in a patient after 6 weeks of NWB immobilization and after a 26-week reloading program. In this case report, we describe this treatment and relate the influence of the loading pattern of the foot during walking on changes in pedal BMD.
Case Description
Patient History
The patient was a 24-year-old Caucasian woman with a body mass of 58 kg and a height of 167 cm (body mass index of 21 kg/m2). She described herself as very active, exercising vigorously 4 to 6 times per week, including running (approximately 19 km [12 miles] per week at a pace of 7 minutes per mile, typically 3–6 miles per session), playing competitive soccer, and lifting weights. The patient had a history of multiple sprains in her right ankle. The most recent right-ankle symptoms were reported as nontraumatic, sharp pain that was localized to the lateral talocrural joint and that progressed to complaints of joint instability. An examination performed by an orthopedic surgeon revealed cartilage damage on the dome of the talus and lateral ligament laxity. The surgeon performed a talocrural arthroscopy with a microfracture procedure on the talus to stimulate cartilagelike fibrous scarring and a modified Brostrom reconstruction procedure on the lateral ligaments (anterior talofibular ligament and calcaneofibular ligament). The patient was NWB for 6 weeks with a MaxTrax Air Walker.* Physical therapy evaluation and initiation of treatment began 5 weeks after surgery. A review of the patient's systems was unremarkable; she revealed no additional past surgeries, no current or past medical comordibities, no current medications, and no complaints other than those related to the present surgery. She reported regular monthly menstrual cycles over the previous years since menarche at age 12 years. Our clinical impression based on her reported history was that the patient could receive physical therapy with no need for referral. Surgical precautions and activity tolerance would guide the physical therapist examination and exercise prescription. Of particular concern were the loss of lower-extremity BMD after non–weight bearing and immobilization and the need for cautiously progressive weight-bearing activities to reduce the risk of reinjury and to restore bone health.
Examination
The physician's orders and precautions included starting range of motion (ROM) at 4 weeks after surgery, weight bearing and weaning from the boot at 6 weeks, and no strengthening into inversion and eversion motions until 10 weeks. The initial examination was completed at 5 weeks after surgery. The patient reported no complications related to the surgical intervention. She had moderate edema on the dorsum of her foot and lateral ankle, a surgical scar that was healed but that had adhesions, and limited ankle plantar flexion (15°) and toe flexion (interphalangeal flexion of 0°, metatarsophalangeal flexion of <5°) ROM. Dorsiflexion ROM was adequate for walking and running (10°). The gastrocnemius and soleus muscle bellies were visibly atrophied. The strength (force-generating capacity) of the plantar flexor muscles, assessed at week 7 after surgery, indicated an inability to complete a single-leg heel raise but an ability to rise through full plantar-flexion ROM with 50% of the patient's weight on the involved side (bilateral heel raise).
Tests and Measures
The patient consented to be described in this case report and signed a consent form approved by the Human Research Protective Office, School of Medicine, Washington University. The volumetric BMD of all tarsals and metatarsals was measured by QCT with a Somatom Sensation 16 computed tomographic scanner.† The computed tomographic images were acquired by use of a previously documented procedure.19 The 3-dimensional image of each bone was segmented, and BMD was measured by use of the Analyze‡,20 and Image§,21 software packages.
Prior research has established evidence of the validity of the QCT as a technique for the measurement of foot BMD.22 Absolute measurement error was computed as the bias (mean) and root-mean-square standard deviation of the difference in BMD between repeated scans for the tarsals and metatarsals. The bias was small (−3.1 to 0.5), and reliability (root-mean-square standard deviation) was 3.1 mg/cm3.22 Relative error was computed as the root-mean-square coefficient of variation (CVRMS) with the methods described by Gluer et al.23 The CVRMS was computed to allow interpretation of the standard deviation in relation to the size of the mean for each bone. The mean CVRMS for the measurement of BMD in the tarsals and metatarsals was 0.9% (range: 0.2% for the talus to 1.6% for the fifth metatarsal).22
Very limited groups of subjects have been examined with QCT to derive BMD values for the tarsals and metatarsals, and no normative data are available at this time to aid in the interpretation of the BMD response. In order to provide a comparison for the interpretation of QCT-derived BMD values, the calcaneal BMD was also measured by quantitative ultrasonography (QUS) (Sahara Clinical Bone Sonometer‖). The measurement of BMD by QUS is widely used and accepted, and normative data are available. We used previously reported measurement methods, in which the right foot was measured first, then the left foot was measured, then each foot was measured again, and then the average was calculated for each foot.10 The reliability and precision of QUS estimates of BMD were previously established.24,25 Our Sonometer also was tested and found to be reliable for providing estimates of BMD, with a coefficient of variation of 2.2%, a test-retest variability of 0.002 g/cm,2 and an intraclass correlation coefficient (model 3,1) of .97.26
In addition to Sonometer estimates of BMD (milligrams per square centimeter), a T-score was calculated. The T-score is the number of standard deviations of the bone quality measure from that of a “normal” reference population (eg, 20- to 29-year-old Caucasian women).27 According to World Health Organization criteria, an individual with a T-score −1 to −2.4 standard deviations below the mean for the reference population is considered to have osteopenia, whereas a T-score equal to or greater than −2.5 standard deviations below the mean is considered to have osteoporosis.28
Measurements of BMD (QUS and QCT) were taken at 9 weeks after surgery (3 weeks after the patient's return to weight-bearing activity) (before reloading). Measurements by QUS and QCT were obtained again at 32 weeks after surgery (26 weeks after the patient's return to weight-bearing activity) (after reloading), and QUS was repeated at 2 years after surgery (2-year follow-up). A 2-year follow-up QCT measurement was not available for this patient.
Plantar pressure during preferred-speed barefoot walking was assessed after reloading with an Emed-ST P-2 pressure platform system.# We used a 2-step testing method.29 The center-of-pressure (COP) line was calculated by mapping the location of the point at which the sum of the rotational forces about the foot (ie, moments) was zero for each instant during stance.30 The loading pattern during barefoot walking was determined from the location of the COP line (medial or lateral) relative to the anatomical longitudinal axis of the foot through the second metatarsal and digit.16 The location and pattern of the COP line were previously used to infer the relative location and amount of mechanical stress on specific anatomical structures.30
The longitudinal axis (second metatarsal and digits) was used to divide the bones of the foot into medial and lateral columns to explore the relationship between the loading pattern of the foot and the BMD response to reloading. The medial column bones were defined as the calcaneus, talus, navicular, cuneiforms 1 and 2, and metatarsal 1. The lateral column bones included the calcaneus, cuboid, cuneiform 3, and metatarsals 2–5. In our patient, the second metatarsal BMD responded in a manner similar to that of the lateral column bone BMD and therefore was included in lateral column bone calculations. The calcaneus was included in calculations of both the medial column bone and the lateral column bone in order to reveal a complete path of force transfer during the stance phase of walking.
Calcium intake has been linked to fracture healing and the ability to regain bone density after injury or fracture in calcium-deficient animal models.31 We estimated our patient's calcium intake from a 2-day diet log by use of BalanceLog software.**
The patient kept a daily exercise journal in which she recorded the mode and duration of all activities completed. Weight-bearing activity was divided into 3 categories: no load, low load, and high load.32,33 No-load activities were those performed in an NWB manner (eg, swimming). Low-load activities were those that required less than full body weight or required full body weight but had low impact, were repetitive, and had very little variability in the direction of force application (eg, slow walking, stationary bicycling, and elliptical training). High-load activities were those that had high impact or magnitude, an irregular direction of loading, or both (eg, running, plyometric activities, soccer drills, and weight lifting [leg presses]). Activity data were reported as the number of minutes per week of each type of activity.
Intervention
The patient was seen for a total of 13 visits over 7 months.
Early phase (weeks 1–10 after surgery).
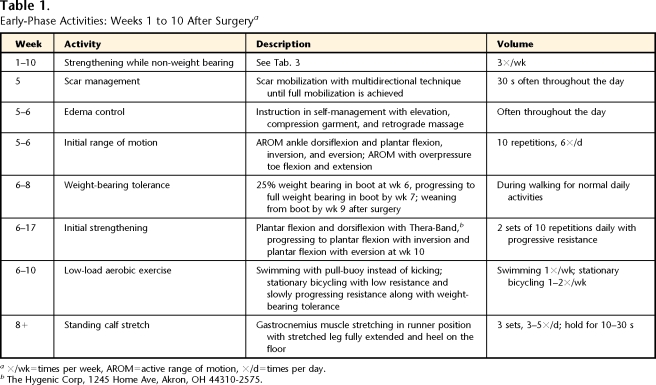
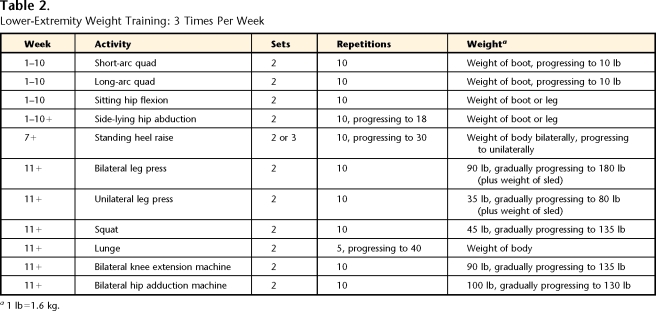
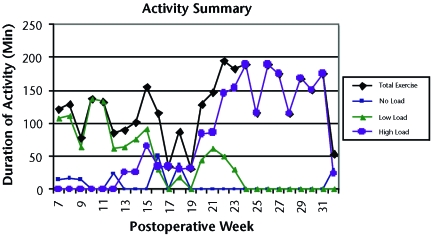
The early phase of rehabilitation was defined as the phase in which the patient worked on weight-bearing tolerance, increasing ROM and strength as well as addressing many of the initial limitations related to edema and scar formation. During the first 4 weeks after surgery, the patient completed a self-initiated home program of non–weight-bearing strengthening exercises for the hip and knee (Tabs. 1 and 2). Five weeks after surgery, the patient started physical therapy. She was seen 1 time per week, during which time her home exercise program was progressed (total of 5 visits). The patient completed no-load (swimming) and low-load (walking and stationary bicycling) activities. Tables 1 and 2 and Figure 1 provide details for the early phase.
Table 1.
Early-Phase Activities: Weeks 1 to 10 After Surgerya
×/wk=times per week, AROM=active range of motion, ×/d=times per day.
bThe Hygenic Corp, 1245 Home Ave, Akron, OH 44310-2575.
Table 2.
Lower-Extremity Weight Training: 3 Times Per Week
a1 lb=1.6 kg.
Figure 1.
Summary of activities after surgery. Data for total exercise indicate total times of no-load, low-load, and high-load activities. No load=swimming; low load=walking, stationary bicycling, and elliptical training; high load=running, plyometric activities, soccer drills, and weight lifting.
Middle phase (weeks 11–15 after surgery).
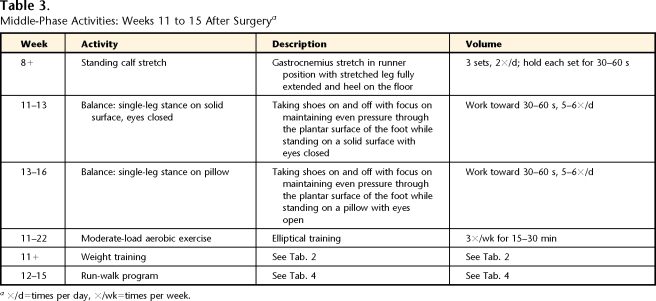
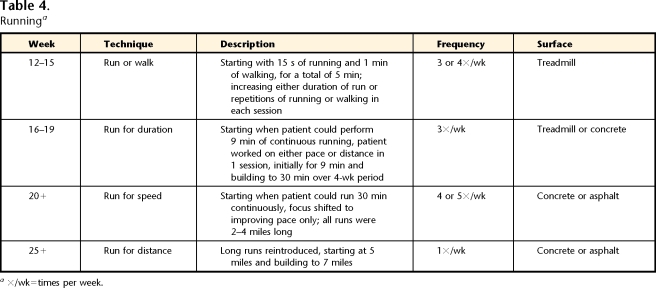
The middle phase of rehabilitation was defined as the phase in which low-load activities (elliptical training) were increased and high-load activities (running) were introduced. Strengthening and ROM exercises were continued, and balance activities were added. The patient was seen 1 time per week to assess and modify the home exercise program (total of 5 visits). Tables 2, 3, and 4 and Figure 1 provide details for the middle phase.
Table 3.
Middle-Phase Activities: Weeks 11 to 15 After Surgerya
×/d=times per day, ×/wk=times per week.
Table 4.
Runninga
×/wk=times per week.
Late phase (weeks 16–36 after surgery).
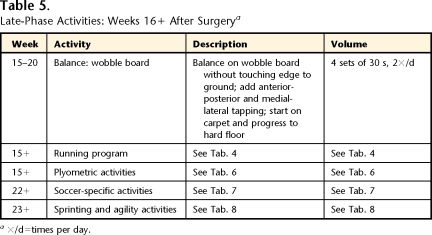
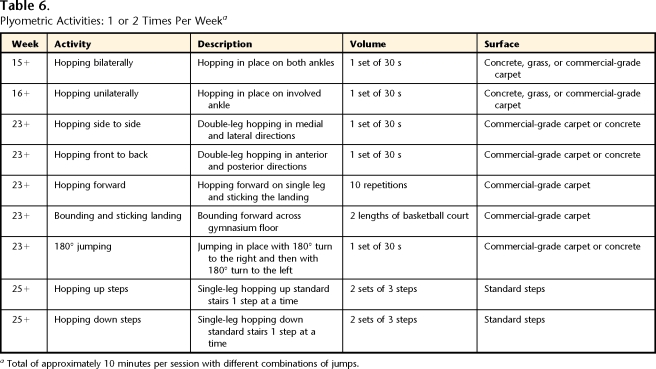
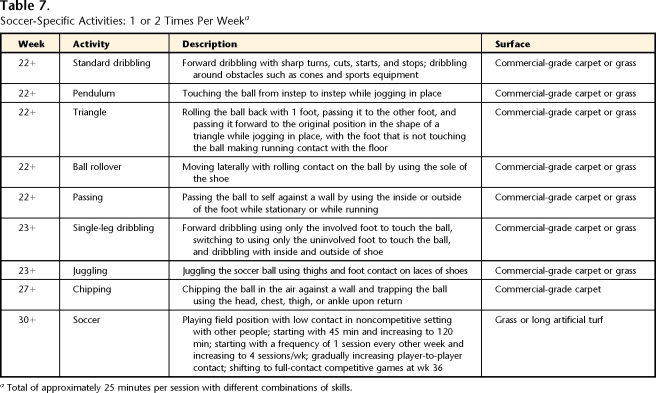
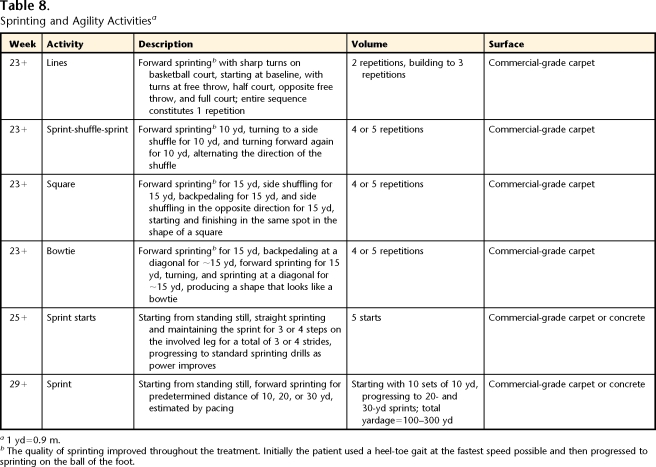
The late phase of rehabilitation was defined as the phase of progression of high-load activities, including increasing running duration and speed, as well as adding sprinting, agility, plyometric, and soccer-specific activities, with a return to soccer competition. The patient was seen 1 time per month or every other month to assess and modify the home exercise program (total of 3 visits). Tables 2, 4, 5, 6, 7, and 8 and Figure 1 provide details for the late phase.
Table 5.
Late-Phase Activities: Weeks 16+ After Surgerya
×/d=times per day.
Table 6.
Plyometric Activities: 1 or 2 Times Per Weeka
Total of approximately 10 minutes per session with different combinations of jumps.
Table 7.
Soccer-Specific Activities: 1 or 2 Times Per Weeka
Total of approximately 25 minutes per session with different combinations of skills.
Table 8.
Sprinting and Agility Activitiesa
1 yd=0.9 m.
bThe quality of sprinting improved throughout the treatment. Initially the patient used a heel-toe gait at the fastest speed possible and then progressed to sprinting on the ball of the foot.
Data Analysis
Change scores {[(scores before − scores after)/scores before]×100} were calculated for BMD before reloading and for BMD after reloading for the total foot (average of all tarsals and metatarsals), tarsals, metatarsals (1–5), bones of the medial column (calcaneus, talus, navicular, cuneiforms 1 and 2, and metatarsal 1), and bones of the lateral column (calcaneus, cuboid, cuneiform 3, and metatarsals 2–5). The percent differences in BMD between the involved side and the uninvolved side were calculated {100−[(BMD of involved side/BMD of uninvolved side)×100]}.
Outcomes
Impairment and Functional Recovery
The edema and scar adhesions resolved during the early phase of rehabilitation. The plantar-flexor muscle strength necessary to complete 25 heel raises, the recommended normative value,34 was reached by week 10 after surgery. However, the strength required to maintain the foot in a plantar-flexed position, loading only the forefoot, during high-load activities (such as sprinting and single-leg hopping) did not return until the late phase of rehabilitation (week 25). Gross toe flexion ROM matched that on the uninvolved side during the early phase of rehabilitation, plantar-flexion ROM increased to 50 degrees during the middle phase of rehabilitation, and dorsiflexion ROM did not change during the intervention (10°).
The patient progressed through the rehabilitation phases with relatively few and reasonably minor complaints. During the early phase of rehabilitation (week 8), with the transition from the boot to full weight bearing, moderate pain was reported posterior and distal to the medial malleolus in the location of the posterior tibialis tendon. Symptoms were relieved with the addition of a scaphoid pad‡‡ to the medial longitudinal arch to assist in the control of pronation. Pain limiting activity was reported in the talocrural joint at week 25. The activity log indicated a rapid increase in high-impact activity from weeks 19 to 24. Activity reduction for 1 week resolved the symptoms. One final injury occurred at week 33, with pain along the anterior tibialis tendon and muscle belly. The patient returned to no-impact and low-impact activities for 1 week, and the symptoms resolved. The patient was able to return to competitive soccer without limitations related to the surgical intervention by week 36 after surgery.
Loading Program
The weekly dose of high-impact activity was increased over the course of rehabilitation. No high-impact activities were performed from weeks 0 to 12. From weeks 13 to 19, high-impact activities were gradually introduced, with an average of 31 minutes per week. There were 2 transition weeks (weeks 20 and 21), in which the average duration of high-impact activity increased to 85 minutes. During the final phase (weeks 22–32), the average duration of high-impact activity was 158 minutes per week (Fig. 1).
BMD and Plantar Pressure
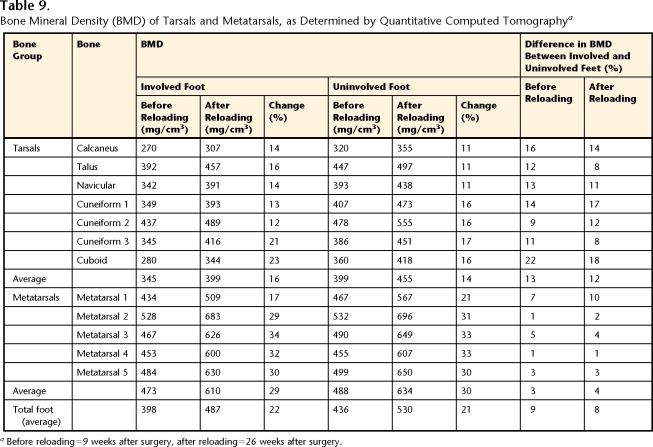
Before reloading, the average BMD of the total foot determined by QCT was 9% lower (range across tarsals and metatarsals: 1%–22%) in the involved foot than in the uninvolved foot (Tab. 9 and Fig. 2). The BMD values were generally higher in the metatarsals (mean for involved foot=473 mg/cm3, mean for uninvolved foot=488.4 mg/cm3) than in the tarsals (mean for involved foot=345 mg/cm3, mean for uninvolved foot=399 mg/cm3); the lowest BMD values were found in the calcaneus and cuboid (270 and 280 mg/cm3 for involved foot and 320 and 360 mg/cm3 for uninvolved foot, respectively). The BMD of the calcaneus was estimated by QUS to be 31% lower on the involved side (450 mg/cm2) than on the uninvolved side (660 mg/cm2). The T-scores for the calcaneus were −1.2 and 0.7 on the involved and uninvolved sides, respectively.
Table 9.
Bone Mineral Density (BMD) of Tarsals and Metatarsals, as Determined by Quantitative Computed Tomographya
Before reloading=9 weeks after surgery, after reloading=26 weeks after surgery.
Figure 2.
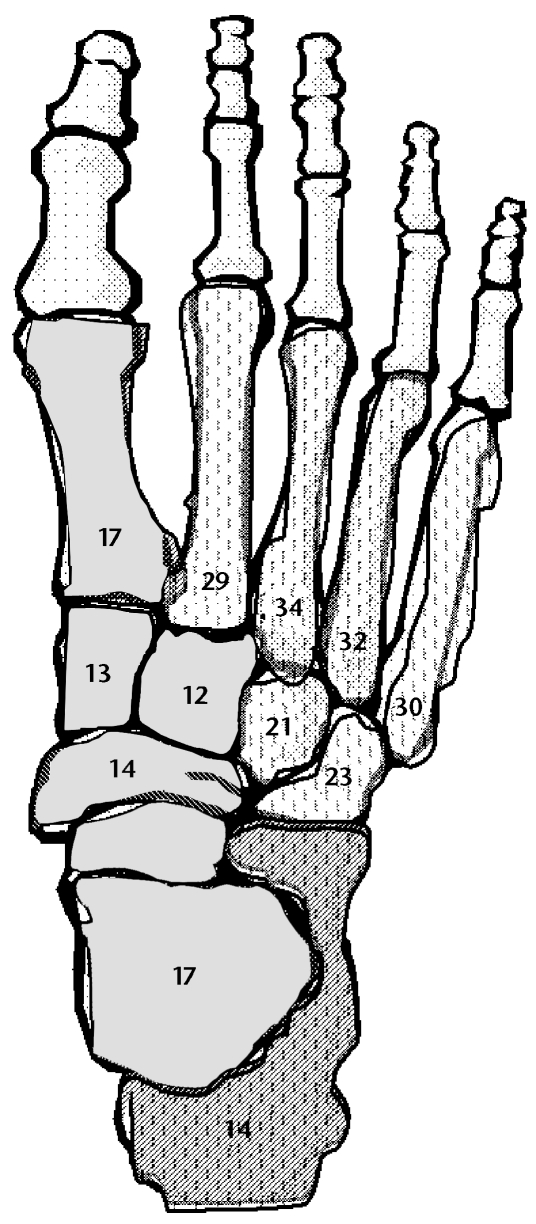
Involved foot. Hatch marks on a darker background indicate medial column bones with a bone mineral density response lower than that of lateral column bones (hatch marks on a lighter background). Numbers inside bones represent the percentage of change on the involved side from before reloading to after reloading.
After reloading, the BMD of the total foot determined by QCT increased an average of 22% in the involved foot and 21% in the uninvolved foot (Tab. 9). The greatest increase in BMD after reloading occurred in the metatarsals (mean for involved foot=29%, range=17%–34%; mean for uninvolved foot=30%, range=21%–33%). The BMD of the tarsals increased 16% and 14% on the involved and uninvolved sides, respectively. After reloading, the BMD of the total foot on the involved side remained 8% lower than that on the uninvolved side. The QUS measures indicated an 18% increase in calcaneal BMD (530 mg/cm2) on the involved side and a 6% increase in calcaneal BMD (700 mg/cm2) on the uninvolved side. After reloading, the T-scores for the calcaneus increased to −0.5 and 1.0 in the involved foot and the uninvolved foot, respectively. The BMD of the medial column bones increased 14% and 15% in the involved foot and the uninvolved foot, respectively; whereas that in the lateral column bones increased 28% and 26% in the involved foot and the uninvolved foot, respectively (Fig. 2).
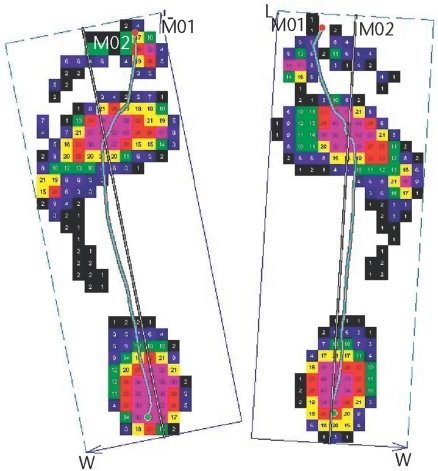
Barefoot plantar pressure assessment revealed primary contact pressure at the heel and central forefoot, with very little pressure in the midfoot (Fig. 3). Bilaterally, the COP line described a path that was lateral to the longitudinal axis of the foot through the second metatarsal through the late stance phase of walking.16 Additionally, the COP line remained lateral to the bisection of the foot until late in the stance phase of walking.
Figure 3.
Map of peak plantar pressures during barefoot walking over a pressure platform system. The solid straight line is the longitudinal axis of the foot through the second metatarsal and digits. The curved line is the center-of-pressure (COP) line. The COP line is lateral to the longitudinal bisection of the foot in the hindfoot and the midfoot and crosses the midline in the late stance phase (toe lifting off) of walking. L=length, M01=medial half of foot, M02=lateral half of foot, W=width.
At 2 years after surgery, the calcaneal BMD determined by QUS showed a continued increase in the involved foot (600 mg/cm2), with no additional increase in BMD in the uninvolved foot (700 mg/cm2). The T-scores for the calcaneus increased to 0.2 in the involved foot and remained at 1.0 in the uninvolved foot (Tab. 10).
Table 10.
Bone Mineral Density (BMD) and T-Score of Calcaneus, as Determined by Quantitative Ultrasonographya
Before reloading=9 weeks after surgery, after reloading=26 weeks after surgery.
bChange from value before reloading to value at 2 years.
Calcium Intake
The patient's average calcium intake was 562 mg per day. This calcium intake represented just over 50% of the recommended calcium intake of 1,000 mg per day.35
Discussion
This case report is the first to describe the BMD responses of all of the tarsals and metatarsals after a 26-week loading program following a 6-week period of immobilization and NWB. Additionally, this case report is the first to describe a relationship between the loading pattern of the foot and individual tarsal and metatarsal adaptive BMD responses.
The intervention program outlined in this case report, including a progression to high-load activities, was associated with an increase in the BMD of 12% to 34% in the tarsals and metatarsals of the involved foot with 26 weeks of reloading activity. The BMD responses of the tarsals and metatarsals to a physical therapist-supervised loading program had not been previously reported.
Magnitude and Timing of Recovery
No previous studies had measured tarsal and metatarsal BMD with QCT; therefore, a direct comparison of the magnitude and timing of BMD recovery in this report with those in previous reports is not possible. Others have measured calcaneal BMD with loading programs by using dual-energy x-ray absorptiometry, QUS, and single-photon absorptiometry; therefore, we limit our comparisons to the calcaneus.
For our patient, the involved calcaneal BMD increased 18% when QUS was used and 14% when QCT was used after the 26-week reloading program and increased 33% from before reloading to the follow-up at 2 years when QUS was used (a 13% increase from the measurement after reloading). Alfredson et al5 measured a 14% decrease in calcaneal BMD (dual-energy x-ray absorptiometry) over a period similar to that in this case report (6 weeks after surgery to 26 weeks after surgery), and the deficit was sustained at 1 year of follow-up. In the study by Alfredson et al,5 the surgical intervention (Achilles tendinosis surgery) directly affected the calcaneus. Additionally, the high-impact reloading was less vigorous (light jogging) and began later (between 17 and 26 weeks after surgery). Our patient not only completed a longer weekly duration of high-impact activities but also seemed to complete a program with potentially higher loads and greater variability in the direction of the load application (plyometric activities and soccer drills). A number of studies have examined the specific impact of participation in sports on BMD. Subjects participating in sports activities considered to be high-impact or variable-impact (soccer, squash, gymnastics, and rope skipping) activities had greater lower-extremity BMD than did control subjects32,36–38 and a decreased risk of stress fractures.33 We believe that it may be critical to include activities with variability in the direction of loading in rehabilitation programs when a therapeutic goal is to restore or increase BMD.
In our patient, uninvolved calcaneal BMD increased 6% when QUS was used and 11% when QCT was used after a 26-week reloading program, with no additional increase in BMD measured at the 2-year follow-up. Other authors39–41 have reported similar increases in calcaneal BMD (4%–7%) in premenopausal women who were healthy after participation in a 1- to 2-year high-impact activities program. The increase in BMD that we observed was more rapid (close to 6 months) than those previously reported. However, in the studies of Vainionpaa et al,39 Heinonen et al,40 and Friedlander et al,41 measurements were reported at the end of the interventions (1 or 2 years), and there were no intermediate measurements. Our 2-year follow-up QUS data demonstrated no further increase in BMD in the uninvolved foot after the 26-week measurement. The rapid increase in BMD in the uninvolved foot at 26 weeks and the lack of change over the following 18 months imply that the potential maximum increase in BMD with a loading program in healthy premenopausal women may be realized in a relatively short period of time.
Our patient's BMD increased in response to the reloading program despite a calcium intake below the recommended intake of 1,000 mg per day.35 It is plausible that had our patient's dietary intake of calcium been higher, her adaptive response to reloading may have been greater or more complete. Finally, the patient reported a normal menstrual history, which is also an important indicator of bone metabolism and which is associated with new bone synthesis and net bone accumulation.42
Residual Differences Between Involved Foot and Uninvolved Foot
A BMD deficit remained in the involved foot at 32 weeks after surgery (8% for total foot, 24% for calcaneus examined by QUS, and 14% for calcaneus examined by QCT) (Tabs. 9 and 10). At the 2-year follow-up, a 14% BMD deficit in the involved calcaneus was measured by QUS. A deficit remaining on the involved side 8 months and 2 years after surgery is well supported by the findings of others. Residual calcaneal BMD deficits of 5% to 16% have been reported for the involved side 1 to 2 years after lower-extremity surgery.5,7 The persistence of a BMD deficit in the hip has been reported at up to 5 years after fracture,3 but Alfredson et al5 reported that at 40 months after Achilles tendinosis surgery, a calcaneal BMD deficit was no longer apparent.
We believe that the important clinical consideration in the interpretation of a persistent deficit is the impact on fracture risk. Our lack of normative data for QCT prevents us from drawing firm conclusions about fracture risk for all tarsals and metatarsals; however, normative data for the calcaneus are available for QUS. The T-score of −1.2 before reloading indicates a calcaneal BMD that is in the osteopenic range and an increase in fragility-related fracture risk.28 The T-scores for the uninvolved foot (0.7 before reloading, 1.0 after reloading), for the involved foot after reloading (0.5), and at the 2-year follow-up (0.2 for involved foot, 1.0 for uninvolved foot) indicate a bone mineral content that is considered normal and not associated with an increase in fracture risk.28
Differences Among Bones
Because of the previous difficulty in assessing all of the bones in the foot, the calcaneus has been used as an indicator of BMD for the entire foot. However, we provide evidence that each bone of the foot may respond uniquely and that the calcaneus may inadequately represent the changes occurring in the remaining bones of the foot. The responses of different bones to a reloading program are most likely multifactorial. We speculate that the pattern of how the load is applied to the foot may influence both the rate and the magnitude of BMD recovery after bone loss. For our patient, the lateral column bones showed a greater increase in BMD with reloading than did the medial column bones (Fig. 2). The COP line indicated a lateral loading pattern that continued through the late stance phase (toe lifting off) of barefoot walking (Fig. 3). The long duration of the lateral loading pattern may have contributed to an enhanced stimulus for bone formation in the lateral bones of the foot compared with the medial bones of the foot.
Bone composition, that is, trabecular and cortical volume and location, also may influence responses to reloading. There is evidence that trabecular bone is more responsive than cortical bone to unloading and reloading.2,43 We are pursuing methods for future research that will allow further segmentation of each bone to assess the contribution of a reloading program to the trabecular and cortical BMD volume of each tarsal and metatarsal. Understanding some of the factors (foot loading patterns and bone composition) that help to regulate BMD changes could help to illuminate why loading programs fail (formation of stress fractures, recurrence of stress fractures, nonunion fractures). Additionally, exercise prescription could specify the direction of force application to assist in facilitating bone formation.
There are a number of limitations related to this report beyond the fact that it involves just one patient. First, we were unable to obtain presurgery BMD measures. The conclusions drawn from this report, therefore, are limited to changes with reloading and provide no information about baseline BMD status or the immediate loss of BMD after immobilization.
Another limitation of this case report is the lack of normative BMD values for the tarsals and metatarsals, as assessed by QCT, for estimating absolute or relative fracture risk. We have collected BMD data using QCT technology for the tarsals and metatarsals in older people with chronic diabetes, peripheral neuropathy, and a history of plantar ulcers but have no BMD data for age- and sex-matched control subjects. Because of the lack of normative BMD values, we are unable to classify the QCT-derived BMD values for each tarsal and metatarsal with regard to fracture risk.
Conclusion
This case report demonstrates the unique BMD responses of individual bones in the foot to a reloading program and highlights the limitations of using the BMD of the calcaneus as the sole indicator of the BMD response of the foot. This case report also provides evidence that the BMD responses of individual bones may be related to the loading pattern of the foot. The BMD response in the uninvolved foot in our patient suggested that a maximum increase in BMD occurred within 1 year, whereas the BMD in the involved foot continued to increase up to the 2-year follow-up. The use of QCT in future research efforts may be invaluable in the areas of chronic foot deformities or acute impairments, such as Charcot arthropathy; in the rehabilitation of lower-extremity injuries; and in improving physical therapists' understanding of the factors affecting the recovery of pedal BMD.
Dr Hastings and Mr Commean provided concept/idea/research design and data collection. All authors provided writing and consultation (including review of manuscript before submission). Dr Hastings, Mr Commean, and Dr Sinacore provided data analysis. Dr Hastings provided project management and the patient. Dr Prior and Dr Sinacore provided fund procurement and facilities/equipment. Dr Prior provided institutional liaisons.
This work was supported by research grants from the National Institutes of Health/Institutes for Child Health and Human Development/National Center for Medical Rehabilitation Research (1R21 HD048972, 2R01 HD036895) and National Institutes of Health/National Institute of Diabetes, Digestive and Kidney Disease (1R21 DK079457, R01 DK59224).
This case was presented as a platform presentation at the Combined Sections Meeting of the American Physical Therapy Association; February 14–18, 2007; Boston, Mass.
Donjoy, 1430 Decision St, Vista, CA 92081.
Siemens Medical Systems Inc, 51 Valley Stream Pkwy, Malvern, PA 19355.
Biomedical Imaging Resource, Mayo Clinic, 200 1st St SW, Rochester, MN 55905.
National Institutes of Health, 9000 Rockville Pike, Bethesda, MD 20892. Available at: http://rsb.info.nih.gov/ij/index.html.
Hologic, 35 Crosby Dr, Bedford, MA 01730.
Novel Inc, 964 Grand Ave, St Paul, MN 55105.
Microlife USA Inc, 424 Skinner Blvd, Suite C, Dunedin, FL 34698.
Alimed, 297 High St, Dedham, MA 02026.
References
- 1.Weinstein RS. True strength. J Bone Miner Res. 2000; 15:621–625. [DOI] [PubMed] [Google Scholar]
- 2.Ingle BM, Hay SM, Bottjer HM, Eastell R. Changes in bone mass and bone turnover following ankle fracture. Osteoporos Int. 1999; 10:408–415. [DOI] [PubMed] [Google Scholar]
- 3.van der Poest CE, van der WH, Patka P, et al. Long-term consequences of fracture of the lower leg: cross-sectional study and long-term longitudinal follow-up of bone mineral density in the hip after fracture of lower leg. Bone. 1999; 24:131–134. [DOI] [PubMed] [Google Scholar]
- 4.van der Wiel HE, Lips P, Nauta J, et al. Loss of bone in the proximal part of the femur following unstable fractures of the leg. J Bone Joint Surg Am. 1994; 76:230–236. [DOI] [PubMed] [Google Scholar]
- 5.Alfredson H, Nordström P, Lorentzon R. Prolonged progressive calcaneal bone loss despite early weightbearing rehabilitation in patients surgically treated for Achilles tendinosis. Calcif Tissue Int. 1998; 62:166–171. [DOI] [PubMed] [Google Scholar]
- 6.Eyres KS, Kanis JA. Bone loss after tibial fracture. J Bone Joint Surg Br. 1995; 77:473–478. [PubMed] [Google Scholar]
- 7.Kartus J, Stener S, Nilsen R, et al. Bone mineral assessments in the calcaneus after anterior cruciate ligament injury: an investigation of 92 male patients before and two years after reconstruction or revision surgery. Scand J Med Sci Sports. 1998; 8:449–455. [DOI] [PubMed] [Google Scholar]
- 8.Neander G, Adolphson P, Hedstrom M, et al. Decrease in bone mineral density and muscle mass after femoral neck fracture: a quantitative computed tomography study in 25 patients. Acta Orthop Scand. 1997; 68:451–455. [DOI] [PubMed] [Google Scholar]
- 9.Karlsson MK, Hasserius R, Obrant KJ. Individuals who sustain nonosteoporotic fractures continue to also sustain fragility fractures. Calcif Tissue Int. 1993; 53:229–231. [DOI] [PubMed] [Google Scholar]
- 10.Hastings MK, Sinacore DR, Fielder FA, Johnson JF. Bone mineral density during total contact cast immobilization for a patient with neuropathic (Charcot) arthropathy. Phys Ther. 2005; 85:249–256. [PMC free article] [PubMed] [Google Scholar]
- 11.Lang TF, Li J, Harris ST, Genant HK. Assessment of vertebral bone mineral density using volumetric quantitative CT. J Comput Assist Tomogr. 1999; 23:130–137. [DOI] [PubMed] [Google Scholar]
- 12.Lang TF, Guglielmi G, van Kuijk C, et al. Measurement of bone mineral density at the spine and proximal femur by volumetric quantitative computed tomography and dual-energy X-ray absorptiometry in elderly women with and without vertebral fractures. Bone. 2002; 30:247–250. [DOI] [PubMed] [Google Scholar]
- 13.Lang TF, Keyak JH, Heitz MW, et al. Volumetric quantitative computed tomography of the proximal femur: precision and relation to bone strength. Bone. 1997; 21:101–108. [DOI] [PubMed] [Google Scholar]
- 14.Pang MYC, Ashe MC, Eng JJ. Muscle weakness, spasticity and disuse contribute to demineralization and geometric changes in the radius following chronic stroke. Osteoporos Int. 2007; 18:1243–1252. [DOI] [PMC free article] [PubMed] [Google Scholar]
- 15.Prior FW, Commean PK, Ju T, et al. Developing a biomarker for neuropathic arthropathy in diabetic patients. In: IEEE/NIH Life Systems and Applications Workshop. LISA 2007. Available at: http://www.ieeexplore.ieee.org/xpl/freeabs_all.jsp?isnumber=4400869&arnumber=4400873&count=67&index=3.
- 16.Sinacore DR, Bohnert KL, Hastings MK, Johnson JE. Mid foot kinetics characterize structural polymorphism in diabetic foot disease. Clin Biomech. 2007. Jun 28; [Epub ahead of print] [DOI] [PMC free article] [PubMed]
- 17.Williams DS, McClay IS, Hamill J. Arch structure and injury patterns in runners. Clin Biomech. 2001; 16:341–347. [DOI] [PubMed] [Google Scholar]
- 18.Kaufman KR, Brodine SK, Shaffer RA, et al. The effect of foot structure and range of motion on musculoskeletal overuse injuries. Am J Sports Med. 1999; 27:585–593. [DOI] [PubMed] [Google Scholar]
- 19.Mueller MJ, Smith KE, Commean PK, et al. Use of computed tomography and plantar pressure measurement for management of neuropathic ulcers in patients with diabetes. Phys Ther. 1999; 79:296–307. [PubMed] [Google Scholar]
- 20.Robb R, Hanson DP, Karwoski R, et al. Analyze: a comprehensive, operator-interactive software package for multidimensional medical image display and analysis. Comput Med Imaging Graph. 1989; 13:433–454. [DOI] [PubMed] [Google Scholar]
- 21.Girish V, Vijayalakshmi A. Affordable image analysis using NIH Image/ImageJ [letter to the editor]. Indian J Cancer. 2004;41:47. [PubMed] [Google Scholar]
- 22.Commean PK, Ju T, Liu L, et al. Tarsal and metatarsal bone mineral density measurement using volumetric quantitative computed tomography. J Digit Imaging. In press. [DOI] [PMC free article] [PubMed]
- 23.Gluer CC, Blake G, Lu Y, et al. Accurate assessment of precision errors: how to measure the reproducibility of bone densitometry techniques. Osteoporos Int. 1995; 5:262–270. [DOI] [PubMed] [Google Scholar]
- 24.Greenspan SL, Bouxsein ML, Melton ME, et al. Precision and discriminatory ability of calcaneal bone assessment technologies [erratum appears in J Bone Miner Res. 1997;12:1957]. J Bone Miner Res. 1997; 12:1303–1313. [DOI] [PubMed] [Google Scholar]
- 25.Greenspan SL, Cheng S, Miller PD, et al. Clinical performance of a highly portable, scanning calcaneal ultrasonometer. Osteoporos Int. 2001; 12:391–398. [DOI] [PubMed] [Google Scholar]
- 26.Sinacore DR, Koger RC, Villareal DT, et al. Precision of serial quantitative ultrasonometry measures of the calcaneus. Abstract presented at: Combined Sections Meeting of the American Physical Therapy Association; February 5, 2003; Tampa, Fla.
- 27.Hologic. Sahara Clinical Bone Sonometer: Clinical User's Guide. Bedford, Mass: Hologic; 1998.
- 28.Genant HK, Cooper C, Poor G, et al. Interim report and recommendations of the World Health Organization Task Force for Osteoporosis. Osteoporos Int. 1999; 10:259–264. [DOI] [PubMed] [Google Scholar]
- 29.Meyers-Rice B, Sugars L, McPoil T, Cornwall MW. Comparison of three methods for obtaining plantar pressures in nonpathologic subjects. J Am Podiatr Med Assoc. 1994; 84:499–504. [DOI] [PubMed] [Google Scholar]
- 30.Fuller EA. Center of pressure and its theoretical relationship to foot pathology. J Am Podiatr Med Assoc. 1999; 89:278–291. [DOI] [PubMed] [Google Scholar]
- 31.Beljan J. Osseous malrepair in calcium-deficient states. Life Sciences & Space Research. 1974; 12:133–139. [DOI] [PubMed] [Google Scholar]
- 32.Nikander R, Sievanen H, Heinonen A, Kannus P. Femoral neck structure in adult female athletes subjected to different loading modalities. J Bone Miner Res. 2005; 20:520–528. [DOI] [PubMed] [Google Scholar]
- 33.Fredericson M, Ngo J, Cobb K. Effects of ball sports on future risk of stress fracture in runners. Clin J Sport Med. 2005; 15:136–141. [DOI] [PubMed] [Google Scholar]
- 34.Lunsford BR, Perry J. The standing heel-rise test for ankle plantar flexion: criterion for normal. Phys Ther. 1995; 75:694–698. [DOI] [PubMed] [Google Scholar]
- 35.Dietary Guidelines for Americans 2005. Available at: http://www.healthierus.gov/dietaryguidelines/. Accessed January 12, 2007.
- 36.Fehling PC, Alekel L, Clasey J, et al. A comparison of bone mineral densities among female athletes in impact loading and active loading sports. Bone. 1995; 17:205–210. [DOI] [PubMed] [Google Scholar]
- 37.Heinonen A, Oja P, Kannus P, et al. Bone mineral density in female athletes representing sports with different loading characteristics of the skeleton. Bone. 1995; 17:197–203. [DOI] [PubMed] [Google Scholar]
- 38.Haapasalo H, Kannus P, Sievanen H, et al. Effect of long-term unilateral activity on bone mineral density of female junior tennis players. J Bone Miner Res. 1998; 13:310–319. [DOI] [PubMed] [Google Scholar]
- 39.Vainionpaa A, Korpelainen R, Leppaluoto J, Jamsa T. Effects of high-impact exercise on bone mineral density: a randomized controlled trial in premenopausal women. Osteoporos Int. 2005; 16:191–197. [DOI] [PubMed] [Google Scholar]
- 40.Heinonen A, Kannus P, Sievanen H, et al. Randomised controlled trial of effect of high-impact exercise on selected risk factors for osteoporotic fractures. Lancet. 1996; 348:1343–1347. [DOI] [PubMed] [Google Scholar]
- 41.Friedlander AL, Genant HK, Sadowsky S, et al. A two-year program of aerobics and weight training enhances bone mineral density of young women. J Bone Miner Res. 1995; 10:574–585. [DOI] [PubMed] [Google Scholar]
- 42.Drinkwater BL, Bruemner B, Chestnut CH III. Menstrual history as a determinant of current bone density in young athletes. JAMA. 1990; 263:545–548. [PubMed] [Google Scholar]
- 43.Findlay SC, Eastell R, Ingle BM. Measurement of bone adjacent to tibial shaft fracture. Osteoporos Int. 2002; 13:980–989. [DOI] [PubMed] [Google Scholar]


