Abstract
The convoluted M bands of the protozoan Stentor coeruleus straighten before the animal contracts. Mechanical stimulation initiates contraction locally, and then contraction spreads over the animal with a propagation velocity of 5 to 25 centimeters per second. The contractile wave may spread in both anterior and posterior directions. Electrical stimulation initiates contraction in all areas of Stentor simultaneously.
The mechanism underlying the ability of the ciliate Stentor to contract has long been an intriguing problem (1). Advances in the investigation of this question have been made through light microscopic observations (2) and electron micrographic studies (2–4). In an earlier cinematic study of Stentor Jones et al. (5) have measured the rate of contraction, showing that the process requires 10 to 20 msec. Early investigators attributed contraction to fibrillar systems running underneath Stentor’s longitudinal rows of body cilia (6). The nature of these fibers remained uncertain until studies with the electron microscope revealed two distinct systems, named the km fibers and the M bands by Randall and Jackson (3). The km fibers are composed of stacks of microtubules, each fiber running the length of the animal. The structure has been implicated as an active extension system (4). The M bands lie beneath the km fibers and are composed of bundles of microfilaments.
Bannister and Tatchell (2) have described the behavior of the M bands in live Stentor coeruleus. The M bands are considerably thicker in contracted animals than in extended ones. They remain straight upon contraction but initially reextend at a faster rate than the rest of the body and are thrown into sinuous folds. These convoluted bands straighten (that is, shorten) upon a second contraction, an indication that they are contractile. In a recent electron microscopic study Huang (4) showed that there is a change in the filaments of the M bands associated with contraction. The filaments are 40 Å in diameter in relaxed Stentor whereas they are 120 Å in diameter in contracted animals. These observations strongly suggest that the M bands are responsible for contraction.
I have conducted a high-speed cinematic analysis of Stentor coeruleus to investigate the response of the M bands during the initial part of the contractile phase and to study the general time course of contraction. A Hycam high-speed movie camera was used in conjunction with a Zeiss Nomarski microscope. Stroboscopic illumination (7), synchronized with the camera, gave an exposure time of 1 to 2 μsec per flash with a total flux level low enough so that there was no noticeable effect on the light-sensitive Stentor. With this arrangement, film speeds of up to 3000 frames per second were achieved. Stentor swam freely in pond water in a 140-μm space between the glass slide and the cover slip. The water was at room temperature, 24°C. Test animals were stimulated mechanically with glass microneedles (diameter of the tip, 0.5 to 5μm) positioned between the slide and the cover slip, and electrically with pulses (1 msec, 10 volts, 0.1 ma) delivered through platinum wires 1.8 cm apart.
Movies were taken of the M bands at 2640 frames per second during the period when they show large convolutions. Electrical stimulation was used to initiate contraction. In every case observed so far, a definite straightening of the M bands was seen to precede contraction of the surrounding area of ectoplasm. Straightening occurs within 1 msec, whereas contraction continues for more than 10 msec.
If contraction were caused by the action of the M bands, they would straighten before the body begins to contract (slack bands cannot exert tension). Conversely, if another mechanism causes contraction and acts before the M bands have shortened, the convolutions would grow larger during the initial phase of contraction. Not only do the M bands shorten at the beginning of the contractile phase, but they are seen to straighten before any contraction of the animal is observed. The results support the theory that the M bands are responsible for contraction.
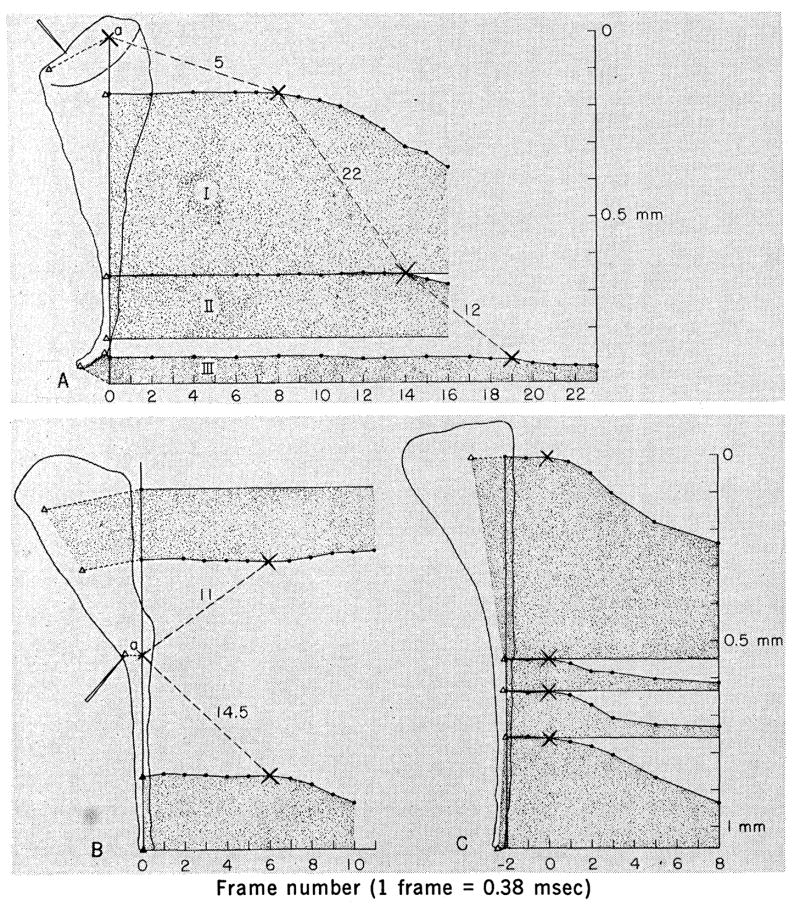
Cinematic analysis has allowed a detailed study of the time course of contraction. When a mechanical stimulus is used, contraction is first seen at the point of stimulation and is then observed to spread over the animal. The spread of the wave which initiates contraction is monitored by measurements of the distance between landmarks (Δ) inside the animal. Vacuoles are transformed from spherical to highly flattened shapes by the contraction, an indication that they are held in a viscous cytoplasmic matrix. Thus they are suitable reference markers. A distinct shortening between two markers is taken to indicate the invasion of the contractile wave into that segment. A “propagation velocity” for the contraction can then be calculated if one knows the distance between two segments and the time interval ΔT to the onset of contraction in those segments.
The time interval between stimulation (both mechanical and electrical) and the onset of contraction varies with stimulus strength. All time measurements have been made with reference to the initiation of contraction, not to stimulation.
The stalk region of Stentor is highly contractile. The onset of contraction in segments in this area is easily determined from an analysis of segment lengths and from the use of a flicker technique in which one alternately views two frames. Wave velocity values calculated from contracting stalk segments (segments II to III in Fig. 1A) are reliable and reproducible. These velocities range from 10 to 20 cm/sec in different trials. Their accuracy is limited by the difficulty associated with determining distances between indistinct markers and by the relatively few frames of film spanned by the contraction. The anterior region of Stentor contracts little, and it is harder to determine the arrival of the contractile wave in this area. Measurements of propagation velocity in anterior segments (segments a to I and I to II in Fig. 1A) have higher uncertainties than those in the stalk. With these values included, the calculated velocities in nine different animals have ranged from 5 to 25 cm/sec.
Fig. 1.
Graphical analysis of contraction. The abscissa shows the time in frames of movie film. The first contractile movement occurs between frames 0 and 1. Sketches of frame 0 are shown to the left. Stentor are divided into segments defined by internal landmarks (Δ). The length of each segment is plotted independently as a function of time. The first sign of contraction in a segment or at a point is marked by ×. The absolute value of the slope of the line connecting ×’s equals the propagation velocity of the contractile wave. Values are given in centimeters per second. (A) Mechanical stimulation of the anterior frontal field. Contraction is first seen at point a. (B) Mechanical stimulation of the stalk. Point a contracts first. (C) Electrical stimulation; all segments contract simultaneously.
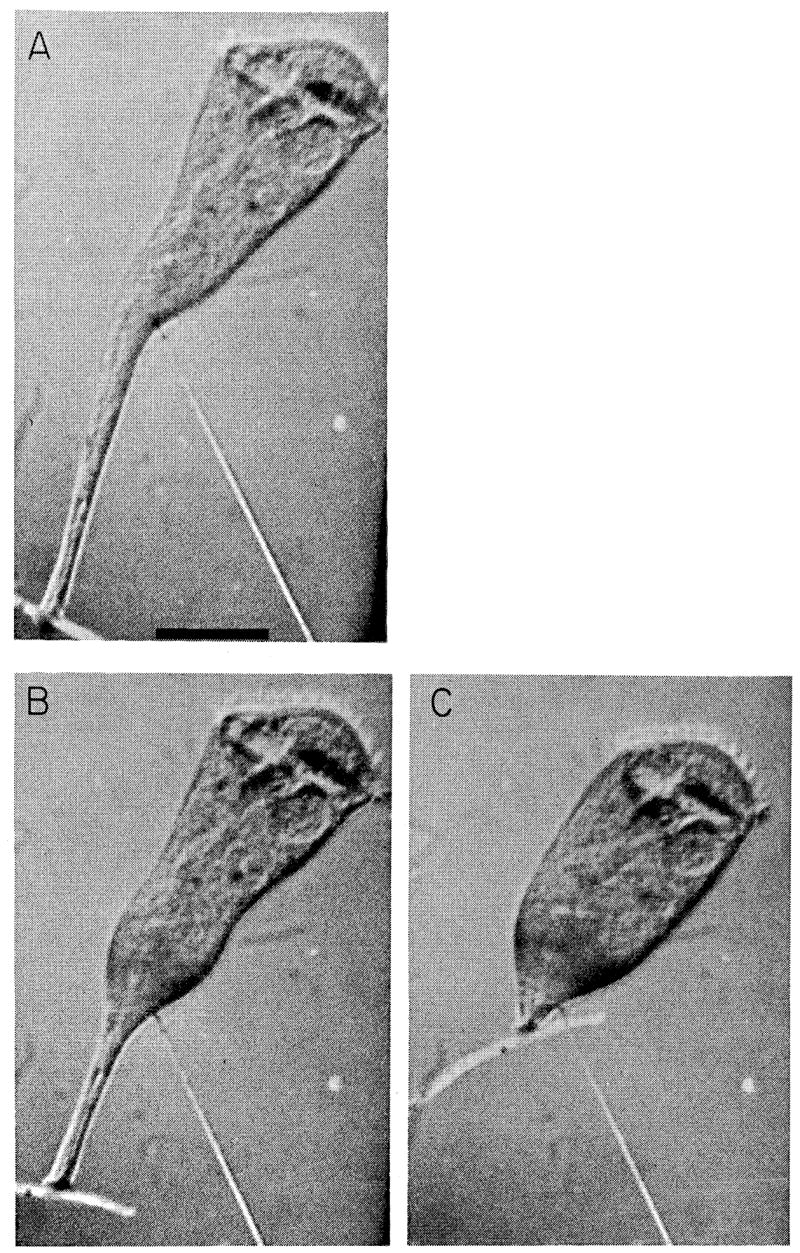
It is possible to initiate contraction locally in the stalk region with a mechanical stimulus, as is illustrated in Fig. 2. A graphical analysis of this contraction (Fig. 1B) shows that the contractile wave is capable of spreading in both anterior and posterior directions. The mechanism responsible for such propagation, at least in the longitudinal direction, is not polarized.
Fig. 2.

Mechanically initiated contraction. Scale marker: 200 μm. (A) The frame preceding the first contractile movement; T = 0. (B) T = 1.9 msec. (C) T = 5.3 msec.
A distinctly different picture of contraction emerges when electrical stimulation is used. Figure 1C displays an example of electrically induced contraction in which all segments begin to contract within the same 0.38-msec interval. This interval is too short to be due to a propagated contractile wave originating from a distinct initiation point as shown by examples of mechanically induced contraction that take several milliseconds to spread across the animal. Electrical stimulation is capable of initiating contraction in many areas of Stentor simultaneously.
References and Notes
- 1.For reviews of the general anatomy and behavior of Stentor, see Jennings HS. Amer J Physiol. 1902;8:23.Tartar V. Biology of Stentor. Pergamon; New York: 1961.
- 2.Bannister LH, Tatchell EC. J Cell Sci. 1968;3:295. doi: 10.1242/jcs.3.2.295. [DOI] [PubMed] [Google Scholar]
- 3.Randall JT, Jackson SF. J Biophys Biochem Cytol. 1958;4:807. doi: 10.1083/jcb.4.6.807. [DOI] [PMC free article] [PubMed] [Google Scholar]
- 4.Huang B. J Cell Biol. Vol. 47. University of California; Berkeley: 1970. p. 92a. thesis. 1971. [Google Scholar]
- 5.Jones AR, Jahn TL, Fonseca JR. J Cell Physiol. 1970;75:1. doi: 10.1002/jcp.1040750102. [DOI] [PubMed] [Google Scholar]
- 6.For a comprehensive review of studies of the fiber system of Stentor, see (3).
- 7.The microscope collector lens system was modified to allow stroboscopic illumination from an FX-11 bulb driven by an EG&G model 501 stroboscope. For details see Edgerton H, Carson J. Appl Opt. 1964;3:1211. A light pipe was placed behind the strobe bulb to permit continual viewing of the test animals
- 8.I thank Dr. J. Lettvin for inspiring this study and for his many suggestions and insights. I also thank Drs. H. Edgerton and S. Raymond for their assistance and encouragement. Supported in part by an Alfred P. Sloan Foundation grant to H. L. Teuber, Department of Psychology, M.I.T., in part by a grant from Bell Telephone Laboratories Inc., and in part by NIH grant 5 PO1 GM14940–05.


