

Abstract
Many clinically important drugs target ligand-gated ion channels; however, the mechanisms by which these drugs modulate channel function remain elusive. Benzodiazepines (BZDs), anesthetics, and barbiturates exert their CNS actions by binding to GABAA receptors and modulating their function. The structural mechanisms by which BZD binding is transduced to potentiation or inhibition of GABA-induced current (IGABA) are essentially unknown. Here, we explored the role of the γ2Q182-R197 region (Loop F/9) in the modulation of IGABA by positive (flurazepam, zolpidem) and negative [3-carbomethoxy-4-ethyl-6,7-dimethoxy-β-carboline (DMCM)] BZD ligands. Each residue was individually mutated to cysteine, coexpressed with wild-type α1 and β2 subunits in Xenopus oocytes, and analyzed using two-electrode voltage clamp. Individual mutations differentially affected BZD modulation of IGABA. Mutations affecting positive modulation span the length of this region, whereas γ2W183C at the beginning of Loop F was the only mutation that adversely affected DMCM inhibition. Radioligand binding experiments demonstrate that mutations in this region do not alter BZD binding, indicating that the observed changes in modulation result from changes in BZD efficacy. Flurazepam and zolpidem significantly slowed covalent modification of γ2R197C, whereas DMCM, GABA, and the allosteric modulator pentobarbital had no effects, demonstrating that γ2Loop F is a specific transducer of positive BZD modulator binding. Therefore, γ2Loop F plays a key role in defining BZD efficacy and is part of the allosteric pathway allowing positive BZD modulator-induced structural changes at the BZD binding site to propagate through the protein to the channel domain.
Keywords: GABA, GABAA receptor, benzodiazepine, efficacy, allosteric modulation, Loop F, zolpidem
Introduction
Members of the Cys-loop family of ligand-gated ion channels (LGICs) control ion permeability of cell membranes by coupling agonist binding to channel opening. Gating of these channels can be allosterically modulated by a number of clinically important drugs. Within the LGIC family, the GABAA receptor (GABAAR) is an excellent model for studying mechanisms underlying allosteric modulation because of the large number of drugs that target this receptor, including benzodiazepines (BZDs), barbiturates, anesthetics, and ethanol. BZDs are among the most widely prescribed drugs in the United States, with ∼80 million prescriptions written each year, and are used for sedation, sleep induction, anxiety relief, muscle spasm relief, epileptic seizure control, and treating some forms of depression (for review, see Mohler et al., 2002).
BZDs exert their effects on the CNS by binding to the GABAAR and allosterically modulating GABA-induced current (IGABA) responses. The BZD binding site is located on the extracellular surface of the GABAAR and is formed by residues located in at least six noncontiguous regions at the α/γ interface historically designated Loops A-F (Fig. 1A) (for review, see Sigel, 2002). This site binds a large selection of structurally diverse ligands (Fig. 1B), including agonists that potentiate GABA-mediated Cl− current (IGABA) [positive modulators such as flurazepam (FZM) and zolpidem (ZPM)], inverse agonists that inhibit IGABA [negative modulators such as 3-carbomethoxy-4-ethyl-6,7-dimethoxy-β-carboline (DMCM)], and antagonists that bind at the BZD site but have no effect on IGABA (zero modulators such as Ro15-1788). The structural elements that couple BZD binding to modulation of IGABA are only beginning to be defined, and the mechanisms by which certain BZD ligands potentiate IGABA, whereas others inhibit (i.e., BZD efficacy), remain unknown. Because the therapeutic value of BZDs depends on their ability to modulate IGABA, we sought to map the structural elements underlying BZD efficacy.
Figure 1.

The GABAA receptor α1/γ2 interface and structures of benzodiazepine binding site ligands. A, Homology model of the α1 (red) and γ2 (blue) subunits of the GABAA receptor (Mercado and Czajkowski, 2006). BZD binding site Loops A-E are highlighted in yellow; Loop F is green. The dashed lines indicate the limits of the cell membrane. B, Structures of BZD binding site ligands used in this study.
Previously, using γ2/α1 chimeric subunits, we identified residues located near the channel domain of the γ2 subunit (in the pre-M1 region, the extracellular end of M2, and the M2-M3 extracellular loop) that are required for modulation of IGABA by BZD-positive modulators (Boileau et al., 1998; Boileau and Czajkowski, 1999). Interestingly, the identified γ2 subunit residues were not critical for inhibition of IGABA by the BZD site inverse agonist DMCM (Boileau and Czajkowski, 1999), suggesting negative allosteric modulation is governed by structural elements distinct from that of positive allosteric modulation. In the γ2 subunit, a stretch of ∼20 residues called Loop F links the BZD binding site to the beginning of β-strand 9 near the transmembrane channel gating domain (Fig. 1A) and, thus, is in an ideal position to transduce BZD binding site movements to movements near the channel domain. Previous studies examining the related acetylcholine binding protein (Gao et al., 2005; Hibbs et al., 2006), the nicotinic acetylcholine receptor (Leite et al., 2003; Lyford et al., 2003), the serotonin type-3A receptor (Thompson et al., 2006), and the GABAAR agonist binding site interface (Newell and Czajkowski, 2003) support the idea that the Loop F region is dynamic. Here, we used the substituted cysteine accessibility method (SCAM) to test the idea that γ2Loop F plays a role in differentiating the efficacy of allosteric modulation and that positive and negative allosteric modulator binding to the BZD site initiates distinct conformational movements within this region.
Materials and Methods
Site-directed mutagenesis.
Rat cDNA encoding α1, β2, and γ2L receptor subunits in the pUNIV vector (Venkatachalan et al., 2007) were used for all molecular cloning and functional studies. This vector [kindly provided by S. Venkatachalan and A. Boileau (Department of Physiology, University of Wisconsin-Madison, Madison, WI)] is advantageous, because it can be used for expression in Xenopus oocytes and mammalian human embryonic kidney 293 (HEK293) cells without further subcloning. All γ2L cysteine mutants were made by recombinant PCR and verified by double-stranded DNA sequencing.
Expression in Xenopus laevis oocytes.
Capped cRNA was transcribed in vitro from NotI-linearized cDNA using the mMessage mMachine T7 kit (Ambion, Austin, TX). Oocytes were harvested from X. laevis and prepared as described previously (Boileau et al., 1998). Oocytes were injected within 24 h of treatment with 27 nl (1–15 pg/nl/subunit) in the ratio 1:1:10 (α:β:γ) (Boileau et al., 2002) and stored at 16°C in ND96 buffer (in mm: 96 NaCl, 2 KCl, 1 MgCl2, 1.8 CaCl2, 5 HEPES, pH 7.2) supplemented with 100 μg/ml gentamycin and 100 μg/ml BSA until used for electrophysiological recordings.
Two-electrode voltage clamp.
Oocytes were perfused continuously (5 ml/min) with ND96 while held under two-electrode voltage clamp at −80 mV in a bath volume of 200 μl. Borosilicate glass electrodes (0.4–1.0 MΩ) (Warner Instruments, Hamden, CT) used for recordings were filled with 3 m KCl. Electrophysiological data were collected using GeneClamp 500 (Molecular Devices, Sunnyvale, CA) interfaced to a computer with a Digidata 1200 A/D device (Molecular Devices) and were recorded using the Whole Cell Program, v.3.6.7 (kindly provided by J. Dempster, University of Strathclyde, Glasgow, UK).
Concentration–response analysis.
Six to ten concentrations of GABA were used for each determination of GABA EC50 value. Each response was scaled to a low, non-desensitizing concentration of GABA (EC1–5) applied just before the test concentration to correct for any drift in IGABA responsiveness over the course of the experiment. All concentration–response data were fit by the following equation: I = Imax/[1 + (EC50/[A]n)], where I is the peak response to a given drug concentration, Imax is the maximum amplitude of current, EC50 is the drug concentration that produces a half-maximal response, [A] is drug concentration, and n is the Hill coefficient using Prism v.4.0 (GraphPad Software, San Diego, CA). BZD modulation was defined as follows: [(IGABA+BZD/IGABA) − 1], where IGABA+BZD is the current response in the presence of GABA and BZD, and IGABA is the current evoked by GABA alone. BZD modulation (6–7 different concentrations) was measured at 1 μm GABA (EC2–5). The reported values for maximum potentiation represent IGABA potentiation in the presence of 3 μm FZM and 10 μm ZPM, respectively.
Methanethiosulfonate modification.
Four derivatives of methanethiosulfonate (MTS) were used to covalently modify the introduced cysteines: MTS-ethylammonium biotin (MTSEA-Biotin), MTS-ethyltrimethylammonium (MTSET), MTS-ethylsulfonate (MTSES), and N-biotinylcaproylaminoethyl-MTS (MTSEA-Biotin-CAP) (Toronto Research Chemicals, Toronto, Ontario, Canada). All GABA responses were stabilized before application of MTS reagents by applying GABA (EC50) at 6 min intervals until the peak currents varied by <5%. After achieving current stability, IGABA was measured followed by a 1 min wash, 2 mm MTS was then bath-applied for 2 min, the oocyte was washed for 3 min, and IGABA were remeasured. The effect of the MTS reagent was calculated as follows: ([(IGABAafter/IGABAbefore) − 1] × 100). FZM responses measuring 1 μm GABA and 1 μm GABA plus 1 μm FZM were made similarly. The effect of the MTS reagent on FZM potentiation was calculated as follows: ([(FZM potentiationafter/FZM potentiationbefore) − 1] × 100).
MTS rates of reaction.
The rate of sulfhydryl-specific covalent modification of α1β2γ2R197C receptors was determined by measuring the effect of sequential subsaturating applications of MTSET on the potentiation of IGABA by FZM. After achieving current stability, IGABA and IGABA+FZM were measured by applying 1 μm GABA followed by 1 μm GABA plus 1 μm FZM, the oocyte was washed for 2 min, then 5 mm MTSET was applied for 10 s, the oocyte was washed for 3 min, and IGABA and IGABA+FZM were redetermined. The entire protocol was repeated until the reaction was complete (IGABA and IGABA+FZM no longer changed). The increase in FZM potentiation of IGABA was plotted versus cumulative time of MTS exposure and fit to the single-exponential association equation: Y = Ymax(1 − e−kt), where k is the pseudo-first-order rate constant of the reaction (Prism; GraphPad Software). The second-order rate constant (k2) was calculated by dividing k by the concentration of MTS reagent used (Pascual and Karlin, 1998). The calculated k2 was similar when the decrease in IGABA after MTS modification was used. This is consistent with the MTS reagent reacting with a single cysteine and the increase in BZD potentiation and decrease in IGABA being linked. The values for second-order rate constants reported here represent those calculated from changes in FZM potentiation of IGABA. The effects of different ligands on the rate of MTS modification were assayed by coapplying FZM (5 μm), ZPM (1 μm), DMCM (1 μm), GABA (100 μm), or pentobarbital (PB) (low, 50 μm; high, 500 μm) with the MTS reagent. Wash times were adjusted depending on the ligand used and were predetermined to ensure in each case that application of ligand alone (no MTS) during the protocol had no significant effect on the measured response.
Radioligand binding.
HEK293T cells were grown in minimum essential medium with Earle's salts (Invitrogen, Grand Island, NY) containing 10% fetal bovine serum in a 37°C incubator under 5% CO2 atmosphere. For binding experiments, cells were plated on 100 mm dishes and transiently transfected with pUNIV-α1, pUNIV-β2, and either pUNIV-γ2 or mutant pUNIV-γ2 DNA at ∼40% confluency (Venkatachalan et al., 2007) using a standard CaHPO4 precipitation method (Graham and van der Eb, 1973). In general, cells were transfected with equal ratios of subunit DNA (4 μg/subunit). Cells were harvested, and membrane homogenates were prepared 48 h posttransfection as described previously (Boileau et al., 1998). Briefly, membrane homogenates (100 μg) were incubated at room temperature for 40 min with a sub-Kd (equilibrium dissociation constant of the radioligand) concentration of radioligand ([3H] Ro15-1788; 83.4 Ci/mmol; PerkinElmer Life and Analytical Sciences, Waltham, MA) in the absence or presence of seven different concentrations of unlabeled ligand in a final volume of 250 μl. Data were fit by nonlinear regression to a one-site competition curve defined by the following equation: y = Bmax/[1 + (x/IC50)], where y is bound [3H] ligand in disintegrations per minute, Bmax is maximal binding, x is the concentration of displacing ligand, and IC50 is the concentration of unlabeled ligand that inhibits 50% of [3H] ligand binding (Prism; GraphPad Software). Values of equilibrium dissociation constant for the unlabeled ligand (Ki) were calculated using the Cheng-Prusoff/Chou equation: Ki = IC50/(1 + L/Kd), where L is the concentration of radioligand.
Statistical analysis.
All electrophysiological data are from at least three different oocytes from at least two different frogs. Binding data represent mean ± SD from three experiments performed in triplicate. The data were analyzed by one-way ANOVA with Dunnett's posttest for significance of differences (StatView version 5.0.1; SAS Institute, Cary, NC).
Results
Cysteine mutations in γ2Loop F differentially affect BZD modulation of IGABA
To elucidate the role of Loop F residues in BZD modulation of IGABA, 16 single cysteine mutations were made from Q182-R197 in the γ2L subunit of the GABAAR. The mutant subunits were then coexpressed with wild-type (WT) α1 and β2 subunits in Xenopus oocytes and characterized using two-electrode voltage clamp. The majority of the mutations had no effect on GABA EC50 values, with four mutations decreasing GABA EC50 values only ∼2.5-fold when compared with WT α1β2γ2 receptors (26.4 ± 5.5 μm) (Table 1). None of the mutations affected the calculated Hill coefficient for GABA-mediated activation (Table 1). These results indicate that the cysteine substitutions were well tolerated.
Table 1.
Summary of GABA, flurazepam, and zolpidem concentration–response data from WT and mutant α 1β 2γ 2 receptors
| Receptor | GABA |
Flurazepam |
Zolpidem |
||||||||
|---|---|---|---|---|---|---|---|---|---|---|---|
| EC50 (μm) | nH | n | Maximum potentiation | EC50 (nm) | nH | n | Maximum potentiation | EC50 (nm) | nH | n | |
| αβγ | 26.4 ± 5.5 | 1.2 ± 0.2 | 7 | 2.58 ± 0.25 | 272 ± 45 | 1.0 ± 0.1 | 8 | 4.46 ± 0.26 | 335 ± 58 | 0.8 ± 0.0 | 7 |
| αβγQ182C | 29.3 ± 4.2 | 1.4 ± 0.3 | 3 | 2.23 ± 0.06 | 163 ± 10 | 1.0 ± 0.1 | 3 | 4.06 ± 0.51 | 237 ± 17 | 0.9 ± 0.1 | 4 |
| αβγW183C | 24.1 ± 2.6 | 1.5 ± 0.2 | 3 | 0.55 ± 0.06** | 303 ± 100 | 1.3 ± 0.1 | 3 | 1.54 ± 0.30** | 376 ± 63 | 0.9 ± 0.2 | 5 |
| αβγK184C | 28.0 ± 6.9 | 1.5 ± 0.1 | 5 | 2.59 ± 0.24 | 208 ± 37 | 1.0 ± 0.0 | 3 | 4.88 ± 0.33 | 442 ± 121 | 0.8 ± 0.1 | 3 |
| αβγR185C | 10.7 ± 3.5** | 1.5 ± 0.3 | 3 | 2.81 ± 0.26 | 214 ± 27 | 1.1 ± 0.1 | 3 | 4.42 ± 0.61 | 260 ± 45 | 1.0 ± 0.1 | 3 |
| αβγS186C | 23.0 ± 4.0 | 1.4 ± 0.0 | 3 | 2.36 ± 0.18 | 244 ± 20 | 1.0 ± 0.0 | 3 | 4.46 ± 0.43 | 592 ± 47** | 0.8 ± 0.1 | 4 |
| αβγS187C | 21.6 ± 3.5 | 1.6 ± 0.1 | 3 | 2.44 ± 0.25 | 257 ± 74 | 1.0 ± 0.1 | 3 | 5.04 ± 0.66 | 299 ± 31 | 0.8 ± 0.0 | 3 |
| αβγV188C | 22.8 ± 6.0 | 1.4 ± 0.1 | 3 | 2.74 ± 0.17 | 253 ± 61 | 1.0 ± 0.0 | 3 | 4.75 ± 0.15 | 436 ± 46 | 0.8 ± 0.1 | 3 |
| αβγE189C | 16.6 ± 6.2 | 1.5 ± 0.1 | 4 | 1.48 ± 0.14** | 554 ± 108** | 0.9 ± 0.1 | 4 | 4.14 ± 0.63 | 679 ± 45** | 0.9 ± 0.1 | 4 |
| αβγV190C | 24.0 ± 3.4 | 1.6 ± 0.1 | 4 | 3.22 ± 0.31** | 434 ± 32** | 1.1 ± 0.2 | 3 | 4.22 ± 0.44 | 333 ± 32 | 0.9 ± 0.1 | 3 |
| αβγG191C | 11.1 ± 2.3** | 1.6 ± 0.2 | 4 | 3.83 ± 0.41** | 675 ± 120** | 1.1 ± 0.1 | 4 | 4.49 ± 0.25 | 439 ± 95 | 0.9 ± 0.1 | 3 |
| αβγD192C | 17.3 ± 3.5 | 1.5 ± 0.2 | 3 | 2.00 ± 0.25** | 282 ± 87 | 0.9 ± 0.1 | 4 | 3.85 ± 0.19 | 283 ± 59 | 0.9 ± 0.1 | 3 |
| αβγT193C | 23.7 ± 4.0 | 1.5 ± 0.2 | 3 | 2.67 ± 0.17 | 348 ± 55 | 1.0 ± 0.1 | 3 | 4.27 ± 0.06 | 309 ± 33 | 0.9 ± 0.0 | 3 |
| αβγR194C | 11.0 ± 4.2** | 1.4 ± 0.2 | 3 | 2.39 ± 0.24 | 238 ± 64 | 1.0 ± 0.2 | 6 | 3.12 ± 0.22* | 173 ± 46* | 1.0 ± 0.1 | 3 |
| αβγS195C | 29.6 ± 2.1 | 1.3 ± 0.1 | 3 | 2.02 ± 0.28** | 183 ± 78 | 1.1 ± 0.1 | 4 | 3.35 ± 0.53* | 192 ± 13* | 0.9 ± 0.0 | 3 |
| αβγW196C | 10.3 ± 2.1** | 1.1 ± 0.2 | 3 | 2.26 ± 0.12 | 357 ± 47 | 1.1 ± 0.2 | 5 | 4.37 ± 0.51 | 374 ± 37 | 0.8 ± 0.1 | 3 |
| αβγR197C | 17.4 ± 4.7 | 1.2 ± 0.1 | 4 | 0.64 ± 0.12** | 114 ± 43* | 1.2 ± 0.0 | 3 | 1.46 ± 0.20** | 92 ± 13** | 1.0 ± 0.1 | 3 |
EC50 values were derived by nonlinear regression of the concentration–response data as described in Materials and Methods. Flurazepam and zolpidem potentiation of IGABA (EC2–5) was calculated as follows: [(IGABA + BZD/IGABA) − 1]. Maximum potentiation values represent potentiation in the presence of 3 μ m FZM and 10 μ m ZPM, respectively. Data represent mean ± SD from n experiments. nH, Calculated Hill coefficient. Values significantly different from WT receptors are indicated (*p < 0.05; **p < 0.01).
Because the presence of a γ2 subunit confers BZD sensitivity to the GABAAR, functional expression of mutant γ2 subunits can be evaluated by measuring BZD modulation of IGABA. Although FZM potentiated GABA (EC2–5) currents elicited from all of the mutant receptors, maximum potentiation was significantly reduced for γ2W183C, γ2E189C, γ2D192C, γ2S195C, and γ2R197C-containing receptors compared with WT receptors (p = 2.6 ± 0.3) (Fig. 2) (Table 1). Aside from γ2W183C, the mutations that significantly altered maximum FZM modulation of IGABA were clustered into two distinct groups: γ2E189C-D192C located in the middle of Loop F, and γ2S195C and γ2R197C near the transmembrane channel domain. Cysteine substitution at γ2E189, γ2V190, and γ2G191 in the middle of Loop F also caused small (1.6- to 2.5-fold) but significant rightward shifts in FZM EC50, whereas γ2R197C caused a significant leftward shift (2.4-fold) compared with WT receptors (EC50, 272 ± 45 nm) (Table 1). FZM-associated Hill coefficients were not different from WT values for any of the mutants (Table 1).
Figure 2.

Cysteine mutations in γ2Loop F affect the potentiation of IGABA by flurazepam and zolpidem. A, Potentiation of 1 μm GABA responses by 3 μm FZM (left) and 10 μm ZPM (right) is graphed for WT and γ2-mutant receptors. Dashed lines indicate the level of WT potentiation. Black bars indicate mutants in which the change in potentiation was significantly different from WT receptors (*p < 0.05; **p < 0.01). Data represent mean ± SD from at least three separate experiments. B, Concentration–response curves of WT and three representative mutant receptors: α1β2γ2W183C, α1β2γ2E189C, and α1β2γ2R197C. Current responses (GABA EC2–5) were recorded from oocytes expressing α1, β2, and γ2- or γ2- mutant subunits after treatment with increasing concentrations of FZM (left) or ZPM (right). The potentiation response ratio (y-axis) was calculated as [(IGABA+BZD/IGABA) − 1]. Data were fit by nonlinear regression, as described in Materials and Methods, and represent mean ± SD from at least three cells from two or more batches of oocytes. Maximum potentiation, EC50 values, and Hill coefficients are presented in Table 1. Insets, The same data are plotted after normalizing to the maximum potentiation for each receptor to show differences in BZD EC50.
We also examined the effects of the γ2Loop F mutations on ZPM potentiation and DMCM inhibition of IGABA, two other drugs that bind to the BZD site. The nonclassical BZD ZPM potentiates WT α1β2γ2 receptors with a higher efficacy than FZM (p = 4.5 vs p = 2.6) (Table 1). Interestingly, we found that the Loop F mutations that affect ZPM potentiation only partially overlap with those that affect FZM modulation. Similar to the effect observed for FZM, the γ2S195C mutation caused a relatively small decrease in ZPM potentiation (1.3-fold), whereas the γ2W183C and γ2R197C mutations caused much larger reductions in both FZM (approximately fourfold) and ZPM (approximately threefold) potentiation (Fig. 2, Table 1). In contrast, cysteine substitution of γ2R194 significantly reduced maximum ZPM potentiation but had no effect on FZM potentiation, whereas the mutations in the middle of Loop F, γ2E189C-D192C, which altered FZM efficacy, had no effect on ZPM maximal potentiation. Several mutations (γ2S186C, E189C, R194C, S195C, and R197C) produced small (1.8- to 3.6-fold) changes in ZPM EC50 values (Table 1).
Surprisingly, except for γ2W183C, the mutations had no effect on the maximal inhibition of IGABA by the BZD inverse agonist DMCM (Fig. 3A,B). The average maximal inhibition of IGABA in the presence of 1 μm DMCM for WT and most mutant receptors ranged from (−0.62 to −0.73), whereas DMCM inhibition was significantly less for α1β2γ2W183C receptors (−0.26 ± 0.08) (Fig. 3A). Therefore, of all the mutations, only γ2W183C decreased FZM, ZPM, and DMCM modulation of IGABA.
Figure 3.
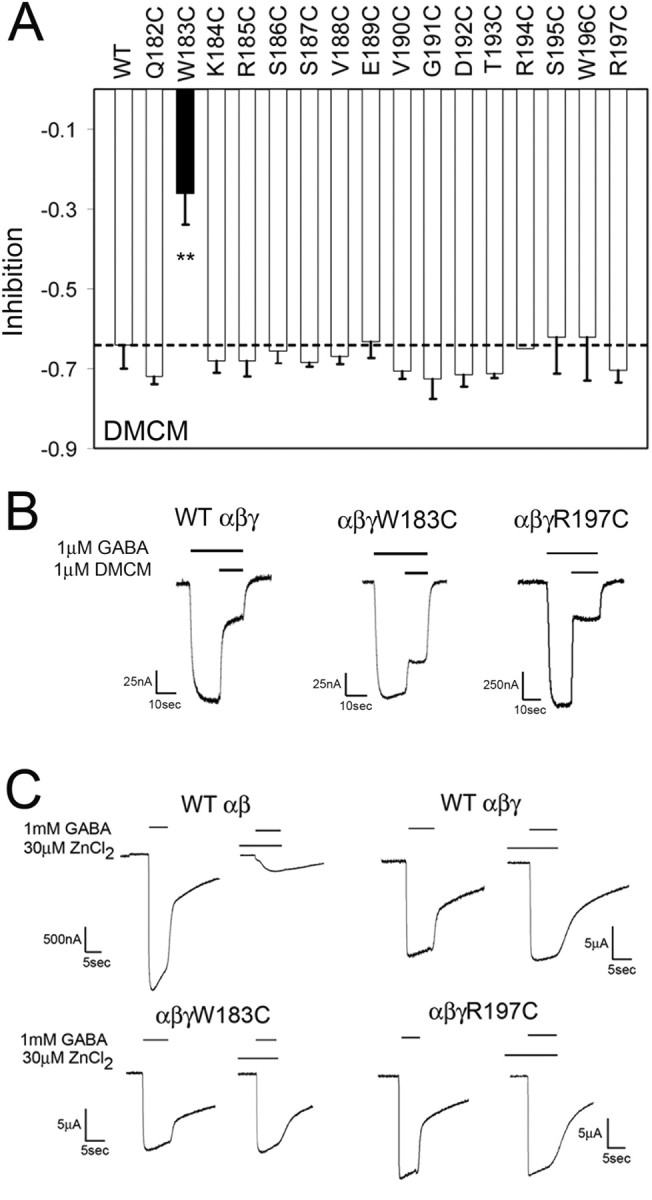
DMCM modulation and Zn2+ sensitivity of WT and mutant GABAA receptors. A, Maximal inhibition of 1 μm GABA responses by DMCM (1 μm) is graphed for WT and γ2-mutant receptors. The dashed line indicates the level of WT inhibition. The black bar for γ2W183C indicates that the change in modulation was significantly different from WT receptors (**p < 0.01). Data represent mean ± SD from at least three separate experiments. B, Representative current traces for negative modulation of 1 μm GABA by 1 μm DMCM from oocytes injected with WT, α1β2γ2W183C, and α1β2γ2R197C receptors. Inhibition of GABA current was calculated as [(IGABA+DMCM/IGABA) − 1]. C, Representative current traces from oocytes expressing α1β2, α1β2γ2, α1β2γ2W183C, and α1β2γ2R197C receptors. In each case, currents were recorded after application of 1 mm GABA in the presence or absence of 30 μm ZnCl2. When ZnCl2 was used, it was preapplied to the oocyte for 20 s before application of GABA.
It is possible that the observed reductions in BZD efficacy were caused by a decreased fraction of functional GABAARs at the cell surface containing the mutant γ2 subunits (i.e., the majority of the expressed receptors could be α1β2, which do not respond to BZDs but do form GABA-gated channels (Boileau et al., 2002). To test this possibility, we measured the Zn2+ sensitivity of α1β2γ2W183C and α1β2γ2R197C receptors. GABAARs composed of α1β2 subunits are more sensitive to Zn2+ blockade than α1β2γ2 receptors; thus, Zn2+ sensitivity of IGABA can be used to assess γ2 subunit expression (Draguhn et al., 1990; Gingrich and Burkat, 1998). When 30 μm ZnCl2 was coapplied with 1 mm GABA, IGABA was reduced by 84 ± 5% in α1β2 receptors but only by 6 ± 2% in α1β2γ2 receptors (Fig. 3C). For α1β2γ2W183C and α1β2γ2R197C receptors, IGABA changed by only 5 ± 5 and 2 ± 2%, respectively, in the presence of Zn2+ (Fig. 3C), demonstrating that cysteine substitution of residues Trp183 and Arg197 does not impair γ2-subunit assembly or incorporation into functional GABAARs. The observation that DMCM inhibits IGABA in the majority of mutant receptors to the same extent as WT α1β2γ2 receptors also argues against impaired γ2 subunit expression. Therefore, the observed changes in BZD modulation are likely the result of impaired BZD binding and/or coupling of BZD binding to modulation of IGABA (i.e., BZD efficacy).
Mutations in γ2Loop F do not affect BZD binding
Because of their proximity to the BZD binding site, it is possible that some of the cysteine mutations in Loop F affect BZD binding. Therefore, to determine whether the observed effects on maximum response and EC50 value (Figs. 2, 3; Table 1) were the result of altered binding affinity, we measured the abilities of FZM, ZPM, and DMCM to competitively displace the binding of [3H] Ro15-1788 (a BZD antagonist that presumably causes little change in receptor function compared with an agonist or inverse agonist) for a subset of the cysteine mutants. For these experiments, we analyzed one mutant from the beginning (γ2W183C), middle (γ2E189C), and end (γ2R197C) of Loop F, respectively, which had the largest changes in maximum BZD potentiation and/or BZD EC50 value (Table 1). In each case, the mutant γ2 subunits were heterologously expressed with WT α1 and β2 subunits in HEK293 cells. Each mutant receptor bound Ro15-1788 with similar affinity (Fig. 4, Table 2), suggesting cysteine substitution in these receptors does not significantly alter the BZD binding site. We found that none of the mutations decreased the apparent binding affinities of FZM, ZPM, or DMCM, although one mutation, γ2R197C, slightly increased the apparent affinity for FZM and ZPM (2.3- to 2.4-fold) (Fig. 4, Table 2). Therefore, these data indicate that the observed decreases in maximum potentiation by FZM and ZPM and the maximum inhibition by DMCM are likely caused by changes in efficacy for these drugs, rather than impaired BZD binding.
Figure 4.

Cysteine mutations in γ2Loop F do not significantly alter benzodiazepine binding to the GABAA receptor. Representative radioligand binding curves depict the displacement of [3H] Ro15-1788 binding by unlabeled Ro15-1788 (top left), flurazepam (top right), zolpidem (bottom left), and DMCM (bottom right) for WT, α1β2γ2W183C, α1β2γ2E189C, and α1β2γ2R197C receptors, where each point is the mean ± SEM of triplicate measurements. Data were fit by nonlinear regression as described in Materials and Methods. Ki values are reported in Table 2.
Table 2.
Binding affinities of Ro15-1788, flurazepam, zolpidem, and DMCM for wild-type (α 1β 2γ 2) and mutant receptors
| Receptor | Ro15–1788 |
Flurazepam |
Zolpidem |
DMCM |
||||
|---|---|---|---|---|---|---|---|---|
| Ki | n | Ki | n | Ki | n | Ki | n | |
| αβγ | 5.1 ± 1.5 | 3 | 165 ± 23 | 5 | 108 ± 22 | 3 | 10.8 ± 2.4 | 3 |
| αβγW183C | 4.6 ± 0.4 | 3 | 117 ± 7 | 3 | 213 ± 57 | 3 | 5.5 ± 0.6 | 3 |
| αβγE189C | 7.7 ± 2.4 | 3 | 213 ± 40 | 3 | 198 ± 10 | 4 | 16.8 ± 3.5 | 3 |
| αβγR197C | 5.1 ± 1.0 | 4 | 68 ± 12* | 3 | 47 ± 7 | 3 | 20.4 ± 5.5 | 3 |
Ki values were determined by displacement of [3H] Ro15-1788 binding and represent the equilibrium dissociation constant (apparent affinity) of the unlabeled ligand. Data represent mean ± SD for n experiments. Values significantly different from WT receptors are indicated (*p < 0.05).
Modification of substituted cysteines by MTS reagents
SCAM has been used previously to probe the structure and conformational dynamics of the BZD binding site (Teissere and Czajkowski, 2001), the GABA binding site (Boileau et al., 1999; Wagner and Czajkowski, 2001; Newell and Czajkowski, 2003; Kloda and Czajkowski, 2007), and the channel domain of the GABAAR (Xu and Akabas, 1996; Williams and Akabas, 1999, 2000). In this method, single cysteine mutants are treated with sulfhydryl-specific MTS reagents that preferentially derivatize water-accessible cysteine residues, because they react faster with ionized cysteines than with nonionized cysteines (Karlin and Akabas, 1998). Accessibility of the cysteine is defined here by observing whether changes in receptor function (e.g., changes in IGABA or BZD potentiation of IGABA) occur after treatment, although functionally silent reactions may also occur.
Initially, we measured IGABA (EC50) in Xenopus oocytes expressing WT α1β2γ2 or α1β2γ2-mutant GABAARs before and after treatment with MTSEA-Biotin (Fig. 5A), a relatively large, membrane-impermeant MTS compound that has no functional effect on WT GABAARs (Fig. 5D,E) (Boileau et al., 1999; Teissere and Czajkowski, 2001). We found that MTSEA-Biotin treatment significantly increased IGABA in receptors containing γ2S186C, γ2V188C, γ2T193C, and γ2S195C and decreased IGABA in α1β2γ2W196C receptors (Fig. 5B,D). Because the native Loop F region is composed of a variety of amino acids with diverse chemical properties, we tried several additional MTS reagents of different size and composition (MTSES, MTSEA-Biotin-CAP, MTSET) to detect functional effects we may have missed with MTSEA-Biotin. In addition to the effects observed with MTSEA-Biotin, MTSET also significantly increased IGABA in receptors containing γ2G191C and reduced IGABA in α1β2γ2R194C and α1β2γ2R197C receptors (Fig. 5D). Treatment with MTSEA-Biotin-CAP significantly increased IGABA in α1β2γ2S186C (33 ± 10%), α1β2γ2S187C (67 ± 24%), α1β2γ2V188C (112 ± 16%), and α1β2γ2G191C (23 ± 3%) receptors. Because none of the MTS reagents affected the peak current amplitude elicited by a saturating concentration of GABA (data not shown), the MTS-mediated increases in IGABA likely reflect a leftward shift in the GABA concentration–response curve. Likewise, the reduction in IGABA (−22 to −33%) after MTS treatment of γ2R194C-, γ2W196C-, and γ2R197C-containing receptors (Fig. 5D) likely reflects a rightward shift.
Figure 5.

MTS modification of γ2Loop F mutants affects IGABA and flurazepam potentiation. A, Structures and lengths (in angstroms) of MTS reagents used in this study. Lengths represent only the portion of the MTS reagent that covalently modifies an introduced cysteine. B, Representative current traces from α1β2γ2V188C receptors recorded during application of GABA (EC50) before and after treatment with 2 mm MTSEA-Biotin for 2 min. Note the increase in IGABA after treatment. C, Representative current traces from α1β2γ2R197C receptors showing FZM modulation of IGABA before and after a 2 min treatment with 2 mm MTSEA-Biotin. I bars denote potentiation of IGABA measured during application of 1 μm FZM in the presence of 1 μm GABA. Note the increase in potentiation after treatment. D, Changes in IGABA (GABA EC50) for WT and γ2-mutant receptors after a 2 min, 2 mm application of MTSEA-Biotin (black bars) or MTSET (gray bars) are graphed. Percentage change is defined as follows: ([(IGABA after/IGABA before) − 1] × 100). Error bars represent mean ± SD of at least three independent experiments. Values significantly different from WT are indicated (*p < 0.05; **p < 0.01). E, Changes in FZM potentiation after 2 min, 2 mm MTSEA-Biotin modification of WT and γ2-mutant receptors. The percentage change in FZM potentiation is defined as follows: ([(FZM potentiationafter/FZM potentiationbefore) − 1] × 100). Values significantly different from WT are indicated (**p < 0.01).
For several of the cysteine mutants, we also examined FZM potentiation of IGABA as a readout for MTS accessibility. FZM potentiation was significantly decreased for γ2S187C-, γ2V188C-, and γ2R194C-containing receptors after treatment with MTSEA-Biotin, whereas modification of α1β2γ2R197C receptors increased FZM potentiation (Fig. 5C,E). The fact that MTS modification of γ2R197C increased FZM potentiation indicates that γ2R197C is not in the BZD binding site, which is consistent with our radioligand binding data that demonstrate γ2R197C has little effect on the apparent binding affinities of FZM, ZPM, DMCM, and Ro15-1788. Overall, 9 of the 16 cysteines introduced in Loop F are accessible to modification, and these are located near the middle and end of the Loop F region.
Positive BZD modulators cause conformational changes in γ2Loop F
SCAM is especially useful for detecting structural movements in the protein induced by ligand binding. If the rate of reaction of a cysteine with an MTS reagent changes when a ligand is present, this indicates that the environment around the cysteine has changed because of movements at, or near, the introduced cysteine. Here, we compared ligand-induced changes in reaction rates of substituted cysteines in the presence of various BZDs (agonists, flurazepam and zolpidem; inverse agonist, DMCM), as well as GABA, and pentobarbital to test the hypothesis that BZDs induce movement in γ2 Loop F, and that BZDs with different efficacies induce different conformational changes in this region.
Because rate experiments require measuring small changes in the response after repeated subsaturating applications of MTS, they are most easily and accurately measured when the total change in IGABA or potentiation of IGABA caused by cysteine modification is relatively large (i.e., >50%). We chose to use α1β2γ2R197C receptors for our rate experiments for two reasons. First, of all the mutants and reagents tested, FZM potentiation of IGABA in γ2R197C-containing receptors changed the most after treatment with MTSET (167 ± 18%) (Fig. 6A). Second, this residue is located outside the ligand binding site as evidenced by the observed increase in FZM potentiation after MTS treatment (Figs. 5, 6), homology modeling of the GABAAR (Fig. 7), and in silico ligand docking in the BZD site (Sancar et al., 2007). Therefore, any observed changes in MTS reaction rates in the presence of BZD ligands at this position will not be the result of the MTS reagent directly blocking the binding site but rather will reflect BZD-induced conformational movements of the protein near the selected residue.
Figure 6.
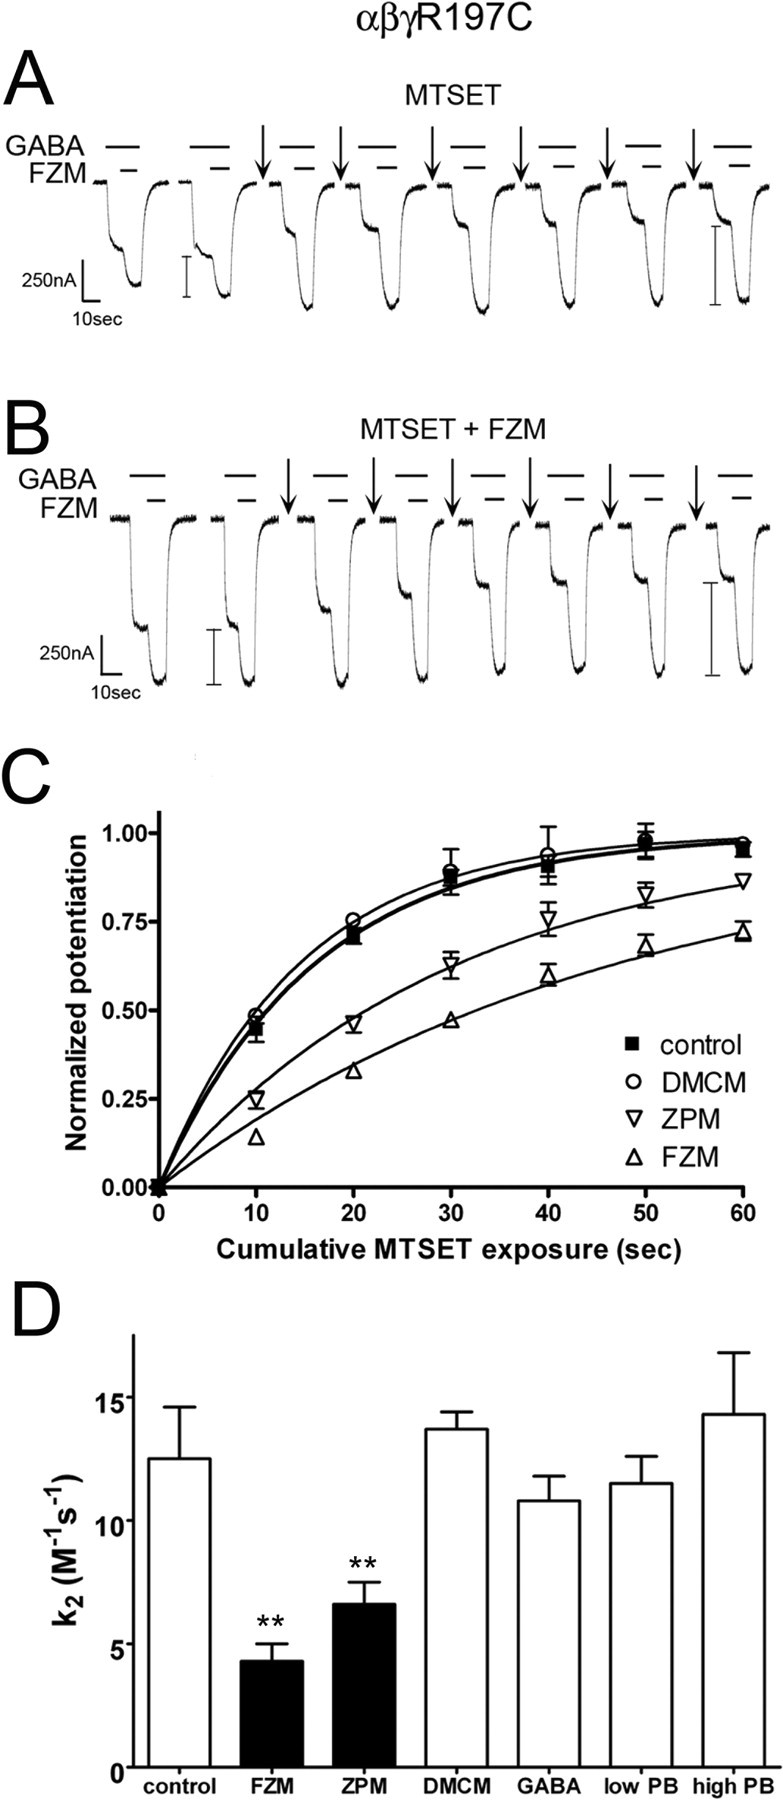
Positive BZD modulators alter the rate of MTS modification of α1β2γ2R197C receptors. The rate of sulfhydryl modification of α1β2γ2R197C receptors in the presence and absence of FZM, ZPM, DMCM, GABA, and PB. A, B, Representative GABA (1 μm) and GABA plus FZM (1 μm each) current traces recorded from α1β2γ2R197C receptors. Arrows indicate 10 s application of 5 mm MTSET alone (A) or 5 mm MTSET plus 5 μm FZM (B). FZM potentiation (denoted by I bars) was measured before and after each MTS treatment. Similar recordings were made after application of MTSET in the presence of 1 μm ZPM, 1 μm DMCM, 100 μm GABA, 50 μm PB (low PB), and 500 μm PB (high PB) (data not shown). C, Observed increases in FZM potentiation of IGABA were plotted versus cumulative MTSET exposure in the absence (control) and presence of DMCM, ZPM, and FZM. Data obtained from individual experiments were normalized to the potentiation measured at t = 0 and fit to single-exponential association curves. Data points are mean ± SD from at least three independent experiments. Plots of the changes in FZM potentiation after MTSET exposure in the presence of GABA and PB resemble control and are not shown for clarity (D). Second-order rate constants (k2) for MTSET modification of α1β2γ2R197C receptors in the absence (control) and presence of various BZD ligands, GABA, and PB were calculated as described in Materials and Methods. Values significantly different from the control rate are indicated (**p < 0.01).
Figure 7.

The localization of γ2Loop F residues at the binding-channel interface. Homology model of the α1 (red) and γ2 (blue) subunits of the GABAAR with γ2 residues Arg197 and Trp183 shown space filled in orange and pink, respectively. Loop F is highlighted in green, and β-strand 9 is yellow. The general location of the BZD binding site (α/γ interface) and the GABA binding site (α/β interface) is indicated (β subunit not shown). Loops 2, 7, and M2-M3 and the pre-M1 region are labeled on only one subunit for clarity.
The modification rate of α1β2γ2R197C receptors was measured by examining the increase in FZM potentiation of IGABA after repeated exposure to subsaturating doses of MTSET (5 mm; 10 s). The increase in FZM potentiation of the receptor was plotted against the cumulative time of MTSET exposure, and the data were fit with a single-exponential association curve (Fig. 6C). Second-order rate constants (k2) for the MTS reaction were then calculated (control rate, 12.5 ± 2.1 m−1s−1) (see Materials and Methods) (Fig. 6D). The positive modulators, FZM and ZPM, both significantly slowed the rate of MTSET reaction with γ2R197C (Fig. 6). In contrast, the reaction rate was unaffected in the presence of the negative modulator, DMCM (Fig. 6C,D), suggesting this ligand does not cause movements near this residue or that movements caused by DMCM are undetectable by this method.
To determine whether the structural movements we observed with FZM and ZPM are specifically associated with binding of positive BZD modulators, we examined the rate of γ2R197C modification in the presence of GABA and PB. GABA binding induces global structural changes in the GABAAR that lead to channel opening and desensitization. At high concentrations (∼500 μm), PB also directly activates the GABAAR, whereas at relatively low concentrations (∼50 μm), PB potentiates IGABA without opening the channel. Therefore, PB is a useful tool for monitoring conformational movements in the GABAAR that occur during allosteric modulation of IGABA via a BZD-independent pathway and channel gating via a GABA-independent pathway. Neither GABA (100 μm) nor PB (at 500 or 50 μm) changed the rate of γ2R197C modification by MTSET (Fig. 6D), suggesting that the observed reduction in rate with FZM and ZPM is specific for positive BZD modulators. Collectively, these results demonstrate that positive BZD modulators induce distinct structural rearrangements in the Loop F region near γ2R197C, whereas DMCM, GABA, and PB binding either do not trigger specific movements in this region or the movements are undetectable.
Discussion
Although a structural picture of the Cys-loop superfamily of LGICs is rapidly emerging, the mechanisms by which allosteric drug modulators exert their distinct actions on these receptors remain unclear. Here, we demonstrate that the Loop F region of the GABAAR γ2 subunit plays an important role in controlling BZD efficacy, we identify residues that specifically regulate positive and negative BZD modulation of IGABA, and we demonstrate that positive BZD modulators induce movements in γ2Loop F near the transmembrane channel domain that are not triggered by the binding of a BZD-negative modulator, GABA, or pentobarbital.
γ2Loop F is a structural element involved in encoding BZD efficacy
Of the 16 cysteine substitutions we studied, eight significantly altered the maximal potentiation of IGABA by positive BZD modulators. Mutations that affected positive modulation span the entire length of Loop F, with γ2W183C at the beginning of this region, and γ2S195C and γ2R197C at the end, each reducing FZM and ZPM potentiation (Fig. 2). Recently, mutation of residues at the end of Loop F have also been reported to decrease diazepam potentiation (Padgett and Lummis, 2008). These results suggest a common group of residues is required for positive BZD modulation. Interestingly, cysteine substitutions in the middle of Loop F (γ2E189C, γ2V190C, γ2G191C, and γ2D192C) only altered the maximum response to FZM without affecting maximum ZPM potentiation or DMCM inhibition (Fig. 2, Table 1), suggesting this segment of Loop F may be specifically involved in mediating FZM efficacy.
Changes in maximal BZD potentiation of IGABA can arise via several mechanisms, including alterations in BZD binding, changes in the coupling machinery (transduction of BZD binding to potentiation), and/or shifts in GABA EC50 values. The differences measured in potentiation observed here are not caused by changes in the GABA dose–response, because the mutations that altered BZD modulation had no, or very small, effects on GABA EC50 values (Table 1). For example, the γ2G191C mutation shifted the GABA EC50 value to the left approximately twofold, which predicts that a reduction in potentiation might be observed because of a small increase in the effective GABA concentration that is being used to measure BZD modulation. However, for this mutation, FZM potentiation increased, indicating that a shift in the GABA EC50 value was not responsible for the observed changes in potentiation. Moreover, using radioligand binding assays, we found that the binding affinities of Ro15-1788, FZM, ZPM, and DMCM for mutant receptors containing γ2W183C, γ2E189C, and γ2R197C were similar to WT receptors (Fig. 4, Table 2), demonstrating that the BZD binding site was intact. Last, for some of the mutations, FZM and ZPM EC50 values changed but by less than approximately threefold (Table 1), which cannot explain the decreases in FZM potentiation measured. Together, these observations indicate that the mutations in γ2Loop F are affecting coupling of BZD binding to modulation of IGABA and that Loop F is part of a transduction pathway for positive BZD modulators.
In contrast to FZM and ZPM, only one cysteine substitution, γ2W183C at the beginning of Loop F, affected the inhibition of IGABA by DMCM (Fig. 3). This indicates that the structural determinants for positive and negative BZD allosteric modulation are different and suggests that negative modulation of IGABA by β-carboline binding to the BZD binding site does not get propagated through Loop F to the transmembrane domain, consistent with our observation that DMCM did not trigger movements at the end of Loop F near γ2R197C (Fig. 6). The fact that γ2W183C significantly decreased FZM, ZPM, and DMCM modulation of IGABA but did not affect the GABA EC50 value (Table 1) or BZD binding affinity (Fig. 4, Table 2) suggests that Trp183 is a critical residue involved in coupling BZD binding to modulation of IGABA. In GABAAR models, Trp183 points away from the BZD binding site toward β-strand 9 (Fig. 7). Given the bulky and hydrophobic nature of the native tryptophan residue, it is likely important for maintaining the structural integrity of the region, possibly serving as a “spacer” between Loop F and β-strand 9 (Fig. 7). We speculate that ligand occupation of the BZD binding site normally initiates a movement of Loop F near γ2W183 that shifts the relative distance between Loop F and nearby β-strands 9 and 10, and that substitution with the much smaller cysteine side chain disrupts this movement. Additional studies will be necessary to test this hypothesis.
Nine of the 16 cysteines introduced in Loop F are accessible to MTS modification and are located near the middle and end of the Loop F region (Fig. 5). The pattern of accessibility is consistent with this region adopting a loop or random coil conformation (Fig. 7). In many cases, MTS modification of the accessible cysteines significantly altered IGABA (Fig. 5D). Because MTS modification did not affect the maximum GABA response, the MTS-mediated changes in IGABA likely reflect small shifts in the GABA concentration–response. We speculate that the addition of MTSEA-Biotin and MTSET at these substituted cysteines initiates structural changes that mimics a BZD bound state, and that these reagents, in some cases, serve as tethered modulators. Regardless of the mechanisms underlying this effect, these data demonstrate that structural perturbations of residues in Loop F can alter GABAAR function in a manner similar to BZDs, consistent with the γ2Loop F region being a structural element involved in mediating BZD actions.
Structural mechanism underlying BZD-positive modulation
If the γ2Loop F region plays a pivotal role in propagating BZD binding site movements to modulation of IGABA, one might expect this region to undergo structural rearrangements in response to BZD binding. Loop F is one of several flexible loops (including loop 2, loop 7, pre-M1, and the M2-M3 loop) that reside at the binding channel interface (Fig. 7). The observed reduction in MTS reaction rate of γ2R197C in the presence of FZM and ZPM demonstrates that positive BZD modulators induce movements in γ2Loop F near the channel domain (Fig. 6). Because changes in MTS reaction rates were not observed in the presence of a negative BZD modulator, GABA, or pentobarbital, we conclude that these movements are unique to positive BZD modulators. Therefore, we speculate that the Loop F region is a specific transducer of positive BZD modulator binding, which allows positive BZD modulator-induced structural changes at the BZD binding site to propagate through the protein to the channel domain. The changes in Loop F are likely propagated by mechanical perturbations to residues located nearby in the tertiary structure. γ2R197, which sits close to the transmembrane domain, likely maintains the structural integrity of Loop F and/or the spatial relationship between Loop F with the adjacent β-strand 9 or other loops (e.g., pre-M1, loops 2, 7) (Fig. 7) via electrostatic interactions. The importance of having a positively charged moiety at position 197 is underscored by the fact that reaction of γ2R197C with MTSET, which mimics the native arginine in size and charge (Fig. 5A), restores FZM and ZPM potentiation to WT levels (Fig. 6A) (data not shown), whereas the bulky neutral compound, MTSEA-Biotin (Fig. 5A), only partially restores FZM potentiation (Fig. 5C,E). The structural relationship of Loop F with adjacent loops and β-strands is likely the key in the transduction of BZD agonist binding events to the channel domain via interactions with β-strand 9 and the pre-M1 region and/or to the GABA binding site via loops 2/7 in the adjacent α1 subunit (which contains a GABA binding site on its opposite face) (Fig. 7). Our data also indicate that BZDs do not simply trigger a subset of the same movements that are associated with GABA binding/activation of the channel and argue against the idea that BZDs can be thought of as “weak partial agonists” of the receptor, which trigger similar movements in the protein as GABA. In addition, the data demonstrate that the structural mechanisms underlying BZD versus pentobarbital positive modulation are different.
In summary, the mechanisms by which ligand-induced structural changes propagate through a protein remain elusive. The data in this study provide substantial new insights into defining the structural determinants required for BZD allosteric modulation of the GABAAR. Our data support a mechanical view of BZD signal transmission in which coupling between the BZD binding site and the transmembrane domain is initially brought about by movement in the γ2Loop F region. We found that modulation of IGABA by different BZDs requires specific residues in Loop F. Importantly, we demonstrate that the end of γ2Loop F near the transmembrane channel domain participates in conformational changes triggered specifically by positive BZD modulators, confirming that the allosteric pathways for positive and negative modulation of IGABA are different. It has become increasingly apparent that treatments for a variety of CNS diseases are focusing on the development of channel modulators. Our results, which identify structural elements that encode BZD efficacy versus affinity, shed new light onto the mechanisms underlying how allosteric communication in ligand-gated ion channels is mediated and will help define rules for the rational design of new BZD agonists.
Footnotes
This work was supported by National Institutes of Health Grants F32 MH082504 (S.M.H.), NS34727, and MH66406 (C.C.). We thank Dr. Andrew Boileau and Srinivasan Venkatachalan for careful reading of this manuscript and helpful discussions.
References
- Boileau AJ, Kucken AM, Evers AR, Czajkowski C. Molecular dissection of benzodiazepine binding and allosteric coupling using chimeric gamma-aminobutyric acidA receptor subunits. Mol Pharmacol. 1998;53:295–303. doi: 10.1124/mol.53.2.295. [DOI] [PubMed] [Google Scholar]
- Boileau AJ, Evers AR, Davis AF, Czajkowski C. Mapping the agonist binding site of the GABAA receptor: evidence for a β-strand. J Neurosci. 1999;19:4847–4854. doi: 10.1523/JNEUROSCI.19-12-04847.1999. [DOI] [PMC free article] [PubMed] [Google Scholar]
- Boileau AJ, Baur R, Sharkey LM, Sigel E, Czajkowski C. The relative amount of cRNA coding for gamma2 subunits affects stimulation by benzodiazepines in GABA(A) receptors expressed in Xenopus oocytes. Neuropharmacology. 2002;43:695–700. doi: 10.1016/s0028-3908(02)00036-9. [DOI] [PubMed] [Google Scholar]
- Draguhn A, Verdorn TA, Ewert M, Seeburg PH, Sakmann B. Functional and molecular distinction between recombinant rat GABAA receptor subtypes by Zn2+ Neuron. 1990;5:781–788. doi: 10.1016/0896-6273(90)90337-f. [DOI] [PubMed] [Google Scholar]
- Gao F, Bren N, Burghardt TP, Hansen S, Henchman RH, Taylor P, McCammon JA, Sine SM. Agonist-mediated conformational changes in acetylcholine-binding protein revealed by simulation and intrinsic tryptophan fluorescence. J Biol Chem. 2005;280:8443–8451. doi: 10.1074/jbc.M412389200. [DOI] [PubMed] [Google Scholar]
- Gingrich KJ, Burkat PM. Zn2+ inhibition of recombinant GABAA receptors: an allosteric, state-dependent mechanism determined by the gamma-subunit. J Physiol (Lond) 1998;506:609–625. doi: 10.1111/j.1469-7793.1998.609bv.x. [DOI] [PMC free article] [PubMed] [Google Scholar]
- Graham FL, van der Eb AJ. Transformation of rat cells by DNA of human adenovirus 5. Virology. 1973;54:536–539. doi: 10.1016/0042-6822(73)90163-3. [DOI] [PubMed] [Google Scholar]
- Hibbs RE, Radic Z, Taylor P, Johnson DA. Influence of agonists and antagonists on the segmental motion of residues near the agonist binding pocket of the acetylcholine-binding protein. J Biol Chem. 2006;281:39708–39718. doi: 10.1074/jbc.M604752200. [DOI] [PubMed] [Google Scholar]
- Karlin A, Akabas MH. Substituted-cysteine accessibility method. Methods Enzymol. 1998;293:123–145. doi: 10.1016/s0076-6879(98)93011-7. [DOI] [PubMed] [Google Scholar]
- Kloda JH, Czajkowski C. Agonist-, antagonist-, and benzodiazepine-induced structural changes in the alpha1 Met113-Leu132 region of the GABAA receptor. Mol Pharmacol. 2007;71:483–493. doi: 10.1124/mol.106.028662. [DOI] [PubMed] [Google Scholar]
- Leite JF, Blanton MP, Shahgholi M, Dougherty DA, Lester HA. Conformation-dependent hydrophobic photolabeling of the nicotinic receptor: electrophysiology-coordinated photochemistry and mass spectrometry. Proc Natl Acad Sci USA. 2003;100:13054–13059. doi: 10.1073/pnas.2133028100. [DOI] [PMC free article] [PubMed] [Google Scholar]
- Lyford LK, Sproul AD, Eddins D, McLaughlin JT, Rosenberg RL. Agonist-induced conformational changes in the extracellular domain of alpha 7 nicotinic acetylcholine receptors. Mol Pharmacol. 2003;64:650–658. doi: 10.1124/mol.64.3.650. [DOI] [PubMed] [Google Scholar]
- Mercado J, Czajkowski C. Charged residues in the α1 and β2 pre-M1 regions involved in GABAA receptor activation. J Neurosci. 2006;26:2031–2040. doi: 10.1523/JNEUROSCI.4555-05.2006. [DOI] [PMC free article] [PubMed] [Google Scholar]
- Mohler H, Fritschy JM, Rudolph U. A new benzodiazepine pharmacology. J Pharmacol Exp Ther. 2002;300:2–8. doi: 10.1124/jpet.300.1.2. [DOI] [PubMed] [Google Scholar]
- Newell JG, Czajkowski C. The GABAA receptor alpha 1 subunit Pro174-Asp191 segment is involved in GABA binding and channel gating. J Biol Chem. 2003;278:13166–13172. doi: 10.1074/jbc.M211905200. [DOI] [PubMed] [Google Scholar]
- Padgett CL, Lummis SC. The F-loop of the GABAA receptor {gamma}2 subunit contributes to benzodiazepine modulation. J Biol Chem. 2008;283:2702–2708. doi: 10.1074/jbc.M705699200. [DOI] [PubMed] [Google Scholar]
- Pascual JM, Karlin A. State-dependent accessibility and electrostatic potential in the channel of the acetylcholine receptor. Inferences from rates of reaction of thiosulfonates with substituted cysteines in the M2 segment of the alpha subunit. J Gen Physiol. 1998;111:717–739. doi: 10.1085/jgp.111.6.717. [DOI] [PMC free article] [PubMed] [Google Scholar]
- Sancar F, Ericksen SS, Kucken AM, Teissere JA, Czajkowski C. Structural determinants for high-affinity zolpidem binding to GABA-A receptors. Mol Pharmacol. 2007;71:38–46. doi: 10.1124/mol.106.029595. [DOI] [PubMed] [Google Scholar]
- Sigel E. Mapping of the benzodiazepine recognition site on GABA(A) receptors. Curr Top Med Chem. 2002;2:833–839. doi: 10.2174/1568026023393444. [DOI] [PubMed] [Google Scholar]
- Teissere JA, Czajkowski C. A β-strand in the γ2 subunit lines the benzodiazepine binding site of the GABAA receptor: structural rearrangements detected during channel gating. J Neurosci. 2001;21:4977–4986. doi: 10.1523/JNEUROSCI.21-14-04977.2001. [DOI] [PMC free article] [PubMed] [Google Scholar]
- Thompson AJ, Padgett CL, Lummis SC. Mutagenesis and molecular modeling reveal the importance of the 5-HT3 receptor F-loop. J Biol Chem. 2006;281:16576–16582. doi: 10.1074/jbc.M601265200. [DOI] [PubMed] [Google Scholar]
- Venkatachalan SP, Bushman JD, Mercado JL, Sancar F, Christopherson KR, Boileau AJ. Optimized expression vector for ion channel studies in Xenopus oocytes and mammalian cells using alfalfa mosaic virus. Pflügers Arch. 2007;454:155–163. doi: 10.1007/s00424-006-0183-1. [DOI] [PMC free article] [PubMed] [Google Scholar]
- Wagner DA, Czajkowski C. Structure and dynamics of the GABA binding pocket: a narrowing cleft that constricts during activation. J Neurosci. 2001;21:67–74. doi: 10.1523/JNEUROSCI.21-01-00067.2001. [DOI] [PMC free article] [PubMed] [Google Scholar]
- Williams DB, Akabas MH. gamma-Aminobutyric acid increases the water accessibility of M3 membrane-spanning segment residues in gamma-aminobutyric acid type A receptors. Biophys J. 1999;77:2563–2574. doi: 10.1016/s0006-3495(99)77091-8. [DOI] [PMC free article] [PubMed] [Google Scholar]
- Williams DB, Akabas MH. Benzodiazepines induce a conformational change in the region of the gamma-aminobutyric acid type A receptor alpha(1)-subunit M3 membrane-spanning segment. Mol Pharmacol. 2000;58:1129–1136. doi: 10.1124/mol.58.5.1129. [DOI] [PubMed] [Google Scholar]
- Xu M, Akabas MH. Identification of channel-lining residues in the M2 membrane-spanning segment of the GABA(A) receptor alpha1 subunit. J Gen Physiol. 1996;107:195–205. doi: 10.1085/jgp.107.2.195. [DOI] [PMC free article] [PubMed] [Google Scholar]