Figure 6.

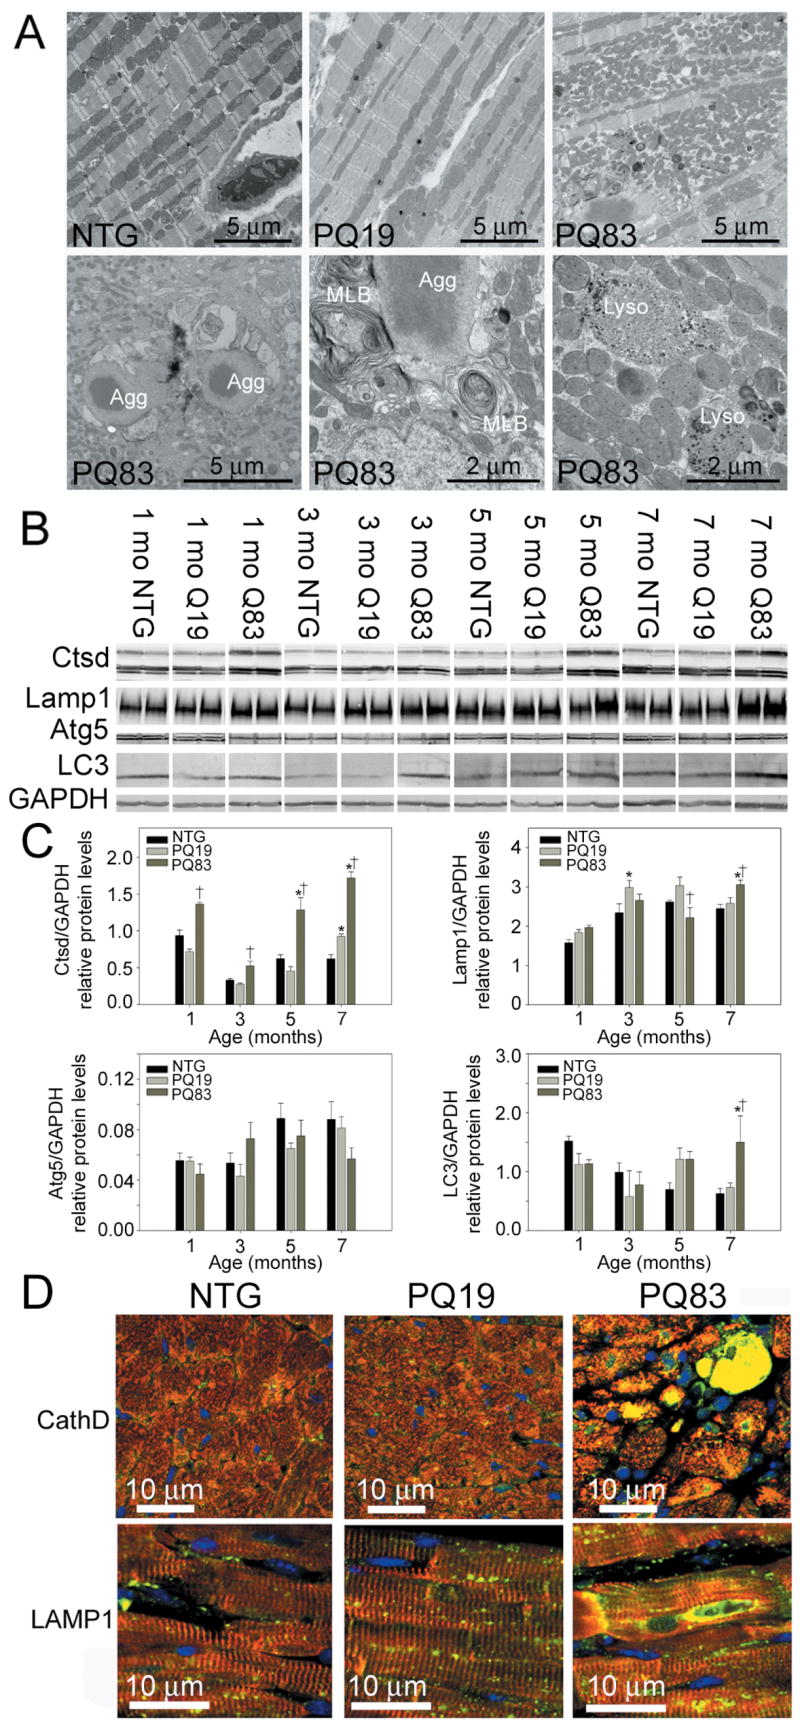
Autophagy and lysosomal activation. A, Upper panels depict cardiomyocyte ultrastructure derived from 7 month old hearts (10,000X). Lower panels show higher magnification of autophagic consumption of aggregates (lower left, 10,000X), increased number of multilamellar bodies (MLBs) (lower middle, 30,000X), and lysosomes (lower right, 30,000X). B, Immunoblots against lysosomal and autophagic markers cathepsin D (Ctsd), LAMP1 and LC3 were increased significantly, while Atg5 was not elevated in PQ83 cardiomyocytes (n = 4/genotype). C, Bar graphs of lysosomal and autophagy protein densitometry normalized to GAPDH levels. *, significant difference vs NTG (P<0.05), †, significant difference vs PQ19 (P<0.05) within an age group by two-way ANOVAs. D, Immunohistochemistry using antibodies against cathepsin D and LAMP1 (green). Desmin (red) was used to identify cardiomyocytes and TOPRO (blue) used to identify nuclei (60X).
