

Abstract
Monocular eyelid closure in cats during a critical period in development produces both physiological plasticity, as indicated by a loss of responsiveness of primary visual cortical neurons to deprived eye stimulation, and morphological plasticity, as demonstrated by a decrease in the total length of individual geniculocortical arbors representing the deprived eye. Although the physiological plasticity appears maximal after 2 d of monocular deprivation (MD), the shrinkage of deprived-eye geniculocortical arbors is less than half-maximal at 4 d and is not maximal until 7 d of deprivation, at which time the deprived arbors are approximately half their previous size. To study this form of plasticity at the level of individual thalamocortical synapses rather than arbors, we developed a new double-label colocalization technique. First, geniculocortical afferent arbors serving either the deprived or nondeprived eye were labeled by injection of the anterograde tracer Phaseolus vulgaris leucoagglutinin into lamina A of the lateral geniculate nucleus. Then, using antibodies to synaptic vesicle proteins, we identified presynaptic terminals within the labeled arbors in layer IV of the primary visual cortex. Analysis of serial optical sections obtained using confocal microscopy allowed measurement of the numerical density of presynaptic sites and the relative amounts of synaptic vesicle protein in geniculocortical afferents after both 2 and 7 d of MD. We found that the density of synapses in geniculocortical axons was similar for deprived and nondeprived afferents, suggesting that this feature of the afferents is conserved even during periods in which synapse number is reduced by half in deprived-eye arbors. These results are not consistent with the hypothesis that a rapid loss of deprived-eye geniculocortical presynaptic sites is responsible for the prompt physiological effects of MD.
Keywords: monocular deprivation, ocular dominance plasticity, presynaptic terminal, synaptic vesicle protein, cortical plasticity, primary visual cortex, lateral geniculate nucleus
Cells in the visual cortex lose their response to an eye that was deprived of vision during a critical period in early life (Wiesel and Hubel, 1963b). This phenomenon, called ocular dominance plasticity, has been studied as a model for experience-dependent changes in the CNS for over 30 years, but fundamental questions concerning the mechanisms underlying the physiological and anatomical plasticity induced by monocular deprivation (MD) remain unanswered. Two days of MD during the critical period for plasticity in kittens causes a robust and saturating shift in visual responsiveness such that primary visual cortical neurons respond preferentially to the nondeprived eye and very poorly or not at all to the deprived eye (for review, see Hensch, 1996). Longer periods of MD are sufficient to cause morphological plasticity in the geniculocortical afferents that terminate in layer IV of the primary visual cortex. Reconstructions of individual geniculocortical arbors show that, after 7 d of MD, deprived-eye arbors retract approximately half of their branches so that the total length of deprived arbors within layer IV of the cortex is ∼50% of normal (Antonini and Stryker, 1993b, 1996).
One possible mechanism for the rapid loss of cortical responsiveness to the deprived eye caused by 2 d of MD is the loss of presynaptic neurotransmitter release sites from the geniculocortical axon branches that are destined to be eliminated. If presynaptic sites are specifically removed from some branches of deprived-eye arbors, their absence might provide a signal for the retraction of those branches. This hypothesis could be tested by measuring the numerical synaptic density (the number of presynaptic sites per unit area of geniculocortical axon) in deprived geniculocortical afferents after 2 or 7 d of MD.
The predicted result of this hypothesis is as follows: 2 d of MD should result in a decrease in numerical synaptic density in deprived-eye afferents. Specifically, if presynaptic sites are selectively removed from deprived-eye axon branches that are destined to be retracted, then the deprived-eye synaptic density should become ∼50% of its former value. With longer periods of MD, we know that many of the branches of the deprived-eye geniculocortical axons retract. If it is only those deprived-eye axon branches which are devoid of presynaptic sites that are withdrawn, then the synaptic density of the deprived-eye projection will return to normal. Because there is little morphological change in the geniculocortical arbors serving the nondeprived eye over this time course (Antonini and Stryker, 1996), the hypothesis predicts that after 7 d of MD, numerical synaptic density in deprived and nondeprived afferents should again become equal.
More generally, one may hypothesize that the temporal mismatch between the loss of visual responsiveness to deprived-eye stimulation and the morphological withdrawal of deprived-eye geniculocortical afferent arbors may be accounted for by a loss of half of their synapses after 2 d of MD (although not necessarily only from those branches that will eventually be retracted), resulting in a transient halving of the numerical density of their presynaptic sites, followed by a homeostatic restoration of synaptic density to its long-term stable value, once half the branches of deprived-eye arbors have fully retracted after 7 d of MD. To test this hypothesis, we developed a method for identifying presynaptic sites in deprived and nondeprived geniculocortical afferents after MD, for measuring their relative numerical density, and for measuring the relative amounts of synaptic vesicle protein (SVP) per unit area of axon. Our results clearly reject the hypothesis and reveal instead a remarkable conservation of synaptic density throughout a period of dramatic axonal rearrangement, resulting in a twofold difference between the total numbers of presynaptic sites in deprived and nondeprived axons.
Some of these data have been published previously in abstract form (Silver and Stryker, 1997).
MATERIALS AND METHODS
Labeling of geniculocortical afferents and monocular deprivation. A total of 10 kittens were used for this study. All of them were from the breeding colony at the University of California, San Francisco, and had normal pigmentation. All procedures were performed in accordance with the Society for Neuroscience's Policy on the Use of Animals in Neuroscience Research and were approved by the Committee on Animal Research, University of California, San Francisco.
On postnatal day 26–30 (P26–30), the anterograde neuronal tracerPhaseolus vulgaris leucoagglutinin (Pha-L) (Gerfen and Sawchenko, 1984) was injected into lamina A of the lateral geniculate nucleus (LGN) of both hemispheres. This procedure has been described in detail by Antonini and Stryker (1993a). Briefly, kittens were preoperatively administered subcutaneous injections of 0.01–0.02 mg/kg glycopyrolate to control respiratory secretions and 14 mg/kg of the antibiotic amoxicillin. Anesthesia was initially induced with an intramuscular injection of ketamine hydrochloride (20 mg/kg) and acepromazine (0.1 mg/kg) followed by isoflurane. Animals were then intubated, and anesthesia was continued by delivering a mixture of isoflurane and oxygen through the endotracheal tube. The depth of anesthesia of the animals was monitored by continuously measuring respiratory rate, heart rate, end tidal CO2, and response to a pinch of the paw, and the level of isoflurane was adjusted to keep the animal in a state of deep anesthesia (usually 1–3% isoflurane). An intravenous catheter was inserted into a saphenous or cephalic vein to deliver lactated Ringer's solution with 2.5% dextrose throughout the surgical procedure at a rate of 5–10 ml · kg−1 · hr−1. Dexamethasone (1–2 mg/kg) was administered intravenously to control cerebral edema. Pupils were dilated by ocular administration of ophthalmic atropine sulfate (2%), and the nictitating membranes were retracted with ocular application of phenylephrine hydrochloride (10%).
A bilateral craniotomy was performed above the lateral geniculate nuclei (corresponding approximately to Horsley-Clarke stereotaxic coordinates AP 1–AP 8 and ML 6–ML 10). The dura was retracted, and a tungsten microelectrode was inserted vertically into the cortex overlying the LGN. As the electrode was lowered into the brain, the eyes were monocularly stimulated with a flashlight, and electrophysiological visual responses were recorded. A penetration was considered to traverse the binocular portion of the LGN if monocular visual responses corresponding to the known response properties of the eye-specific LGN laminae were observed (Sanderson, 1971). Specifically, if a pattern of contralateral responses (corresponding to lamina A) followed by ipsilateral responses (lamina A1) and then contralateral responses (C laminae) was observed as the electrode was lowered through the LGN, the recording site was considered to be appropriate for Pha-L injection. The use of these criteria was essential, because the results of this study depend crucially on labeling a population of geniculocortical afferents that serve only the contralateral eye and represent only the binocular portion of the visual field.
After a recording site was identified, the tungsten electrode was removed, and a glass pipette (tip diameter 10–15 μm) filled by suction with a solution of 2.5% Pha-L (Vector, Burlingame, CA) in sodium PBS was lowered along the same trajectory. Visual responses were recorded through the tip of the pipette, and the pipette was advanced until contralateral visual responses were obtained. Pha-L was then iontophoretically injected into lamina A of the LGN using a 2000 V compliance current source device (Stoelting, Wood Dale, IL) that delivered 7 sec pulses of 8 μA positive current at 50% duty cycle for 4 min. Approximately three separate Pha-L injections were made in each LGN. After the scalp incision was sutured, kittens received topical application of lidocaine ointment to the wound margins as well as subcutaneous injections of the analgesic butorphenol (total dose = 0.2–0.4 mg/kg). Animals were administered oral amoxicillin (14 mg/kg) twice a day for several days after the surgery. Monocular lid suture was performed under isoflurane anesthesia for some animals on either P33 (7 d MD) or P38 (2 d MD).
Perfusion and tissue processing. After a 10–14 d period during which the Pha-L was transported to the geniculocortical afferents in layer IV of the cortex, kittens received an intraperitoneal injection of pentobarbital (100 mg/kg) to induce deep anesthesia on P40 and were perfused transcardially with 1 l of ice-cold 0.1 m sodium phosphate buffer, pH 7.4, followed by 1 l of ice-cold 4% paraformaldehyde in the same buffer. The brain was blocked in the coronal plane at AP + 10 mm, and the LGNs and primary visual cortices of both hemispheres were removed from the skull in a single block of tissue. After 1 hr of post-fixing at 4°C, each primary visual cortex was dissected from the block. The pia was removed from each tissue block using fine forceps, and the tissue was embedded in 5% agar in distilled water and sectioned on a Vibratome. The block containing the LGNs was cut into 80-μm-thick coronal sections, and the cortical blocks were sectioned at 70 μm in the coronal plane. Because the location of the injection sites and cortical labeling were unknown until after the immunohistochemistry was performed, the entire LGN and primary visual cortex of each hemisphere were completely sectioned during the 16–48 hr after perfusion. Sections were collected in 20 mm potassium phosphate with 150 mm sodium chloride [potassium PBS (KPBS), pH 7.4].
Immunohistochemistry. Standard diaminobenzidine (DAB) immunohistochemistry was performed to determine the location of Pha-L-labeled neurons within the LGN. Although every section of the LGN was processed with DAB, only every seventh section of the visual cortex was processed this way. This allowed the determination of the anterior and posterior boundaries of the Pha-L-labeled geniculocortical afferents in the visual cortex but still left most of the sections containing Pha-L antigen available for double-label immunofluorescence. For DAB immunohistochemistry, sections were incubated for 1 hr at room temperature in a blocking solution consisting of 20 mmKPBS, 2.5% bovine serum albumin (Sigma, St. Louis, MO), 0.5% Triton X-100, 3% normal rabbit serum (Vector), and 0.05% thimerosal (Sigma). They were then transferred to a primary antibody solution consisting of the blocking solution and a goat anti-Pha-L antibody (Vector; used at 1:1000 dilution) and incubated overnight at 4°C. After three 10 min washes with KPBS, standard procedures were followed using the Vector ABC peroxidase anti-goat IgG kit. KPBS was used in all solutions except the final three 10 min washes preceding the DAB reaction. Tris buffer (10 mm) with 150 mm sodium chloride was used for these washes and for the DAB reaction itself. The DAB reaction solution contained 0.5 mg/ml DAB, 6.95 mg/ml nickel ammonium sulfate, and 0.01% hydrogen peroxide. After the DAB reaction, sections were mounted from tap water onto gelatinized slides, cleared with xylenes, and coverslipped. An animal was only used for this study if both LGNs contained Pha-L-labeled neurons located in the A lamina of the LGN. In addition, labeled neurons had to be located in the region of the LGN in which the binocular portion of the visual field is represented. Label resulting from injection sites in the monocular segment of the LGN or in the medial intralaminar nucleus was excluded from further analysis. Pha-L that was anterogradely transported to axon terminals in primary visual cortex often labeled distinct ocular dominance columns in layer IV. After the anterior-posterior boundaries of the cortical label were determined, the remaining sections from this portion of primary visual cortex were used for double-label immunofluorescence.
Immunofluorescence. Agar embedding medium was removed from the sections to decrease the volume they occupied in the antibody solutions. The blocking solution was as described above except that 3% horse serum (Vector) was added. Sections were blocked for 1 hr at room temperature and then transferred to blocking solution containing goat IgG anti-Pha-L antibody (Vector; dilution of 1:500) and one of the following primary antibodies: mouse IgG monoclonal anti-synaptophysin (Boehringer Mannheim, Indianapolis, IN; dilution of 1:10), mouse IgG monoclonal anti-synaptotagmin antibody (Matthew et al. 1981) (provided by Dr. Louis Reichardt, University of California, San Francisco; dilution of 1:1000), mouse IgG monoclonal anti-SV2 antibody (Buckley and Kelly, 1985) (provided by Dr. Regis Kelly, University of California, San Francisco; dilution of 1:50), or mouse IgG monoclonal GAD65 (Chang and Gottlieb, 1988) (dilution of 1:5). The anti-GAD65 antibodies in a GAD-6 hybridoma supernatant were obtained from the Developmental Studies Hybridoma Bank maintained by the Department of Pharmacology and Molecular Sciences, Johns Hopkins University School of Medicine, Baltimore, MD, and the Department of Biological Sciences, University of Iowa, Iowa City, IA, under contract N01-HD-6-2915 from the National Institute of Child Health and Human Development.
Sections were incubated in primary antibodies for 48 hr at 4°C, washed three times for 10 min each in KPBS, and transferred to a secondary antibody solution containing biotinylated horse anti-mouse IgG (Jackson, West Grove, PA; dilution of 1:200) and Cy3-conjugated rabbit anti-goat IgG (Jackson; dilution of 1:100) in blocking solution. After overnight incubation at 4°C, sections were washed three times in KPBS for 10 min each and then transferred to a solution containing Cy5-conjugated streptavidin (Jackson; dilution of 1:100) in KPBS with 0.05% thimerosal and then incubated overnight at 4°C. After a final series of three washes in KPBS for 10 min each, sections were mounted on gelatinized microscope slides from tap water. A mounting medium consisting of 5% n-propyl gallate (Sigma) and 10% (v/v) 0.1 m sodium PBS in glycerol was used, and coverslips were sealed with clear nail polish.
Confocal microscopy and image processing. Image collection and processing were performed as described in . Images were collected as pairs of sequential optical sections separated by 1 μm in a stack. Presynaptic sites were considered to be colocalized if each pixel in the cluster of SVP label in the reference section was located entirely within the boundaries of the corresponding Pha-L-labeled axon branch in the reference section.
Quantification of colocalization. Colocalization indices were designed to allow for quantitative comparisons of either the number of colocalized presynaptic sites per unit area of labeled axon (numerical synaptic density) or the average intensity of these sites per unit area of labeled axon (SVP density). For numerical synaptic density, the index is simply the number of colocalized presynaptic sites in the field divided by the number of Pha-L-positive pixels in the portions of the geniculocortical axon branches localized to the reference section. For SVP density, the colocalization index is defined as:
where p = the total summed intensities of the SVP pixels within colocalized presynaptic sites in the field,a = the number of Pha-L positive pixels in the portions of the geniculocortical axon branches localized to the reference section, and u = the average intensity of the SVP label in the neuropil (the entire field except for cell somata and blood vessels). Essentially, this measure gives the average intensity of SVP label per unit area of labeled axon, corrected for many sources of variability that are unrelated to monocular deprivation (.
Because all of the Pha-L injection sites were located entirely within lamina A of the LGN, the Pha-L-labeled geniculocortical axons in a given field represent only the eye contralateral to the hemisphere containing the field. In each monocularly deprived animal, one hemisphere contained only deprived-eye Pha-L-labeled geniculocortical axons, whereas the other hemisphere contained only nondeprived-eye Pha-L-labeled axons. For animals that were not deprived, one hemisphere had labeled axons representing the contralateral left eye, and the other had labeled axons serving the contralateral right eye. Each field generated one value for the numerical synaptic density and one value for SVP density, and the fields were averaged to compare deprived versus nondeprived (or left vs right) synaptic densities or SVP densities for each animal. Additionally, all deprived and all nondeprived fields were averaged across animals to allow for statistical comparisons incorporating the entire data set.
Descriptive statistics. Individual fields vary widely in the number of Pha-L-labeled axon branches that they contain. Colocalization indices computed from fields that have dense axon labeling are more reliable measures of colocalization than fields that have sparse labeling. Therefore, when averaging fields to compute a group colocalization index, each field was weighted by the number of Pha-L-positive pixels localized to the reference section for that field, as was the SD (Silver and Stryker (Silver and Stryker, Hunter and Schmidt, 1990).
Weighted averages of deprived and nondeprived fields were compared using a contrast index, defined as:
This contrast index would have a value of 0 if the average colocalization indices for the deprived eye and the nondeprived eye were equal. If all geniculocortical presynaptic sites were located exclusively within nondeprived-eye geniculocortical axons, the contrast index would be equal to −1. Similarly, the contrast index would have a value of +1 if the cortex contained only deprived-eye geniculocortical presynaptic sites. Because the numerator of the contrast index contains a difference between the deprived-eye average and nondeprived-eye average and each average has its own weighted SEM, the SE of the contrast index is the SE of the difference (Hays, 1963) normalized by the denominator of the contrast index, or:
To compare changes in synaptic density and SVP density after 2 d of MD to the physiological plasticity that takes place after this period of deprivation, we used existing data obtained from normal kittens of ages P37–P45 from Stryker (1989) and data from kittens that had received MD for 2 d (deprivations beginning at P37–P40) from the thesis of Hensch (1996). Physiological measures of eye dominance were expressed for the 10–51 cells in each microelectrode penetration as the contralateral bias index (CBI) (Reiter et al. 1986). In normal animals, the average CBI for penetrations made in left hemispheres was compared with that for penetrations in right hemispheres using the contrast index and SE of the difference described above. The same analysis was performed for 2 d MD animals, except the comparison was made between penetrations in hemispheres contralateral to the deprived eye and penetrations in hemispheres ipsilateral to the deprived eye. All CBI averages were weighted by the number of neurons recorded in each penetration.
Because a prominent feature of ocular dominance plasticity after 7 d of MD is the retraction of deprived-eye geniculocortical axon branches (Antonini and Stryker, 1993b), we quantitatively compared synaptic density and SVP density results after 7 d of MD with the existing data on morphological changes in the geniculocortical projection. For 6–7 d MD animals (deprivations beginning P32–P36), data from Antonini and Stryker (1993b) were summarized as group averages of either the total length of individual geniculocortical deprived-eye arbors or the total length of nondeprived arbors. These averages were compared in the form of a contrast index (as described above), and the variability of the data was expressed as the SE of the difference (as described above). To determine the variability in the total lengths of individual geniculocortical arbors in normal P39–P40 animals, we used data from Antonini and Stryker (1998). Because all of the geniculocortical arbors that they reconstructed from normal animals of this age were in the right hemisphere, it was not possible to compare left hemisphere and right hemisphere arbors. Instead, the arbors were listed in the order in which they were reconstructed, and this list was separated into odd-numbered (arbitrarily designated “left”) and even-numbered (“right”) afferents. The left and right groups were compared using a contrast index and SE of the difference.
Analysis of synaptic density and SVP density data using each animal as its own control. Because every animal used in this study received bilateral Pha-L injections in lamina A of the lateral geniculate nuclei, it was possible to compare numerical synaptic density or SVP density values in the left hemisphere of a single animal with the corresponding values in the right hemisphere. For monocularly deprived animals, this is equivalent to comparing deprived-eye afferents with nondeprived-eye afferents, because lamina A neurons receive exclusively monocular retinal input from the contralateral eye. Synaptic density or SVP density for all the fields in a single hemisphere for a given SVP antibody were averaged, and the average was weighted by the number of Pha-L-positive pixels in each field. The hemisphere averages were compared using the contrast index described above to compute a single contrast index for each SVP antibody in each animal. These data were separated into normal, 2 and 7 d MD groups, and the group mean of the single animal contrast indices (combining all three SVP antibodies) was computed using a weighted average. This group average and the group SD were weighted by the total number of Pha-L-positive pixels in all the fields for each animal for each SVP antibody.
Calculation of absolute synapse spacing. To compare the data in this paper with previous estimates of synaptic density of the geniculocortical projection based on electron microscopic measurements, we estimated the absolute density of presynaptic sites in geniculocortical afferents of normal animals. The length of individual segments of Pha-L-labeled geniculocortical axons located within the reference section was estimated by determining the length of the major axis of an ellipse whose dimensions were chosen to best fit the shape of the traced axon segment. The parameters of the ellipse were computed using the Analyze Particles algorithm in NIH Image. The major axis lengths were summed for each field and divided by the number of colocalized presynaptic sites in that field to produce an estimate of synaptic spacing for a single field in units of micrometers of geniculocortical axon per colocalized presynaptic site. These values were then averaged across all fields to obtain a measure of absolute spacing of geniculocortical presynaptic sites. The average and the SD were weighted by the sum of the lengths of the major axes in each field. Sample size was 30 fields from a total of three normal animals.
Statistical analysis. To determine whether two means were significantly different from each other, two-tailed Student'st tests were used with a criterion probability ofp = 0.05. Corrections for multiple comparisons were made using the formula pcorr = 1 − (1 − p)n, wheren is the number of comparisons (Hays, 1963, p 376). Multiple comparisons were grouped by deprivation condition, resulting in eight comparisons for normal animals and seven each for 2 and 7 d MD animals. In addition, six comparisons were made for the analysis using each animal as its own control. In all statistical comparisons made in this study, the null hypothesis H0 was that there was no difference between the two means that were being compared. However, the finding that there is insufficient evidence to reject H0 is not equivalent to the assertion that the two means are identical. It is possible that H0was not rejected because the sample sizes were not sufficiently large or because the data were too variable. Statistical power analysis provides a quantitative method to estimate confidence in a negative result given the sample size and variance (Cohen, 1988). One way to represent the strength of a negative result is to choose a confidence level and determine the minimum detectable difference (Zar, 1984) between two populations that could have been discovered with a particular pair of samples from these populations. In the formulas for minimum detectable difference given in Zar (1984, pp 111, 135), the pooled sample variances were weighted by the number of Pha-L-positive pixels in each field. For analysis of two sample comparisons, computed minimum detectable differences were divided by the sum of the two sample means so that they could be quantitatively compared with the contrast index values.
RESULTS
Labeling of presynaptic sites in geniculocortical afferents
To determine the effects of monocular deprivation on the distribution of presynaptic sites in geniculocortical afferents, a technique for identifying individual presynaptic sites located within deprived and nondeprived afferents was required. To accomplish this, focal injections of the anterograde neuronal tracer Pha-L (Gerfen and Sawchenko, 1984) were made into lamina A of the LGN of P26–P30 kittens. The tracer was taken up by geniculate neurons and transported to their terminals in layer IV of primary visual cortex, where it labeled a population of both X- and Y-type geniculocortical afferents. Labeled geniculocortical arbors in cortical area 17 were visualized with an anti-Pha-L antibody and a Cy3-conjugated secondary antibody. Presynaptic sites were identified using one of a panel of antibodies raised against synaptic vesicle proteins: anti-synaptophysin (Wiedenmann and Franke, 1985), anti-synaptotagmin (Matthew et al. 1981), or anti-SV2 (Buckley and Kelly, 1985), followed by a biotinylated secondary antibody. Cy5-conjugated streptavidin was used to visualize the presynaptic sites. Stacks of thin optical sections of the immuno-fluorescently double-labeled tissue were collected using a confocal microscope.
Examples of synaptophysin, synaptotagmin, and SV2 label and an example of Pha-L-labeled axons are shown in Figure1. For all SVP antibodies, the pattern of labeling was consistent with that expected for presynaptic markers (Fig. 1A,D,E). Dense punctate label was observed in the layer IV cortical neuropil, and staining was absent from neuronal somata and blood vessels. Figure1C is a false color overlay of a synaptophysin image and a Pha-L image collected from the same field. Several yellow punctate areas of apparent colocalization that may represent presynaptic sites within Pha-L-labeled geniculocortical axons are apparent.
Fig. 1.
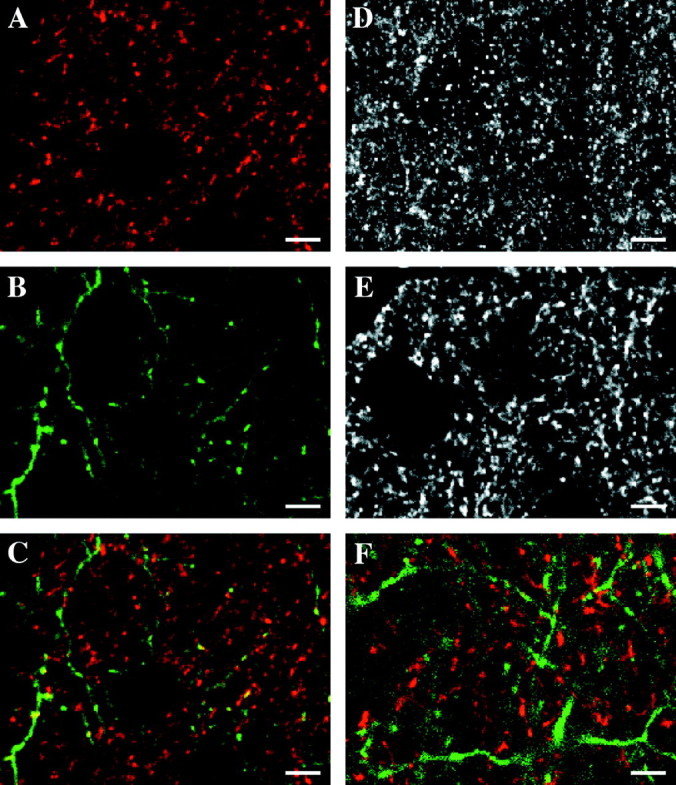
Synaptic vesicle protein antibodies can be used to label presynaptic sites within Pha-L-labeled geniculocortical afferents. Images are single confocal microscope optical sections of immunofluorescent label in layer IV of P40 kitten primary visual cortex. A, False-color image of synaptophysin immunofluorescence. The pattern of labeling is similar to that expected for a synaptic vesicle marker. There is a high density of labeled neuropil punctate structures that are likely to correspond to presynaptic terminals and an absence of label in cell bodies.B, False-color image of geniculocortical afferents labeled by an injection of the anterograde neuronal tracer Pha-L into lamina A of the lateral geniculate nucleus. Geniculate neurons located at the injection site took up the Pha-L and transported it to their axon terminals in layer IV of primary visual cortex. Thin axonal ramifications and varicosities can be visualized. C,False-color overlay of the images in A andB. Yellow represents regions of apparent colocalization of synaptophysin and Pha-L. Not all of the yellow puncta correspond to presynaptic sites within Pha-L-labeled geniculocortical afferents. This is because the large number of synaptophysin-labeled presynaptic sites within axons not labeled with Pha-L make the probability of false positive colocalization artifact very high if only single optical sections are considered. Special object-based techniques were used to decrease the contribution of false positive artifact to the colocalization measurements (see Materials and Methods).D, Synaptotagmin immunofluorescence. The overall pattern of labeling is similar to that observed for synaptophysin (A). E, SV2 immunofluorescence. Again, the label is consistent with that observed with other synaptic vesicle markers. F, False-color overlay of GAD65 (red) and Pha-L (green) immunofluorescence. GAD65 is an isoform of glutamic acid decarboxylase, which is preferentially localized to presynaptic terminals in GABAergic inhibitory neurons. Because the geniculocortical projection is entirely excitatory, it does not contain any GAD65 labeling. Because the overall pattern of GAD65 immunoreactivity is roughly similar to that of synaptophysin, synaptotagmin, and SV2, it can be used to estimate the amount of artifactual apparent colocalization. Because there is no actual overlap of the GAD65 and Pha-L patterns, any apparent overlap must be caused by false colocalization artifact. Scale bars, 5 μm.
The synaptic vesicle protein antibodies used in this study label most if not all of the synapses in layer IV of the cortex. However, only ∼6% of the synapses made onto layer IV spiny stellate neurons in cat visual cortex are of thalamic origin (Ahmed et al. 1994). Additionally, only a small percentage of the thalamocortical axons projecting to layer IV are labeled by the focal injections of Pha-L into the LGN. Therefore, the vast majority of labeled synapses in layer IV are not located within Pha-L-labeled geniculocortical axons and represent a potential source of false positive colocalization artifact. Even if the probability of a false positive colocalization for each single presynaptic site is very low, the fact that the pool of potential false positive synapses is so much greater than the pool of presynaptic sites that are actually contained within Pha-L-labeled geniculocortical axons means that false positive colocalization artifact is a significant danger.
To minimize the contribution of this artifact to the colocalization data, customized object-based techniques were used to accurately select only those labeled synapses actually located within Pha-L-labeled afferents. These techniques measure colocalization by determining the location of each Pha-L-labeled geniculocortical axon branch and each labeled presynaptic site in three-dimensional space. The method is fully described in and will only be briefly summarized here. All image processing procedures were performed blind with respect to whether the field contained deprived or nondeprived Pha-L-labeled axons. After tracing and excluding pixels within non-neuropil structures (cell bodies and blood vessels) from further analysis, the SVP images were thresholded such that the brightest 10% of the pixels were above threshold. The use of a relative threshold allowed for quantitative comparison of fields from different animals and corrected for several sources of interfield variability including quality of perfusion, antibody penetration, and gain and black settings on the confocal microscope. This relative threshold is only valid if MD has no effect on the relative levels of overall SVP label in ocular dominance columns in primary visual cortex. We have quantitatively tested this and have found that the amount of overall SVP label is not dependent on position within deprived or nondeprived ocular dominance columns in layer IV after 2 or 7 d of MD (Silver and Stryker (Silver and Stryker, 1998). Only those presynaptic sites that were completely located within the boundaries of a Pha-L-labeled axon branch were classified as colocalized. This 100% overlap criterion was found to produce the highest colocalization signal-to-noise ratio (.
Colocalization analysis of GAD65 validates object-based colocalization analysis
To assess the validity of our procedures, we used the apparent colocalization of GAD65 with geniculocortical axons as a biological control. GAD65 is an isoform of the GABA synthetic enzyme glutamic acid decarboxylase that is localized primarily to presynaptic terminals of GABAergic inhibitory neurons (Silver and Stryker, Kaufman et al. 1991; Esclapez et al. 1994). The overall pattern of GAD65 and SVP label in kitten layer IV is qualitatively similar (Fig. 1, compareA,D,E with F), and the spatial statistics of the two types of label are quantitatively alike (. Because the geniculocortical afferents form only asymmetric (and therefore excitatory) synapses in layer IV of cat primary visual cortex (Silver and Stryker, Garey and Powell, 1971; Freund et al. 1985), any apparent colocalization of GAD65-labeled inhibitory presynaptic terminals with Pha-L-labeled geniculocortical afferents is artifactual.
To compare the amount of colocalization measured for synaptophysin with Pha-L-labeled axons to that for GAD65 with Pha-L-labeled axons, we computed colocalization indices for a Pha-L field collected from one location with either a synaptophysin or GAD65 field from a different location (still within layer IV of primary visual cortex). This “shuffled” condition (by analogy to electrophysiological cross-correlation studies) provides a quantitative estimate of the amount of colocalization expected for two labels based on random overlap. If the colocalization index for two labels collected from the same field (the “experimental” condition) is significantly greater than the shuffled colocalization index, then the two labels are considered to be colocalized. If the experimental colocalization index is less than the shuffled index, the two labels are anticolocalized (that is, they label distinct sets of structures). These data can also be expressed in the form of a contrast index (the difference between the experimental and shuffled colocalization indices divided by the sum of these indices). This contrast index has a positive value for colocalized antigens and a negative value for anticolocalized antigens. Figure 2 indicates that synaptophysin is colocalized with Pha-L-labeled geniculocortical afferents, whereas GAD65 is anticolocalized with these afferents. The difference between the synaptophysin and GAD65 contrast indices was statistically significant (p < 0.01, two-tailed ttest; six experimental and six shuffled fields analyzed for each antigen). This result validates the object-based colocalization analysis by showing that it excludes the false colocalization of a molecule not contained within the geniculocortical afferents.
Fig. 2.
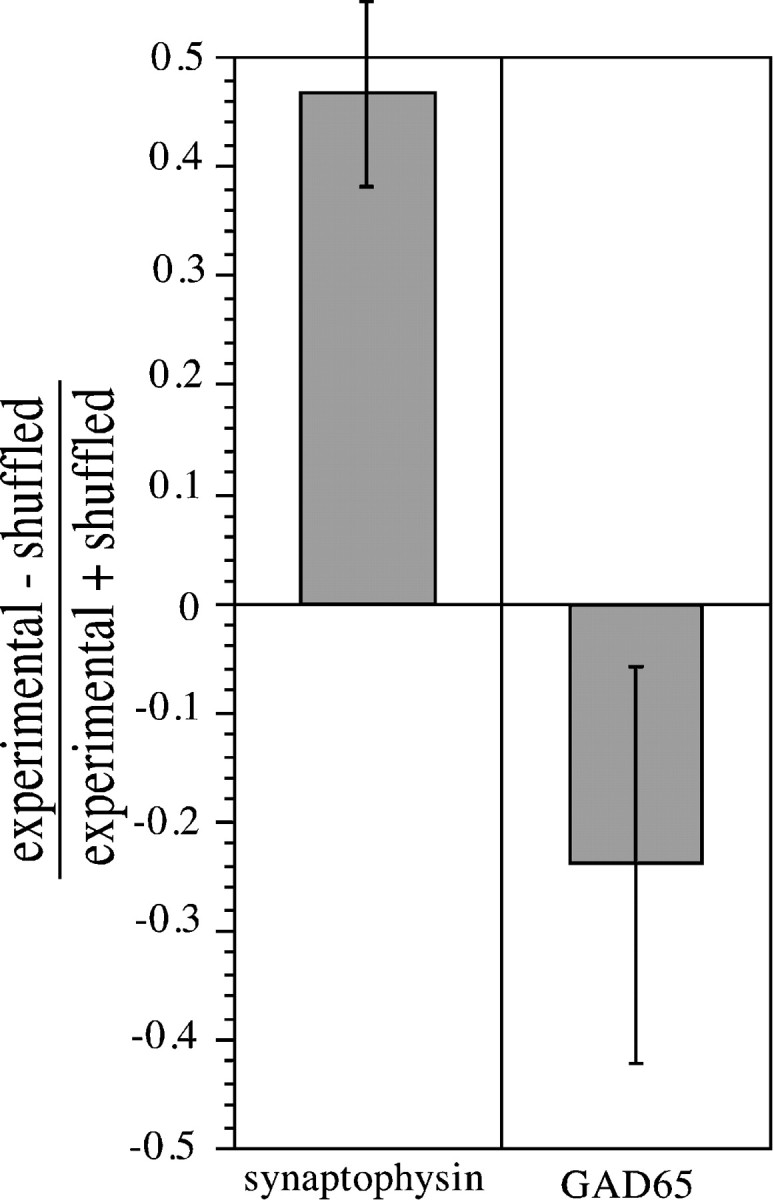
Quantitative comparison of the amount of colocalization of synaptophysin or GAD65 with Pha-L-labeled geniculocortical afferents in P40 kittens. The amount of apparent colocalization of synaptophysin with Pha-L expected based on random overlap of the two labels was computed by performing colocalization analysis on a synaptophysin field and a Pha-L field obtained from separate and nonoverlapping regions of layer IV (referred to as the shuffled condition). This was compared with the actual colocalization index, measured by carrying out an identical analysis on synaptophysin and Pha-L fields collected from the same location (the experimental condition). The colocalization index was defined as the sum of synaptophysin pixel intensities in presynaptic sites colocalized with Pha-L-labeled axons normalized by the amount of Pha-L label in the field (SVP density) (see Materials and Methods). Shuffled and experimental colocalization indices were also computed for GAD65 and Pha-L. Experimental and shuffled colocalization indices were compared in the form of a contrast index. As expected, synaptophysin was colocalized with Pha-L-labeled geniculocortical afferents, and GAD65 was anticolocalized with these afferents. The object-based colocalization procedure used in this study can easily discriminate between synaptophysin and GAD65 colocalization contrast indices (p < 0.01, two-tailed ttest). Error bars indicate SEM.
Synaptic density and SVP density in normal animals
Synaptic density and SVP density data were first collected from control animals with normal visual experience to determine the baseline variability in these measures. Every animal in the data set received Pha-L injections in lamina A of the LGN of both hemispheres. These injections labeled geniculocortical afferents in each cortical hemisphere that served only the eye contralateral to the injection site. Therefore, it was possible to estimate the variability of the data by comparing the colocalization indices in the left hemisphere with the colocalization indices in the right hemisphere. Each confocal microscope field generated a single value for the colocalization index. A contrast index (the difference between the average of the colocalization indices for the left hemisphere fields and the average for the right hemisphere fields divided by the sum of these averages) provided a standardized measure for comparing the two hemispheres. If the average colocalization indices for the two hemispheres were equal, the contrast index would have a value of 0.
Colocalization was quantified as either numerical synaptic density (the number of presynaptic sites normalized by the amount of Pha-L label in the field) or SVP density (the summed intensities of the colocalized SVP pixels normalized by the amount of Pha-L label in the field) (see Materials and Methods). Figure 3 shows the contrast indices for synaptic density and SVP density for three different synaptic vesicle proteins: synaptophysin, synaptotagmin, and SV2. In all six cases, the average left hemisphere colocalization indices were not significantly different from the average right hemisphere values (p > 0.1, two-tailedt test; sample sizes: synaptophysin, 30 fields from three animals; synaptotagmin, 20 fields from two animals; SV2, 20 fields from two animals).
Fig. 3.

Relative numerical synaptic density and SVP density in geniculocortical afferents in P40 kittens with normal vision. To estimate the variability in the colocalization measurements used in this study, a comparison of left hemisphere and right hemisphere values was performed in normal control animals. Colocalization indices were expressed as either numerical synaptic density (the number of colocalized presynaptic sites normalized by the amount of Pha-L label in the field) or SVP density (the sum of the intensities of the SVP pixels in colocalized presynaptic sites normalized by the amount of Pha-L label in the field). Quantitative comparisons of the average of left hemisphere colocalization indices and the average of the right hemisphere values were made in the form of a contrast index, defined as (left − right)/(left + right). None of the six conditions had a contrast index with a value significantly different from 0 (p > 0.1, two-tailedt test). To compare these results with more established techniques for studying cortical plasticity, we analyzed published data on ocular dominance distributions from single unit electrophysiological recordings in primary visual cortex of P37–P45 kittens at time of recording (Stryker, 1989). CBIs (see Materials and Methods) were computed for microelectrode penetrations made in either left or right hemispheres of normal animals. The same contrast index used for synaptic density and SVP density was used to compare CBIs obtained from left hemispheres with CBIs from right hemispheres. This CBI contrast index was not significantly different from 0 (p > 0.99, two-tailed ttest), indicating that there was no difference between the average CBI from the left hemispheres and the average CBI from the right hemispheres. Additionally, a contrast index for published data fromAntonini and Stryker (1998) on the total length of individual geniculocortical arbors in normal P39–P40 kittens was computed. Because all of the axons were reconstructed in the right hemisphere, they were arbitrarily designated left or right based on the order in which they were reconstructed. These two groups were compared using the contrast index described above. As expected, they did not significantly differ (p > 0.9, two-tailedt test). Error bars indicate SEs of the difference.
Comparison with previous methods for measuring ocular dominance plasticity
Because these synaptic density and SVP density measurements have not been used before to study ocular dominance plasticity, it was important to compare the values and variability obtained using these techniques with other methods for quantifying ocular dominance plasticity that are more established. The CBI (Reiter et al. 1986) is a physiological measure that summarizes the relative responses to the two eyes of a collection of neurons. CBIs were computed for single microelectrode penetrations made in the left and right hemispheres of animals with normal visual experience [ages P37–P45 at the beginning of recording; data from Stryker (1989)], and the average CBI values for the two hemispheres were compared using the contrast index described above (Fig. 3). As expected, the left and right hemispheres were not significantly different (p > 0.99, two-tailed t test; left hemispheres, four penetrations, 150 neurons; right hemispheres, two penetrations, 42 neurons).
Anatomical plasticity after MD has been assessed by measuring changes in the lengths of geniculocortical arbors (Antonini and Stryker, 1993b). Comparison of the lengths of seven normal arbors from Antonini and Stryker (1998), arbitrarily assigned to left or right groups based on the order in which they were reconstructed (see Materials and Methods), also revealed no significant differences between the groups (p > 0.9, two-tailed t test) (Fig.3). In normal animals, the values and range of variability of these established measures of the effects of deprivation are similar to those of our new measures of numerical synaptic density and SVP density.
Effects of 2 d of MD on synaptic density and SVP density in deprived and nondeprived geniculocortical afferents
A decrease in synaptic density or SVP density in deprived geniculocortical axons might account for the striking mismatch between anatomical and physiological effects of 2 d of MD. Two days of MD is sufficient to cause a robust and saturating physiological ocular dominance shift such that most primary visual cortical neurons lose their responses to stimulation of the deprived eye (for review, seeHensch, 1996), but little if any change in the size or complexity of deprived and nondeprived geniculocortical afferent arbors is thought to occur after such a short period of deprivation (Antonini and Stryker, 1996). Six to seven days of deprivation are required for the loss of approximately half of the branches of deprived-eye arbors (Antonini and Stryker, 1993b).
One hypothesis is that loss of some presynaptic sites in deprived-eye geniculocortical arbors and/or addition of presynaptic sites to nondeprived-eye arbors is responsible for the physiological ocular dominance shift observed after 2 d of MD. More specifically, one may propose that the loss of presynaptic sites from half of the branches of deprived-eye arbors is the signal that leads to the eventual loss of those branches. Because there is thought to be little retraction of deprived-eye geniculocortical arbors and no elaboration of nondeprived-eye arbors taking place during this time, measurement of relative synaptic density of the deprived versus nondeprived afferents provides a direct test of the general hypothesis. Relative synaptic densities and SVP densities were computed for deprived and nondeprived afferents and expressed as a contrast index, the value of which would be negative if deprived-eye density were reduced relative to nondeprived-eye density after 2 d of MD.
Figure 4 shows that 2 d of MD had no effect on the relative numerical synaptic density in deprived and nondeprived geniculocortical afferents (p > 0.2, two-tailed t test; synaptophysin, 30 fields from three animals; synaptotagmin, 20 fields from two animals; SV2, 20 fields from two animals). The results were identical for all three SVP markers used in this study. Therefore, addition or removal of presynaptic sites in the geniculocortical projection is not responsible for the physiological ocular dominance shift produced by 2 d of MD. Although synaptic density measurements reflect the number of presynaptic sites per Pha-L-positive pixel, SVP density is the total summed intensities of all colocalized SVP pixels normalized by the number of Pha-L-positive pixels. Therefore, SVP density is sensitive to potential changes in the size of presynaptic sites and to the amount of synaptic vesicle protein per site. SVP density in deprived afferents was equal to that in nondeprived afferents for all three SVP antibodies tested (p > 0.2, two-tailed t test), indicating that the amount of SVP label per presynaptic site is unaffected by 2 d of MD.
Fig. 4.

Relative numerical synaptic density and SVP density in deprived and nondeprived geniculocortical afferents after 2 d of MD. P38 kittens were monocularly deprived for 2 d, and averages of synaptic density and SVP density were separately determined for deprived and nondeprived geniculocortical axons. Deprived and nondeprived afferents were compared using a contrast index. For all six conditions, the contrast index was not significantly different from 0 (p > 0.2, two-tailed ttest). To calculate our confidence in these negative results, statistical power analysis was used to determine minimum detectable differences. These represent deviations of the contrast index from 0 for two populations that would have been detected for a particular pair of samples from these populations given the sample sizes, the sample variances, and a choice of confidence level. Horizontal bars indicate minimum detectable difference levels for a confidence level of 90%. Data on the effects of 2 d of MD (deprivation beginning P37–P40) on the ocular dominance of cortical neurons from the thesis of Hensch (1996) were plotted using a contrast index to allow comparison with the synaptic density and SVP density data. Because some of the animals in Hensch's thesis received left-eye MD and some received right-eye MD, the CBI contrast index was represented as a comparison of CBIs from the hemisphere contralateral to the deprived eye versus CBIs from the hemisphere ipsilateral to the deprived eye. CBIs from contralateral hemispheres were significantly lower than ipsilateral CBIs (p < 0.0001, two-tailed t test). Error bars indicate SEs of the difference.
These results fail to show a statistically significant difference between deprived and nondeprived afferents in synaptic density or SVP density after 2 d of MD. The lack of significance of a difference is not equivalent, however, to the positive assertion that synaptic density or SVP density are identical in deprived and nondeprived arbors. If the synaptic density or SVP density were actually different in deprived and nondeprived afferents, the present data set might not reveal this difference if the sample sizes were too small or the data were too variable. Statistical power analysis (Cohen, 1988) can be used to quantify the power of a negative result of a statistical comparison of two samples by estimating the minimum detectable difference (Zar, 1984) that could have been found if it existed in the populations, given the sample sizes, sample variances, and a choice of confidence levels (see Materials and Methods). Using a 90% confidence level (β = 0.10), we determined the minimum detectable differences in numerical synaptic density or SVP density between deprived and nondeprived afferents after 2 d of MD. These ranged from 0.18 (for synaptophysin synaptic density) to 0.23 (for SV2 SVP density) when expressed on the same scale as the contrast indices (Fig. 4). For example, given our sample, we can be 90% certain that the true contrast index for synaptophysin synaptic density does not differ by >0.18 from a value of 0.
To compare these data with physiological measurements of the effect of 2 d of MD, data from the thesis of Hensch (1996) were represented as a contrast index (Fig. 4). CBIs were computed for microelectrode penetrations from hemispheres both contralateral and ipsilateral to the deprived eye. The ocular dominance shift is indicated by the fact that CBI values from hemispheres contralateral to the deprived eye are much lower than CBI values from hemispheres ipsilateral to the deprived eye [p < 0.0001, two-tailed t test; sample sizes, 10 penetrations (167 neurons) contralateral to the deprived eye, 9 penetrations (172 neurons) ipsilateral to the deprived eye)]. A comparison of the size of the effect of 2 d of MD on CBI values with the minimum detectable difference values computed for synaptic density and SVP density suggests that if there were an actual change in synaptic density or SVP density after 2 d of MD that was even one-third of the magnitude of the physiological change, it would have been detectable with our data.
Despite the profound physiological effect of 2 d of MD, the density of presynaptic sites on deprived-eye afferents is not reduced relative to that in nondeprived-eye afferents. Because the deprived-eye afferents probably have not shrunk by this time, their reduced efficacy is not accounted for by a loss of the presynaptic component of synapses.
Models of possible presynaptic changes in geniculocortical afferents after 7 d of MD
After 7 d of MD, the total length of deprived-eye geniculocortical arbors is reduced by ∼50% (Antonini and Stryker, 1993b), and the loss of physiological response to deprived-eye stimulation is similar to that observed after 2 d of MD (for review, see Hensch, 1996). Such deprivation might cause numerical synaptic density or SVP density in the deprived geniculocortical afferents to increase, decrease, or stay the same. Models of these possibilities are shown schematically in Figure5.
Fig. 5.

Possible models of presynaptic site rearrangements in deprived-eye geniculocortical arbors after 7 d of MD. As shown in all three models, 7 d of MD causes a 50% reduction in the total length of individual deprived-eye geniculocortical arbors (Antonini and Stryker, 1993b). There are three possible types of changes in the distribution of presynaptic sites in deprived-eye geniculocortical axons after 7 d of MD. Presynaptic sites could be removed from deprived-eye afferents more rapidly than branches are retracted (the active synapse model), resulting in both a decrease in the number of presynaptic sites per axon and a decrease in numerical synaptic density. Alternatively, if deprived-eye presynaptic sites are eliminated to the same extent as deprived-eye axon branches are withdrawn (the passive synapse model), the shrunken deprived-eye geniculocortical arbor will contain fewer total synapses but will maintain normal synaptic density. Finally, if presynaptic sites are not eliminated but simply redistributed within the pruned deprived-eye arbor (the dynamic synapse model), the total number of presynaptic sites per arbor will be unchanged by MD, but the synaptic density in the remaining deprived-eye geniculocortical axon branches will be increased. Although only possible changes in deprived-eye arbors are depicted here, the measurement of relative synaptic densities in deprived and nondeprived geniculocortical axons after 7 d of MD effectively discriminates among these three models (see Results).
In the active synapse model, synapse elimination is even greater than retraction of deprived-eye axon branches. Therefore, 7 d of MD would cause a decrease in the total number of presynaptic sites per deprived arbor and would also decrease numerical synaptic density. The passive synapse model postulates that synapses and axon branches are removed at equal rates. In this model, 7 d of MD results in a decrease in the number of presynaptic sites per deprived-eye arbor. As deprived-eye axon branches are retracted, the presynaptic sites within these branches are eliminated. However, the distribution of presynaptic sites in the remaining axon branches is essentially unchanged. Therefore, in this model, the synaptic density of deprived-eye branches is unaffected by 7 d of MD. In thedynamic synapse model, presynaptic sites are redistributed within a shrunken arbor so that 7 d of MD does not result in any net synapse elimination. In this case, the number of presynaptic sites per deprived-eye arbor does not change, so the synaptic density increases.
By measuring the density of presynaptic sites within deprived-eye arbors after 7 d of MD, it is possible to discriminate among these three models. Although the colocalization analysis used in this study was not designed to measure absolute synaptic density, it can be used to compare the relative numerical synaptic densities in deprived and nondeprived geniculocortical afferents. If 7 d of MD does not alter the absolute synaptic density of nondeprived-eye afferents, a comparison of deprived-eye and nondeprived-eye synaptic densities is equivalent to measuring absolute synaptic density in the deprived-eye projection and represents a direct test of the models presented in Figure 5. Consistent with this possibility is the finding that 7 d of MD causes a 50% reduction in the total length of deprived-eye geniculocortical afferents but has little or no effect on nondeprived-eye axons (Antonini and Stryker, 1993b).
Similarly, if changes in the synaptic density of nondeprived-eye afferents are in the opposite direction of the changes that occur in deprived-eye afferents, then a relative comparison of deprived and nondeprived afferents would yield the same results as an absolute measure of deprived-eye synaptic density, but the size of the effect would be larger. The only scenario in which a relative comparison of deprived versus nondeprived synaptic density would yield qualitatively different results from a measurement of absolute deprived-eye synaptic density is if the synaptic densities of deprived and nondeprived afferents both changed in the same direction (i.e., both increased or both decreased). Because there is ample evidence that ocular dominance plasticity is a result of competition between the populations of afferents representing the two eyes (Guillery, 1972; Chapman et al. 1986; Antonini and Stryker, 1998; Hata et al. 1999) (for review, seeShatz, 1990), we view this possibility as very remote and do not consider it further.
Effects of 7 d of MD on synaptic density and SVP density in deprived and nondeprived geniculocortical afferents
Depriving kittens of pattern vision in one eye by monocular lid suture for 7 d (P33–P40) had no effect on the relative numerical synaptic density or SVP density in deprived and nondeprived geniculocortical afferents (Fig. 6) (p > 0.95, two-tailed t test; synaptophysin, 30 fields from three animals; synaptotagmin, 20 fields from two animals; SV2, 20 fields from two animals).
Fig. 6.

Relative numerical synaptic density and SVP density in deprived and nondeprived geniculocortical afferents after 7 d of MD. P33 kittens were monocularly deprived for 7 d, and averages of synaptic density and SVP density were computed independently from hemispheres containing either deprived or nondeprived Pha-L-labeled geniculocortical afferents. The same contrast index used in Figure 4 was used to quantitatively compare deprived and nondeprived axons. For all six conditions, the contrast index was not significantly different from 0 (p > 0.95, two-tailed t test). Horizontal barsindicate minimum detectable difference levels for a confidence level of 90%. The effect of 6–7 d of MD on relative total lengths of deprived and nondeprived individual geniculocortical arbors from Antonini and Stryker (1993b) was plotted for comparison purposes. As reported byAntonini and Stryker (1993b), 6–7 d of MD beginning at ages P32–P36 causes morphological rearrangements in the geniculocortical projection so that the total length of individual deprived-eye afferents was significantly smaller than the total length of individual nondeprived-eye afferents (p < 0.0001, two-tailed t test). Error bars indicate SEs of the difference.
Because 7 d of MD produced a negative result for all measures of relative synaptic density and SVP density, statistical power analysis was used to determine the strength of these negative results. The analysis was identical to that used for the 2 d MD results. Minimum detectable differences in the 7 d MD samples ranged from 0.19 to 0.35 when expressed on the same scale as the contrast indices. To compare these results with previously published data on the effects of 6–7 d of MD on the geniculocortical projection (MD beginning P32–P36), data from Antonini and Stryker (1993b) were displayed as a contrast index (Fig. 6). As shown by Antonini and Stryker (1993b), the difference between the average total length of the deprived-eye geniculocortical afferents and the average of the nondeprived-eye afferents after 7 d of MD was statistically significant (p < 0.0001, two-tailed t test; 13 deprived-eye axons and 7 nondeprived-eye axons). Because this difference in arbor lengths is greater than all of the minimum detectable differences for synaptic density and SVP density, we conclude that if there were changes in synaptic or SVP density similar in magnitude to the change in arbor length, our data would have revealed them.
These results are most consistent with the passive synapse model presented in Figure 5. That is, relative synaptic density in deprived versus nondeprived geniculocortical axons is unchanged by 7 d of MD. Because deprived-eye afferents are known to undergo significant retraction of axon branches after 7 d of MD (Antonini and Stryker, 1993b), these synaptic density data indicate that 7 d of MD induces a net decrease in the number of presynaptic sites per deprived-eye geniculocortical arbor. These data also suggest a tight coupling between retraction of axon branches and elimination of presynaptic sites in the deprived-eye geniculocortical projection during MD.
Analysis of the effects of MD using each individual animal as its own control
The data presented on the effects of MD on relative synaptic density and SVP density so far have involved the averaging of density measurements from fields containing labeled deprived-eye geniculocortical afferents from multiple animals and comparison of this average with the corresponding average from nondeprived-eye fields. Because every animal in our data set received Pha-L injections into lamina A of the LGN of both hemispheres, every monocularly deprived animal had Pha-L-labeled deprived-eye afferents in one hemisphere and labeled nondeprived-eye afferents in the other hemisphere. This allowed for the reanalysis of the data set using each animal as its own control. We reasoned that this analysis could decrease the variability of the data and increase the likelihood of detection of small changes in relative synaptic density or SVP density produced by MD.
Numerical synaptic density or SVP density measurements were averaged for each hemisphere, and these averages were used to compute a contrast index for each SVP marker in each animal. Because the data presented in Figures 3, 5, and 6 do not indicate any differences among synaptophysin, synaptotagmin, or SV2, the results from these three SVP markers were combined and used to calculate average synaptic density or SVP density contrast indices for normal animals, 2 d MD animals, and 7 d MD animals (Fig. 7). Data from fields containing synaptophysin, synaptotagmin, and SV2 were pooled in the group averages. In all cases, there were no statistically significant differences between deprived and nondeprived (or left vs right in the case of the normal control animals) synaptic density or SVP density measurements [p > 0.5, two-tailedt test; seven contrast index values for each condition (three synaptophysin, two synaptotagmin, and two SVP), with each contrast index value incorporating data from 10 fields]. The group averages for all the contrast indices within a condition were weighted by the total number of Pha-L-positive pixels in the fields from each animal.
Fig. 7.

Analysis of numerical synaptic density and SVP density data using each animal as its own control. Because every animal in this study received Pha-L injections in the LGN of both hemispheres, geniculocortical afferents representing the eye contralateral to the injection site were labeled in each hemisphere. This allowed intra-animal comparisons to be made of deprived and nondeprived geniculocortical axon synaptic density and SVP density. Some of the data presented in Figures 3, 4, and 6 were reanalyzed in this manner. Average synaptic density and SVP density values were computed separately for each SVP antibody in each hemisphere, and one contrast index was generated for each SVP antibody per experimental animal. This contrast index compared deprived and nondeprived afferents for animals that received MD and compared left and right hemisphere values for normal control animals. Open circles represent contrast indices for individual animals. In all cases, the group average of the contrast indices was not significantly different from 0 (p > 0.05, two-tailed ttest). Error bars indicate SEs of the mean, and horizontal bars indicate minimum detectable difference levels for a confidence level of 90%. The group averages and minimum detectable differences for animals receiving 2 or 7 d of MD were indistinguishable from normal control animals.
Statistical power analysis of these negative results produced minimum detectable differences ranging from 0.10 to 0.23 using a confidence level of 90% (Fig. 7). Of the six comparisons tested, the two largest minimum detectable differences were for the synaptic density and the SVP density from normal animals. This suggests that any differences between deprived and nondeprived afferents after either 2 or 7 d of MD are well within the range of normal variability. Given that identical results were obtained for three independent SVP markers, it is very likely that numerical synaptic density and SVP density are equal in deprived and nondeprived geniculocortical afferents after either 2 or 7 d of MD.
Exclusion of additional potential sources of variability: ocular dominance columns, laminar position, and axon orientation
Several other analyses were performed to attempt to account for the variability in the synaptic density and SVP density data. Because primary visual cortex is organized into ocular dominance columns (Hubel and Wiesel, 1962), the relative distribution of left- and right-eye geniculocortical afferents is not uniform across layer IV of primary visual cortex (Hubel and Wiesel, 1972; Shatz et al. 1977). If synaptic density or SVP density of geniculocortical afferents serving one eye varied as a function of position within an ocular dominance column, this could increase sample variability, because a single confocal microscope field only samples an area of ∼100 × 70 μm. For example, elimination of deprived-eye geniculocortical presynaptic sites could be greater or faster at the interface of deprived and nondeprived ocular dominance columns (where competition is likely to be substantial) than in the center of the deprived-eye ocular dominance columns (where the deprived eye is likely to maintain dominance despite deprivation effects elsewhere).
By photobleaching the confocal microscope field immediately after image collection, the position of the field could be accurately determined. Because the Pha-L injections in the LGN labeled a monocular population of geniculocortical afferents serving the eye contralateral to the injection site, ocular dominance columns were often observed in the pattern of Pha-L-labeled afferents in the cortex. An analysis of synaptic density and SVP density as a function of ocular dominance column position revealed no correlation between these measures (data not shown). Similarly, neither synaptic density nor SVP density was correlated with the depth of the field within the cortex (superficial vs deep layer IV) (data not shown).
Finally, because it was sometimes difficult to trace Pha-L-labeled axon segments that were oriented perpendicular to the plane of the optical section, we selected only those axon segments whose uninterrupted length within the reference section was at least 25 pixels, corresponding to a length of 3.3 μm. These long axon segments were within the plane of the reference section and very easy to identify and trace. Reanalysis of a portion of the data set consisting of only long axon segments produced the same results as analysis of the entire data set, although the variance was greater because of the smaller sample sizes (data not shown).
Distribution of geniculocortical presynaptic sites after MD of 2 or 7 d
Figure 8 summarizes the present findings on the distribution of presynaptic sites within geniculocortical afferents after MD. The top portion of the model indicates the known effects of MD on physiological visual responses of primary visual cortical neurons and on the morphology of geniculocortical afferents, whereas the bottom portion represents the distributions of presynaptic sites on deprived-eye geniculocortical afferents indicated by the findings of this study.
Fig. 8.

The distribution of geniculocortical presynaptic sites after 2 and 7 d of MD. The data presented in this study suggest the following model: 2 d of MD results in no change in relative numerical synaptic density or SVP density in deprived and nondeprived geniculocortical afferents, despite the fact that 2 d of MD is sufficient to cause a saturating physiological ocular dominance shift (for review, see Hensch, 1996). Seven days of MD result in coordinate retraction of deprived-eye geniculocortical axon branches (Antonini and Stryker, 1993b) and removal of deprived-eye geniculocortical presynaptic sites and/or addition of nondeprived-eye geniculocortical presynaptic sites. This produces a net change in relative synapse number in deprived and nondeprived geniculocortical arbors after 7 d of MD. However, relative synaptic density in these remodeled synapses is unaffected by 7 d of MD. Neither 2 nor 7 d of MD changes the size of presynaptic sites or the amount of SVP expressed per presynaptic site in geniculocortical afferents.
Two days of MD cause a saturating loss of visual cortical responses to deprived-eye visual stimulation (for review, see Hensch, 1996) without substantial morphological changes in geniculocortical arbors (Antonini and Stryker, 1996). This ocular dominance shift is not accompanied by loss of deprived-eye geniculocortical presynaptic sites or addition of nondeprived-eye presynaptic sites. Thus, loss of deprived-eye cortical responsiveness after 2 d of MD is not caused by a decrease in the number of presynaptic sites in deprived-eye geniculocortical afferents. Other mechanisms that may mediate physiological ocular dominance plasticity induced by 2 d of MD are considered in Discussion. Seven days of MD is sufficient to cause a 50% loss of deprived-eye geniculocortical axon branches (Antonini and Stryker, 1993b). There is a maintenance of synaptic density in the geniculocortical projection during this period of deprivation, resulting in a 50% decrease in the number of deprived-eye geniculocortical presynaptic sites relative to the number of nondeprived-eye sites after 7 d of MD. Finally, measurements of SVP density in deprived and nondeprived afferents indicate that MD has no effect on either the size of geniculocortical presynaptic sites or the amount of SVP antigen per presynaptic site after either 2 or 7 d of MD.
DISCUSSION
We have determined the effects of monocular deprivation on relative numerical synaptic density and SVP density in deprived and nondeprived geniculocortical axon arbors. Our results demonstrate that these measures are unchanged after 2 d of MD, although deprivation for this period of time has significant effects on the activity patterns of geniculocortical afferents and causes a physiological ocular dominance shift (for review, see Hensch, 1996). Seven days of MD causes a decrease in the total length of deprived-eye geniculocortical arbors (Antonini et al. 1993b) that is accompanied by a reduction in the number of presynaptic sites within these arbors relative to the number of nondeprived-eye sites, resulting in a conservation of synaptic density in deprived and nondeprived geniculocortical arbors.
Do clusters of synaptic vesicle protein label represent synapses?
Several lines of evidence indicate that clusters of SVP label like those we have measured are generally found at synapses (Calhoun et al., 1996). Electron microscopic analysis of punctate synaptophysin immunoreactivity in dissociated hippocampal cultures reveals axonal varicosities that contain synaptic vesicles and are presynaptic to dendrites (Fletcher et al. 1991). In rat primary cortical cultures, the amount of SVP label at a given presynaptic site is correlated with the amount of FM1–43 (Betz et al. 1992) taken up into synaptic vesicles that are recycled at that presynaptic site (Staple et al. 1997). InDrosophila, postsynaptic potentials can be evoked from myotubes (Broadie and Bate, 1993) precisely at the stage at which synaptotagmin-immunoreactive punctate structures appear in motor axon presynaptic terminals (Littleton et al. 1993). Electron microscopic studies of patterns of SVP immunoreactivity in developing mammalian cerebral cortex reveal that SVP expression is associated with presynaptic terminals or synapses en passant in ferret (Voigt et al. 1993) and in cat visual cortex (Chun and Shatz, 1988). The number of SVP clusters per unit length of geniculocortical arbor in our material (one per 7.5 ± 0.5 μm) (see Materials and Methods) matches the density of synaptic boutons measured in Y-type geniculocortical axons in area 18 of P30–P37 kittens, whereFriedlander and Martin (1989) found an interbouton interval of 6.60 μm along individual axon branches and showed that such boutons were located at synapses identified in the electron microscope.
Nonsynaptic SVP label, such as that in transport vesicles, is unlikely to contribute to the measurements of synaptic density or SVP density made in this paper. In time-lapse studies of living hippocampal cultures, large immobile clusters of synaptotagmin are located in apposition to postsynaptic elements, whereas smaller motile clusters are present in regions of the axon that do not have synaptic contacts (Kraszewski et al. 1995). The fluorescent intensity of the smaller clusters is 15–20 times less than that of the synaptic clusters, so that if they were present in our material, their signal would have been below the 10% intensity threshold used in our colocalization analysis.
Mechanisms of physiological ocular dominance plasticity after 2 d of MD
Two days of MD had no effect on either the relative numerical synaptic density or the relative SVP density in geniculocortical afferents. Thus, the loss of responsiveness of cortical neurons to the deprived eye after 2 d of MD is not caused by the loss of presynaptic terminals in deprived-eye geniculocortical axons. Previous studies have shown that the decrease in cortical deprived-eye visual responsiveness is attributable to changes within the cortex itself, because visual responses of LGN neurons remain largely normal even after months of MD (Wiesel and Hubel, 1963a) (for review, see Blakemore and Vital-Durand, 1981). Other possible explanations include (1) a decrease in the probability of neurotransmitter release from deprived-eye geniculocortical presynaptic terminals, (2) a decrease in the number of postsynaptic glutamate receptors at deprived-eye geniculocortical synapses, or (3) changes in intracortical circuitry. The developing neuromuscular junction provides precedent for the second possibility: postsynaptic acetylcholine receptors disappear from the muscle cell before the presynaptic nerve terminal is withdrawn from the synapse (Balice-Gordon and Lichtman, 1993; Colman et al. 1997). Although the third possibility is also attractive, measurements of total SVP label in deprived compared with nondeprived ocular dominance columns in layer IV of critical period kittens showed no change after 2 d of MD (Silver and Stryker, 1998). Because >90% of layer IV synapses are excitatory and of intracortical origin (Winfield, 1983;Ahmed et al. 1994), total SVP label should accurately reflect the density of intracortical excitatory presynaptic terminals. Similarly, 2 d of MD did not change the levels of inhibitory intracortical presynaptic terminals in deprived compared with nondeprived ocular dominance columns in layer IV as assessed by measuring GAD65 immunoreactivity (Silver and Stryker, 1999). Of course, changes in intracortical circuitry induced by MD could involve postsynaptic mechanisms or presynaptic functional changes that are not reflected in measurements of overall SVP label or GAD65 immunoreactivity.
Loss of presynaptic sites in deprived-eye geniculocortical axons after 7 d of MD
The findings of the present study in combination with earlier measurements of the size of deprived geniculocortical arbors (Antonini and Stryker, 1993b) demonstrate that 7 d of MD cause a twofold difference between deprived-eye and nondeprived-eye geniculocortical arbors in number of presynaptic sites. This loss of presynaptic sites is consistent with the reduction in physiological responses to deprived-eye stimulation but less than might be expected, given that 7 d of MD causes a loss of deprived-eye responsiveness in the visual cortex that is much greater than 50% (for review, see Hensch, 1996). However, even after much longer deprivations, the anatomical changes in geniculocortical input match the physiological reorganization of visual responses in layer IV (Shatz and Stryker, 1978). In addition, a number of manipulations, including enucleation of the nondeprived eye (Kratz et al. 1976; Spear et al. 1980) and iontophoresis of the GABAA receptor antagonist bicuculline in primary visual cortex (Burchfiel and Duffy, 1981), can acutely restore responses to the deprived eye even outside layer IV that are normally subthreshold. The persistence of deprived-eye geniculocortical presynaptic sites that we have demonstrated provides a likely substrate for these responses.
Reverse suture, in which the originally deprived eye is opened and allowed normal visual experience while the originally nondeprived eye is sutured closed, can permit long-term recovery of the originally deprived projection (Hubel and Wiesel, 1970; Blakemore and Van Sluyters, 1974). Specifically, reverse suture after 7 d of MD during the critical period allows the originally deprived eye to come to dominate cortical responses, and this recovery is accompanied by partial regrowth of originally deprived-eye geniculocortical arbors (Antonini et al. 1998). In a Hebbian model of competitive interactions underlying ocular dominance plasticity, if all the deprived-eye geniculocortical presynaptic sites were lost, there would be no possibility for recovery of the deprived-eye projection after reverse suture. However, our finding that a substantial fraction of presynaptic sites remains in the deprived-eye projection after 7 d of MD suggests a mechanism for recovery of deprived-eye responses and regrowth of deprived-eye arbors after reverse suture.
The present results show that synaptic density is equal in deprived and nondeprived geniculocortical afferents after 7 d of MD. This is in apparent contradiction with the findings of Friedlander et al. (1991), who filled Y-type geniculocortical axons projecting to area 18 with horseradish peroxidase and performed light and electron microscopic analysis of normal, deprived, and nondeprived axon arbors. They found that deprived-eye arbors had a 175% higher density of presynaptic boutons per mm3 of tissue than nondeprived-eye arbors, a result similar to the dynamic synapse model described in Figure 5. Any of several experimental differences between the present study and that of Friedlander et al. (1991) exist that could account for the different results. (1) The animals in theFriedlander et al. (1991) experiments were deprived for much longer than those in the present study (1–4 years vs 2–7 d). (2) We studied a mixture of X- and Y-type neurons projecting to cortical area 17, whereas the Friedlander et al. (1991) study focused exclusively on Y-type axons in area 18. (3) We measured the average synaptic density over the entire arbor, whereas Friedlander et al. (1991) confined their bouton density measurements to the densest central portion of their labeled arbors. (4) The bouton density measurements given inFriedlander et al. (1991) are boutons per volume of brain within the selected region, not boutons per unit length or volume of presynaptic axon. Therefore, an increase in the density of presynaptic arbor within the selected volume may account for their findings.
Maintenance of synaptic density in geniculocortical axons after 7 d of MD
The most striking finding of this study is the conservation of numerical synaptic density in geniculocortical arbors throughout a period in which half the branches of deprived-eye arbors are lost. The relative synaptic density of deprived and nondeprived geniculocortical axons was unaffected by 7 d of MD. This indicates that these arbors regulate the density of presynaptic sites to keep it constant despite dramatic changes in their activity patterns and large scale morphological rearrangements. Such conservation of synaptic density also implies that elimination of presynaptic sites and retraction of axon branches occur at similar rates.
On a shorter time scale, tight coupling of axon branch dynamics and addition and withdrawal of presynaptic sites was observed in developingXenopus retinotectal axons, where even short branch tips, whose average lifetimes are ∼10 min (Witte et al. 1996), contain synaptophysin puncta (Pinches and Cline, 1998). Thus, the conservation seen in retracting axons in the present study over days may also be present in growing axons over a time scale of minutes.
We do not know whether the coordinate regulation of axonal branches and presynaptic sites that we have observed is widespread or universal within the CNS, but the cell biology of this conservation phenomenon merits investigation.
Footnotes
M.A.S. was a Howard Hughes Medical Institute Predoctoral Fellow. This work was supported by National Institutes of Health Grant EY02874 (M.P.S.). We thank Louis Reichardt for providing anti-synaptotagmin antibodies, Regis Kelly for providing anti-SV2 antibodies, and Antonella Antonini, Allan Basbaum, Karen Mac-Leod, Christopher Trepel, and Tania Vu for reviewing this manuscript. In addition, M.A.S. thanks Antonella Antonini for teaching me many of the techniques used in this paper and Karen MacLeod for excellent veterinary surgical assistance.
Correspondence should be addressed to Professor Michael P. Stryker, Department of Physiology, Room S-762, 513 Parnassus Avenue, University of California, San Francisco, CA 94143-0444. E-mail:stryker@phy.ucsf.edu.
REFERENCES
- 1.Ahmed B, Anderson JC, Douglas RJ, Martin KAC, Nelson JC. Polyneuronal innervation of spiny stellate neurons in cat visual cortex. J Comp Neurol. 1994;341:39–49. doi: 10.1002/cne.903410105. [DOI] [PubMed] [Google Scholar]
- 2.Antonini A, Stryker MP. Development of individual geniculocortical arbors in cat striate cortex and effects of binocular impulse blockade. J Neurosci. 1993a;13:3549–3573. doi: 10.1523/JNEUROSCI.13-08-03549.1993. [DOI] [PMC free article] [PubMed] [Google Scholar]
- 3.Antonini A, Stryker MP. Rapid remodeling of axonal arbors in the visual cortex. Science. 1993b;260:1819–1821. doi: 10.1126/science.8511592. [DOI] [PubMed] [Google Scholar]
- 4.Antonini A, Stryker MP. Plasticity of geniculocortical afferents following brief or prolonged monocular occlusion in the cat. J Comp Neurol. 1996;369:64–82. doi: 10.1002/(SICI)1096-9861(19960520)369:1<64::AID-CNE5>3.0.CO;2-I. [DOI] [PubMed] [Google Scholar]
- 5.Antonini A, Stryker MP. Effects of sensory disuse on geniculate afferents to cat visual cortex. Vis Neurosci. 1998;15:401–409. doi: 10.1017/s0952523898153105. [DOI] [PMC free article] [PubMed] [Google Scholar]
- 6.Antonini A, Gillespie DC, Crair MC, Stryker MP. Morphology of single geniculocortical afferents and functional recovery of the visual cortex after reverse monocular deprivation in the kitten. J Neurosci. 1998;18:9896–9909. doi: 10.1523/JNEUROSCI.18-23-09896.1998. [DOI] [PMC free article] [PubMed] [Google Scholar]
- 7.Balice-Gordon RJ, Lichtman JW. In vivo observations of pre- and postsynaptic changes during the transition from multiple to single innervation at developing neuromuscular junctions. J Neurosci. 1993;13:834–855. doi: 10.1523/JNEUROSCI.13-02-00834.1993. [DOI] [PMC free article] [PubMed] [Google Scholar]
- 8.Betz WJ, Mao F, Bewick GS. Activity-dependent fluorescent staining and destaining of living vertebrate motor nerve terminals. J Neurosci. 1992;12:363–375. doi: 10.1523/JNEUROSCI.12-02-00363.1992. [DOI] [PMC free article] [PubMed] [Google Scholar]
- 9.Blakemore C, Van Sluyters RC. Reversal of the physiological effects of monocular deprivation in kittens: further evidence for a sensitive period. J Physiol (Lond) 1974;237:195–216. doi: 10.1113/jphysiol.1974.sp010478. [DOI] [PMC free article] [PubMed] [Google Scholar]
- 10.Blakemore C, Vital-Durand F. Postnatal development of the monkey's visual system. Ciba Found Symp. 1981;86:152–171. doi: 10.1002/9780470720684.ch7. [DOI] [PubMed] [Google Scholar]
- 11.Buckley K, Kelly RB. Identification of a transmembrane glycoprotein specific for secretory vesicles of neural and endocrine cells. J Cell Biol. 1985;100:1284–1294. doi: 10.1083/jcb.100.4.1284. [DOI] [PMC free article] [PubMed] [Google Scholar]
- 12.Burchfiel JL, Duffy FH. Role of intracortical inhibition in deprivation amblyopia: reversal by microiontophoretic bicuculline. Brain Res. 1981;206:479–484. doi: 10.1016/0006-8993(81)90551-5. [DOI] [PubMed] [Google Scholar]
- 13.Broadie KS, Bate M. Development of the embryonic neuromuscular synapse of Drosophila melanogaster. J Neurosci. 1993;13:144–166. doi: 10.1523/JNEUROSCI.13-01-00144.1993. [DOI] [PMC free article] [PubMed] [Google Scholar]
- 14.Calhoun ME, Jucker M, Martin LJ, Thinakaran G, Price DL, Mouton PR. Comparative evaluation of synaptophysin-based methods for quantification of synapses. J Neurocytol. 1996;25:821–828. doi: 10.1007/BF02284844. [DOI] [PubMed] [Google Scholar]
- 15.Chang Y-C, Gottlieb DI. Characterization of the proteins purified with monoclonal antibodies to glutamic acid decarboxylase. J Neurosci. 1988;8:2123–2130. doi: 10.1523/JNEUROSCI.08-06-02123.1988. [DOI] [PMC free article] [PubMed] [Google Scholar]
- 16.Chapman B, Jacobson MD, Reiter HO, Stryker MP. Ocular dominance shift in kitten visual cortex caused by imbalance in retinal electrical activity. Nature. 1986;324:154–156. doi: 10.1038/324154a0. [DOI] [PubMed] [Google Scholar]
- 17.Chun JJM, Shatz CJ. Redistribution of synaptic vesicle antigens is correlated with the disappearance of a transient synaptic zone in the developing cerebral cortex. Neuron. 1988;1:297–310. doi: 10.1016/0896-6273(88)90078-5. [DOI] [PubMed] [Google Scholar]
- 18.Cohen J. Statistical power analysis for the behavioral sciences, Ed 2. Lawrence Erlbaum; Hillsdale, NJ: 1988. [Google Scholar]
- 19.Colman H, Nabekura J, Lichtman JW. Alterations in synaptic strength preceding axon withdrawal. Science. 1997;275:356–361. doi: 10.1126/science.275.5298.356. [DOI] [PubMed] [Google Scholar]
- 20.Esclapez M, Tillakaratne NJK, Kaufman DL, Tobin AJ, Houser CR. Comparative localization of two forms of glutamic acid decarboxylase and their mRNAs in rat brain supports the concept of functional differences between the forms. J Neurosci. 1994;14:1834–1855. doi: 10.1523/JNEUROSCI.14-03-01834.1994. [DOI] [PMC free article] [PubMed] [Google Scholar]
- 21.Fletcher TL, Cameron P, De Camilli P, Banker G. The distribution of synapsin 1 and synaptophysin in hippocampal neurons developing in culture. J Neurosci. 1991;11:1617–1626. doi: 10.1523/JNEUROSCI.11-06-01617.1991. [DOI] [PMC free article] [PubMed] [Google Scholar]
- 22.Freund TF, Martin KAC, Whitteridge D. Innervation of cat visual areas 17 and 18 by physiologically identified X- and Y-type thalamic afferents. I. Arborization patterns and quantitative distribution of postsynaptic elements. J Comp Neurol. 1985;242:263–274. doi: 10.1002/cne.902420208. [DOI] [PubMed] [Google Scholar]
- 23.Friedlander MJ, Martin KAC. Development of Y-axon innervation of cortical area 18 in the cat. J Physiol (Lond) 1989;416:183–213. doi: 10.1113/jphysiol.1989.sp017756. [DOI] [PMC free article] [PubMed] [Google Scholar]
- 24.Friedlander MJ, Martin KAC, Wassenhove-McCarthy D. Effects of monocular visual deprivation on geniculocortical innervation of area 18 in cat. J Neurosci. 1991;11:3268–3288. doi: 10.1523/JNEUROSCI.11-10-03268.1991. [DOI] [PMC free article] [PubMed] [Google Scholar]
- 25.Garey LJ, Powell TPS. An experimental study of the termination of the lateral geniculo-cortical pathway in the cat and monkey. Proc R Soc Lond B Biol Sci. 1971;179:41–63. doi: 10.1098/rspb.1971.0080. [DOI] [PubMed] [Google Scholar]
- 26.Gerfen CR, Sawchenko PE. An anterograde neuroanatomical tracing method that shows the detailed morphology of neurons, their axons and terminals: immunohistochemical localization of an axonally transported plant lectin, Phaseolus vulgaris leucoagglutinin (PHA-L). Brain Res. 1984;290:219–238. doi: 10.1016/0006-8993(84)90940-5. [DOI] [PMC free article] [PubMed] [Google Scholar]
- 27.Guillery RW. Binocular competition in the control of geniculate cell growth. J Comp Neurol. 1972;144:117–130. doi: 10.1002/cne.901440106. [DOI] [PubMed] [Google Scholar]
- 28.Hata Y, Tsumoto T, Stryker MP. Selective pruning of more active afferents when cat visual cortex is pharmacologically inhibited. Neuron. 1999;22:375–381. doi: 10.1016/s0896-6273(00)81097-1. [DOI] [PubMed] [Google Scholar]
- 29.Hays WL. Statistics for psychologists. Holt, Rinehart and Winston; New York: 1963. [Google Scholar]
- 30.Hensch TK. PhD thesis. University of California, San Francisco; 1996. Development and plasticity of visual cortex: a role for intracortical interactions. [Google Scholar]
- 31.Hubel DH, Wiesel TN. Receptive fields, binocular interaction and functional architecture in the cat's visual cortex. J Physiol (Lond) 1962;160:106–154. doi: 10.1113/jphysiol.1962.sp006837. [DOI] [PMC free article] [PubMed] [Google Scholar]
- 32.Hubel DH, Wiesel TN. The period of susceptibility to the physiological effects of unilateral eye closure in kittens. J Physiol (Lond) 1970;206:419–436. doi: 10.1113/jphysiol.1970.sp009022. [DOI] [PMC free article] [PubMed] [Google Scholar]
- 33.Hubel DH, Wiesel TN. Laminar and columnar distribution of geniculo-cortical fibers in the macaque monkey. J Comp Neurol. 1972;146:421–450. doi: 10.1002/cne.901460402. [DOI] [PubMed] [Google Scholar]
- 34.Hunter JE, Schmidt FL. Methods of meta-analysis: correcting error and bias in research findings. SAGE Publications; Newbury Park, CA: 1990. [Google Scholar]
- 35.Kaufman DL, Houser CR, Tobin AJ. Two forms of the gamma-aminobutyric acid synthetic enzyme glutamate decarboxylase have distinct intraneuronal distributions and cofactor interactions. J Neurochem. 1991;56:720–723. doi: 10.1111/j.1471-4159.1991.tb08211.x. [DOI] [PMC free article] [PubMed] [Google Scholar]
- 36.Kraszewski K, Mundigl O, Daniell L, Verderio C, Matteoli M, De Camilli P. Synaptic vesicle dynamics in living cultured hippocampal neurons visualized with CY3-conjugated antibodies directed against the lumenal domain of synaptotagmin. J Neurosci. 1995;15:4328–4342. doi: 10.1523/JNEUROSCI.15-06-04328.1995. [DOI] [PMC free article] [PubMed] [Google Scholar]
- 37.Kratz KE, Spear PD, Smith DC. Postcritical-period reversal of effects of monocular deprivation on striate cortex cells in the cat. J Neurophysiol. 1976;39:501–511. doi: 10.1152/jn.1976.39.3.501. [DOI] [PubMed] [Google Scholar]
- 38.Littleton JT, Bellen HJ, Perin MS. Expression of synaptotagmin in Drosophila reveals transport and localization of synaptic vesicles to the synapse. Development. 1993;118:1077–1088. doi: 10.1242/dev.118.4.1077. [DOI] [PubMed] [Google Scholar]
- 39.Matthew WD, Tsavaler L, Reichardt LF. Identification of a synaptic vesicle-specific membrane protein with a wide distribution in neuronal and neurosecretory tissue. J Cell Biol. 1981;91:257–269. doi: 10.1083/jcb.91.1.257. [DOI] [PMC free article] [PubMed] [Google Scholar]
- 40.Pinches EM, Cline HT. Distribution of synaptic vesicle proteins within single retinotectal axons of Xenopus tadpoles. J Neurobiol. 1998;35:426–434. [PubMed] [Google Scholar]
- 41.Reiter HO, Waitzman DM, Stryker MP. Cortical activity blockade prevents ocular dominance plasticity in the kitten visual cortex. Exp Brain Res. 1986;65:182–188. doi: 10.1007/BF00243841. [DOI] [PubMed] [Google Scholar]
- 42.Sanderson KJ. Visual field projection columns and magnification factors in the lateral geniculate nucleus of the cat. Exp Brain Res. 1971;13:159–177. doi: 10.1007/BF00234084. [DOI] [PubMed] [Google Scholar]
- 43.Shatz CJ. Impulse activity and the patterning of connections during CNS development. Neuron. 1990;5:745–756. doi: 10.1016/0896-6273(90)90333-b. [DOI] [PubMed] [Google Scholar]
- 44.Shatz CJ, Stryker MP. Ocular dominance in layer IV of the cat's visual cortex and the effects of monocular deprivation. J Physiol (Lond) 1978;281:267–283. doi: 10.1113/jphysiol.1978.sp012421. [DOI] [PMC free article] [PubMed] [Google Scholar]
- 45.Shatz CJ, Lindstrom S, Wiesel TN. The distribution of afferents representing the right and left eyes in the cat's visual cortex. Brain Res. 1977;131:103–116. doi: 10.1016/0006-8993(77)90031-2. [DOI] [PubMed] [Google Scholar]
- 46.Silver MA, Stryker MP. Synaptic density in geniculocortical afferents remains constant following monocular deprivation in cat. Soc Neurosci Abstr. 1997;23:1664. doi: 10.1523/JNEUROSCI.19-24-10829.1999. [DOI] [PMC free article] [PubMed] [Google Scholar]
- 47.Silver MA, Stryker MP. Synaptic vesicle protein levels remain equal in deprived and nondeprived ocular dominance columns in layer IV of kitten visual cortex after monocular deprivation (MD). Eur J Neurosci. 1998;10[Suppl 10]:281. [Google Scholar]
- 48.Silver MA, Stryker MP. GAD65 immunoreactivity levels in deprived and nondeprived ocular dominance columns remain equal following monocular deprivation in kitten. Soc Neurosci Abstr. 1999;25:1315. [Google Scholar]
- 49.Silver MA, Stryker MP (2000) A method for measuring colocalization of presynaptic markers with anatomically labeled axons using double label immunofluorescence and confocal microscopy. J Neurosci Methods, in press. [DOI] [PubMed]
- 50.Spear PD, Langsetmo A, Smith DC. Age-related changes in effects of monocular deprivation on cat striate cortex neurons. J Neurophysiol. 1980;43:559–580. doi: 10.1152/jn.1980.43.3.559. [DOI] [PubMed] [Google Scholar]
- 51.Staple JK, Osen-Sand A, Benfenati F, Pich EM, Catsicas S. Molecular and functional diversity at synapses of individual neurons in vitro. Eur J Neurosci. 1997;9:721–731. doi: 10.1111/j.1460-9568.1997.tb01420.x. [DOI] [PubMed] [Google Scholar]
- 52.Stryker MP. Evidence for a possible role of spontaneous electrical activity in the development of the mammalian visual cortex. In: Kellaway P, Noebels JL, editors. Problems and concepts in developmental neurophysiology. Johns Hopkins UP; Baltimore: 1989. pp. 110–130. [Google Scholar]
- 53.Voigt T, de Lima AD, Beckman M. Synaptophysin immunohistochemistry reveals inside-out pattern of early synaptogenesis in ferret cerebral cortex. J Comp Neurol. 1993;330:48–64. doi: 10.1002/cne.903300105. [DOI] [PubMed] [Google Scholar]
- 54.Wiedenmann B, Franke WW. Identification and localization of synaptophysin, an integral membrane glycoprotein of Mr 38,000 characteristic of presynaptic vesicles. Cell. 1985;41:1017–1028. doi: 10.1016/s0092-8674(85)80082-9. [DOI] [PubMed] [Google Scholar]
- 55.Wiesel TN, Hubel DH. Effects of visual deprivation on morphology and physiology of cells in the cat's lateral geniculate body. J Neurophysiol. 1963a;26:978–993. doi: 10.1152/jn.1963.26.6.978. [DOI] [PubMed] [Google Scholar]
- 56.Wiesel TN, Hubel DH. Single-cell responses in striate cortex of kittens deprived of vision in one eye. J Neurophysiol. 1963b;26:1003–1017. doi: 10.1152/jn.1963.26.6.1003. [DOI] [PubMed] [Google Scholar]
- 57.Winfield DA. The postnatal development of synapses in the different laminae of the visual cortex in the normal kitten and in kittens with eyelid suture. Brain Res Dev Brain Res. 1983;9:155–169. doi: 10.1016/0165-3806(83)90048-2. [DOI] [PubMed] [Google Scholar]
- 58.Witte S, Stier H, Cline HT. In vivo observations of timecourse and distribution of morphological dynamics in Xenopus retinotectal axon arbors. J Neurobiol. 1996;31:219–234. doi: 10.1002/(SICI)1097-4695(199610)31:2<219::AID-NEU7>3.0.CO;2-E. [DOI] [PubMed] [Google Scholar]
- 59.Zar JH. Biostatistical analysis, Ed 2. Prentice Hall; Englewood Cliffs, NJ: 1984. [Google Scholar]