

Abstract
Retinal neurons extend their dendritic fields to achieve a degree of dendritic overlap with homotypic neighbors that is cell-type specific. How these neurons regulate their dendritic growth is unclear. The dendritic field of a retinal horizontal cell varies inversely with horizontal cell density across different strains of mice, suggesting that proximity to neighboring cells regulates dendritic growth. To test this directly, we have employed the Cre-loxP conditional gene targeting strategy to achieve inactivation of Lim1 function in developing horizontal cells. Through this approach, Lim1 function was prevented within a subset of horizontal cells that in turn fail to migrate to the horizontal cell layer and differentiate normally. For those remaining horizontal cells with Lim1 intact (about half of the normal population in these mice), we show that they spread themselves out tangentially, and differentiate a dendritic morphology that is essentially normal but for the fact that it has nearly doubled in area. Such larger horizontal cells, sampling from an area of retina containing twice their normal afferent number, differentiate a dendritic field with nearly double the number of higher order branches and terminal clusters. These results demonstrate directly that positioning and dendritic growth are regulated by interactions with homotypic neighbors, while afferents instruct the differentiation of dendritic patterning.
Keywords: cone photoreceptor, pedicle, outer plexiform layer, differentiation, retinal mosaic
Introduction
Horizontal cells are retinal interneurons that, like other retinal cells, are believed to arise from multi-potent progenitors that divide at the ventricular surface of the developing retina (Turner et al., 1990). Once having departed the mitotic cycle, newly fated horizontal cells migrate radially to the future horizontal cell layer, where they then differentiate their fated morphologies (Hinds & Hinds, 1979; Zimmerman et al., 1988). Because of the regularity in cellular positioning, thought to be a product of periodic fate-determining events, such mosaics of retinal nerve cells establish a uniformity in dendritic coverage across the retinal surface (Wässle et al., 1978).
Three recent sets of findings are revising our understanding of horizontal cell development. First, in the zebrafish retina, progenitors divide within the developing horizontal cell layer itself, producing exclusively horizontal cells that subsequently move apart from one another (Godinho et al., 2007). While it is not clear that this mode of proliferation normally yields any horizontal cells in the mammalian retina, horizontal cells have been shown to disperse tangentially, and close proximity between homotypic neighbors may drive this dispersion (Reese et al., 1999). Furthermore, another very recent study has shown that, in mice deficient in the Rb family of proteins regulating cell cycle exit, differentiated horizontal cells can re-enter the cell cycle and, remarkably, proliferate while retaining features of their mature morphology (Ajioka et al., 2007). Second, horizontal cells have been shown to migrate beyond the future horizontal cell layer, reaching the inner depths of the retina before migrating back to colonize a prospective horizontal cell stratum (Edqvist & Hallbook, 2004). The apically directed portion of this migratory course has now been shown to be due to the LIM homeodomain transcription factor, Lim1 (Poché et al., 2007). And third, horizontal cells in the mouse retina have been shown to display a remarkable degree of morphological plasticity, differentiating a dendritic patterning that correlates with genetic re-specification of the photoreceptor population (Raven et al., 2007).
The functional coverage of horizontal cells is a product of their dendritic spread and their local spacing; while both have been suggested to depend upon homotypic interactions, the evidence to date is only correlational (Reese et al., 2005; Raven et al., 2005a). The present study has sought direct evidence that homotypic interactions control somal positioning and dendritic growth. We have used a conditional gene targeting approach, employing Cre-mediated recombination to target the transcription factor gene Lim1 (Kwan & Behringer, 2002) known to be expressed exclusively in horizontal cells in the developing retina (Liu et al., 2000). Employing retina-specific Cre-expressing mouse lines (Furuta et al., 2000; Rowan & Cepko, 2004), mosaic inactivation of Lim1 function was achieved in large numbers of cells that fail to migrate to the horizontal cell layer and differentiate normally (Poché et al., 2007). Here, we focus upon the remaining, correctly localized, Lim1-positive horizontal cells: what is the effect of this reduction in homotypic neighbors upon the positioning and differentiation of those remaining cells?
Materials and Methods
Animals
The genesis of conditional Lim1 knockout mice used in the present study has been described elsewhere (Poché et al., 2007). These mice, originating on a mixed C57BL/6J, 129/SvEv background, harbor a floxed allele of Lim1. When bred with Six3-Cre or Chx10-Cre transgenic mice, Cre-mediated recombination of the Lim1 floxed allele occurs in those descendants of the retinal progenitors expressing Six3-Cre or Chx10-Cre transgenes during development. These mice are also heterozygous for a tau-lacZ reporter cassette in place of one normal Lim1 gene in the Cre-expressing mice, permitting identification of the wild-type and Lim1-deficient populations of horizontal cells. Four +/+; Lim1-lacZ/flox heterozygotes and three Six3-Cre; Lim1-lacZ/flox littermate mice were used in the present study to study dendritic morphology (referred to as the Six3-Cre cross), while five +/+; Lim1-lacZ/flox heterozygotes and ten Chx10-Cre; Lim1-lacZ/flox littermate mice were used to examine either dendritic morphology or cellular positioning (the Chx10-Cre cross). All mice were between two and four and a half months of age.
Tissue preparation
Mice were given a lethal dose of sodium pentobarbital (120 mg/kg, i.p.) and then perfused intracardially with 0.9% saline followed by 4% paraformaldehyde (pH 7.2 at 20°C in 0.1M sodium phosphate buffer). Whole retinas were dissected from the eyes immediately, and then prepared either for immunofluorescence or for single cell labeling of the horizontal cells. All studies were conducted under authorization by respective Institutional Animal Care and Use Committees, and in accord with the NIH Guide for the Care and Use of Laboratory Animals.
Immunofluorescence and quantification of cell density
Retinas from one eye of each mouse were infiltrated with 20% sucrose in phosphate buffer at 4°C and sequentially labeled with antibodies to Calbindin-D28 (a mouse monoclonal antibody at 1:10,000 from Sigma; St. Louis, MO), cone opsin (a cocktail of rabbit polyclonal antisera to S and M cone opsins, kindly provided by Dr. Jeremy Nathans, Johns Hopkins University), and β-galactosidase (a rabbit polyclonal antibody at 1:500 from MP Biochemicals, Solon, OH). Primary antibodies were detected with secondary IgGs conjugated to Cy2 and Cy3. Fuller details of the procedure are described elsewhere (Raven & Reese, 2003). One central field (for the Six3-Cre cross) or both a central and a peripheral field (for the Chx10-Cre cross) 318 μm × 318 μm in size were sampled from each retinal quadrant at 1 μm intervals in the Z axis using an Olympus Fluoview laser scanning confocal microscope and a 40× objective. All horizontal cells in the inner nuclear layer adjacent to the outer plexiform layer (normally positioned horizontal cells) were counted in each field in order to determine local horizontal cell density, and an average density was then calculated for each retina. (Because there was no significant difference in average density in the center versus the periphery of the control and conditional knockout retinas in the Chx10-Cre cross, these data were combined). All cones were counted in one (Six3-Cre cross) or two (Chx10-Cre cross) 114 μm × 114 μm fields in each retinal quadrant using an Olympus epifluorescence microscope, and an average density was calculated for each retina. Retinal areas were also measured, using Bioquant software.
DiI labeling and analysis of horizontal cell morphology
A crystal of the lipophilic dye, DiI (Molecular Probes; Eugene, OR) was inserted under microscopic control into each quadrant of the retina of the remaining eye from each mouse derived from either cross. Retinas were left under a coverslip in 4% paraformaldehyde in phosphate buffer for five or six days, when individual horizontal cells, labeled by diffusion through their axons (Sandmann et al., 1996), were subsequently harvested using the laser scanning confocal microscope with a 60× objective at 0.5 μm intervals. Individual cells were reconstructed through their full three-dimensional extent using Metamorph (Downington, PA). The number of primary dendrites, the size of the dendritic field area, the number of branch-points per dendritic field, and the number of terminal clusters per dendritic field were analyzed in well-labeled cells from each group. Morphometric analysis was conducted directly from the reconstruction (for determining dendritic field area), or from stepping through the individual confocal planes (for the other three features), using Metamorph. Student’s t tests were conducted for comparing dendritic field size and morphology in these mice.
Voronoi domain and autocorrelation analysis of mosaic regularity and spacing
The X–Y coordinates of every horizontal cell in the eight sampled fields of each retina derived from the Chx10-Cre cross were identified, and from these, the Voronoi domain associated with each cell in the field was computed. The Voronoi domain of a cell is the area in the plane of the retina enclosing all points closer to that cell than to any other cell. By computing the ratio of the average Voronoi domain area within a field to the standard deviation associated with all the domains in a field, a “regularity index” (RI) can be calculated. The spatial autocorrelogram of these fields of cells was also computed from these X–Y coordinates, from which the density recovery profile and its derivative measure, the “effective radius” (ER), were calculated (Reese et al., 2005). The autocorrelogram displays the positioning of all cells relative to every other cell, revealing a central region surrounding the origin in which cell density is lower than at greater eccentricities (an “exclusion zone”), being delineated by the population of near neighbors for all cells in the field. The ER is a measure of the size of this exclusion zone, as described elsewhere (Rodieck, 1991). Both the RI and the ER were determined for each field in both Chx10-Cre; Lim1-lacZ/flox retinas and in their Lim1-lacZ littermate control retinas, and an average score derived from the eight fields for each retina was determined. In addition, simulated deletions of the Lim1-lacZ control retinas were also generated, so that each field had 54% of the population randomly eliminated, after which both the RI and ER were calculated. One-way ANOVAs were conducted to determine whether there was an effect of condition on RI or ER, while post-hoc Scheffe tests were conducted to identify significant differences between groups.
Results
Deletion of Lim1 from horizontal cells has been shown to disrupt horizontal cell lamination, so that Lim1-deleted cells become mis-positioned to more vitreal regions of the inner nuclear layer (INL), many adjacent to the inner plexiform layer (IPL) (Poché et al., 2007). There, they differentiate a dendritic tree that arborizes within the IPL rather than within the outer plexiform layer (OPL) (Poché et al., 2007) (figure 1a, b). That these cells would have otherwise been fated to become normally positioned horizontal cells is evidenced by the fact that they express calbindin (red label in figure 1c, d), as horizontal cells normally do, along with other proteins present in horizontal cells like Prox1 and Doublecortin, but that they do not express any amacrine cell or other markers that are normally excluded from horizontal cells (Poché et al., 2007). More critically, they also express the lacZ reporter gene product, β-galactosidase (green label in figure 1c, d), driven by the Lim1 regulatory locus that normally drives Lim1 expression in a horizontal cell-specific manner (Poché et al., 2007). Furthermore, these cells are most frequent in those locations of the retina where horizontal cell density in the outer retina is reduced, although no parts of the retina show a mis-positioning of every horizontal cell (Poché et al., 2007). This incomplete phenotype is a consequence of mosaic recombinase activity of the Six3-Cre and Chx10-Cre lines. Six3-Cre mice carrying the ROSA26 lacZ reporter show variegated β-galactosidase expression in the optic cup that is consistent with the clonal organization of the retina at this stage (Reese et al., 1999) (figure 1e, f); a similar Chx10-Cre mosaicism is described elsewhere (Rowan & Cepko, 2004). This interpretation of the mosaicism in the phenotype is supported by the fact that misplaced cells all fail to express the Lim1 transcription factor, while those that remain in the normal horizontal cell layer abutting the OPL continue to do so (Poché et al., 2007). The mis-positioning of Lim1-negative horizontal cells is described in detail elsewhere (Poché et al., 2007); the present investigation focuses upon the remaining, properly localized, Lim1+ horizontal cells, that are now depleted of their normal homotypic neighbor relationships.
Figure 1.
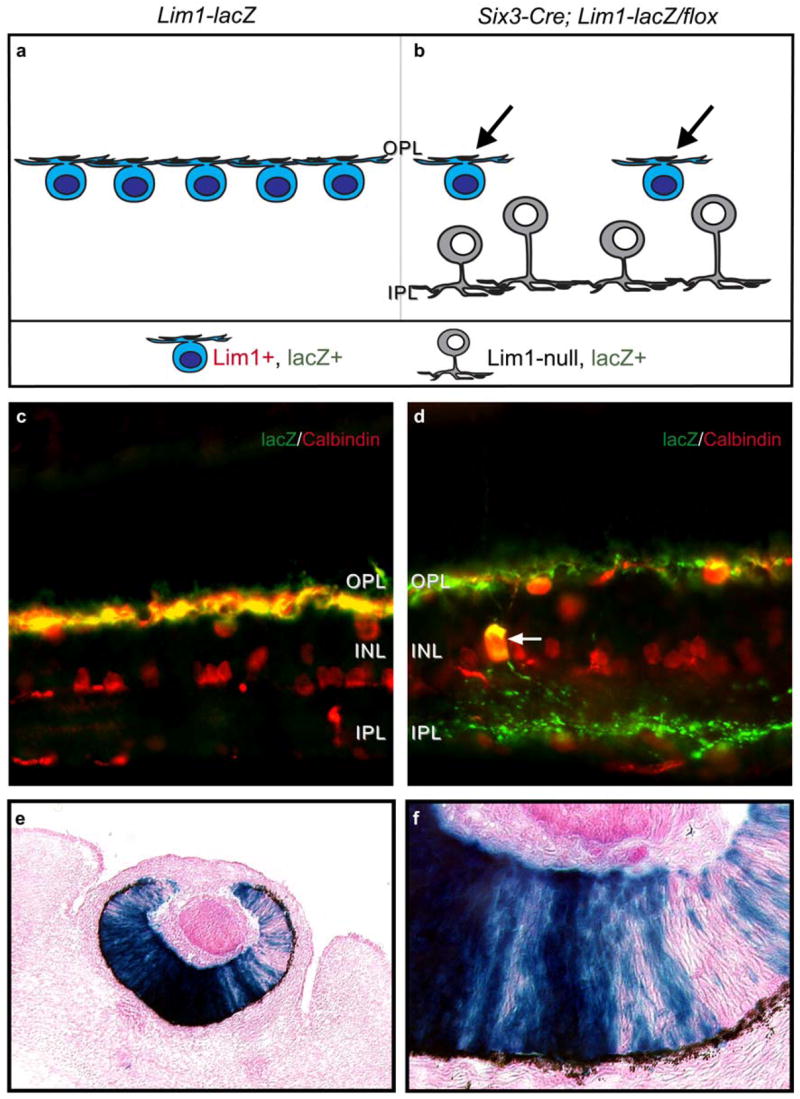
Schematic diagram showing the effect of deleting Lim1 function in mosaic-conditional Lim1-knockout mice, examined at P-20. Lim1-deficient horizontal cells have become mis-positioned within the amacrine cell layer, while Lim1-intact horizontal cells correctly target their normal stratum at the OPL (a, b). Mis-positioned horizontal cells express both calbindin and the lacZ gene product, β-galactosidase (double-labeled cell indicated by white arrow in a Six3-Cre; Lim1-lacZ/flox retina in d), as do normally positioned horizontal cells in both conditional knockout retinas (d) as well as in control (Lim1-lacZ) retinas (c). Note the ectopic β-galactosidase staining within the IPL (green) that emerges from such ectopically positioned horizontal cells (e.g. from the cell indicated by the arrow in d). Retinas present a Amosaic-conditional@ knockout phenotype due to the mosaicism in the early expression of Cre recombinase, evidenced in an embryonic day 13.5 retinal section from a Six3-Cre; R26R reporter mouse showing variegated lacZ expression in the pattern of β-galactosidase staining (e, f). The expression pattern is consistent with the clonal organization of the retina at these early stages, indicating that Cre-mediated recombination should excise Lim1 in only a proportion of horizontal cells, being consistent with the phenotype of Lim1 conditional knockout retinas in maturity, described above. The present investigation has asked, what is the effect of partially depleting horizontal cells of their homotypic neighbors upon their subsequent differentiation (black arrows in b)?
Horizontal cell density
An array of calbindin-immunopositive horizontal cells and their processes is distributed across the +/+; Lim1-lacZ/flox littermate control retina (hereafter referred to as “Lim1-lacZ”) at the outer margin of the INL, similar to that described for C57BL/6 mice (Reese et al., 2005) (Fig. 2a). Because these cells also express the reporter gene cassette, the OPL is densely filled with β-gal-immunopositive processes emanating from these cells (e.g. Fig. 1c). The estimated total number of horizontal cells in the outer retina of these Lim1-lacZ mice, derived by multiplying the average density for each retina by retinal area, was 19,086 cells for the Six3-Cre cross (n = 4), and was 19,072 cells for the Chx10-Cre cross (n = 4), these numbers being roughly comparable to that found in standard C57BL/6 mice.
Figure 2.

Distribution of calbindin-positive horizontal cells adjacent to the outer plexiform layer in the four quadrants of a typical Lim1-lacZ retina (a) and in a Six3-Cre; Lim1-lacZ/flox retina (b). Calibration bar = 50 μm.
In the conditional knock-out mice derived from either the Six3-Cre (Fig. 2b) or Chx10-Cre cross (not shown), by contrast, horizontal cell density at the outer margin of the INL was conspicuously reduced, as was the density of associated β-gal-immunopositive processes in the OPL (e.g. Fig. 1d). While the density of horizontal cells was more variable across these conditional knockout mice relative to their control littermates, there was no overlap in the densities between the 16 fields from the Lim1-lacZ retinas and the 12 fields from the Six3-Cre; Lim1-lacZ/flox retinas, while one conditional knockout retina from the Chx10-Cre; Lim1-lacZ/flox group had relatively higher densities, overlapping with one of the Lim1-lacZ littermate retinas from this cross. As a group, the Six3-Cre; Lim1-lacZ/flox mice showed an average reduction in horizontal cell density of 61% (Fig. 3a), while the Chx10-Cre; Lim1-lacZ/flox mice showed an average reduction of 54% (Fig. 3d). This reduction in density is not a consequence of differences in retinal area between the conditional knockout and control groups: the conditional knockout retinas in both lines were slightly, though not significantly, smaller (Fig. 3b, e), and so the decline in density cannot be a consequence of these retinas having undergone greater areal expansion through either growth or technical artifact. Rather, as indicated above, the difference between conditional knockout and control retinas should be accounted for by the failure of Lim1-null horizontal cells to localize to their appropriate depth within the retina (Poché et al., 2007).
Figure 3.

Horizontal cell density is significantly reduced in the Six3-Cre; Lim1-lacZ/flox retina (p < 0.001) (a) and in the Chx10-Cre; Lim1-lacZ/flox retina (p<0.001) (d). There are slight but non-significant changes in retinal area in these mice (b and e). Cone photoreceptor density appears slightly reduced in the Six3-Cre; Lim1-lacZ/flox mice (c), while it is slightly increased in the Chx10-Cre; Lim1-lacZ/flox mice (f). The latter comparison was significantly different (p<0.05). n = the number of retinas analyzed.
Horizontal cell positioning
Because horizontal cells are known to disperse tangentially, thought to be driven by interactions with homotypic neighbors as these cells differentiate (Reese et al., 1999; Raven et al., 2005b), we examined whether the mosaic of horizontal cells in the depleted Chx10-Cre; Lim1-lacZ/flox retinas showed any evidence for such regulation. Voronoi domain analysis revealed that, while the mosaic in the depleted Chx10-Cre; Lim1-lacZ/flox retinas was less regular than in the Lim1-lacZ control retinas, it was significantly more regular than in simulations in which a comparable number (54%) of horizontal cells were randomly removed from control littermate mosaics (Fig. 4a). This suggests that neighboring horizontal cells in the depleted Chx10-Cre; Lim1-lacZ/flox retinas moved further apart from one another than they would normally have moved. To address this possibility, autocorrelation analysis was conducted on these mosaics to determine the size of the effective radius (ER) associated with these horizontal cells, being an index of the proximity of near neighbors. The effective radius is relatively immune to the effects of undersampling from a mosaic (Cook, 1996), and a direct comparison between the control littermate retinas and simulated random deletions from these control retinas confirms this: the average ER for the control retinas was 17.9 μm while that for the simulated deletions was 18.5 μm. By contrast, the genetically depleted retinas had a significantly larger ER, being 24.2 μm (Fig. 4b). These results show that the intercellular spacing of neighboring horizontal cells has increased following partial depletion of the population.
Figure 4.

The regularity index of the horizontal cell mosaic in Chx10-Cre; Lim1-lacZ/flox depleted retinas is reduced relative to Lim1-lacZ littermate retinas (p < 0.001), yet this reduction is not as great as that observed in the Lim1-lacZ control mosaics simulated to have undergone a comparable, random, reduction in horizontal cell density (p < 0.001) (a). The effective radius of these genetically depleted mosaics is larger than that for the control mosaics (p < 0.01), while the effective radius of the randomly deleted mosaics is no different from the control mosaics. Cells in the genetically depleted retina therefore display a larger minimal spacing between neighboring cells than would be expected from random deletions achieving the same comparable overall reduction in density (p < 0.05). n = the number of retinas analyzed.
Horizontal cell dendritic morphology
The horizontal cells in the Lim1-lacZ mice show a dendritic morphology that is similar in nearly all respects to that described for C57BL/6 mice (Reese et al., 2005). These cells exhibit generally circular dendritic fields containing, on average, seven primary dendrites that give rise to higher order branches that in turn sample the cone photoreceptor mosaic (Fig. 5a). As for the C57BL/6 retina, these horizontal cells produce about 60 terminal clusters within their dendritic fields, approximating the density of cone pedicles lying within their field areas.
Figure 5.

Morphology of four single horizontal cells from Lim1-lacZ retinas (a) and Six3-Cre; Lim1-lacZ/flox retinas (b). Horizontal cells in each case look qualitatively normal when compared with the morphological features of horizontal cells in C57BL/6 mice. Calibration bar = 50 μm.
Lim1 expressing horizontal cells in the Six3-Cre; Lim1-lacZ/flox retinas (Fig. 5b), and within the Chx10-Cre; Lim1-lacZ/flox retinas (not shown), are not discriminable from each other, and look normal in most respects. They give rise to about seven primary dendrites that branch out to produce a generally circular dendritic field, displaying terminal clusters throughout the field. There are, however, three quantitative features that discriminate these horizontal cells in the conditional knock-out retinas from those of the Lim1-lacZ mice. Strikingly, their dendritic field areas differ in size, being on average 82% larger in the conditional knock-out retinas than in the Lim1-lacZ retinas (Fig. 6a, e). While that larger field is not established by any difference in the number of primary dendrites (Fig. 6b, f), those primary dendrites exhibit greater higher-order branching in the conditional knock-out retinas (Fig. 6c, g). Finally, Lim1 deletion in these retinas should not have any effect upon the population of cone photoreceptors, and this was largely confirmed by counting cone opsin-immunopositive outer segments in the two groups from both crosses. Cone density was slightly lower in the Six3-Cre; Lim1-lacZ/flox retinas, while it was slightly higher in the Chx10-Cre; Lim1-lacZ/flox retinas (Fig. 3c, f). The latter comparison proved to be significantly different, but this may reflect a consistently lower density in the Lim1-lacZ littermates in this cross (for reasons that remain obscure) rather than a higher density in the Chx10-Cre; Lim1-lacZ/flox retinas, since the latter (Fig. 3f) did not differ from that observed in the Six3-Cre; Lim1-lacZ/flox retinas (Fig. 3c). The horizontal cells, having larger dendritic field areas, could in principle sample from a larger than normal number of cone pedicles within their fields. In fact, these cells show, on average, a 76% increase in the number of terminal clusters formed within their dendritic fields (Fig. 6d, h), confirming this expected increase in the size of their afferent innervation.
Figure 6.

Horizontal cells in the either the Six3-Cre; Lim1-lacZ/flox retinas or the Chx10-Cre; Lim1-lacZ/flox retinas have larger dendritic field areas when compared with those from the Lim1-lacZ retinas (a, e) (p < 0.005 and < 0.00001, respectively). Their number of primary dendrites is the same (b, f), but the frequency of higher order branches within their dendritic fields is greater in the conditional knockout retinas (c, g) (p < 0.05 for both). Horizontal cells in the conditional knockout retinas receive innervation from a larger number of cone pedicles, evidenced by their differentiating a significantly larger number of terminal clusters (d, h) (p < 0.001 and < 0.00001, respectively). n = the number of cells analyzed.
Discussion
The present results demonstrate two new findings: first, they show that horizontal cells modulate their positioning upon the retinal surface in response to the presence of homotypic neighbors. That horizontal cells disperse tangentially has been recognized for some time (Reese et al., 1995), but evidence for a role of this tangential dispersion in mosaic formation has been largely correlative (Raven et al., 2005b). The recent demonstration, in zebrafish retina, for the active tangential migration of newborn horizontal cells (Godinho et al., 2007) lends credence to the view that proximity between neighboring horizontal cells propels them apart. The present results show that when normal homotypic relationships are reduced, remaining horizontal cells move further apart from one another, and that the effect of this movement is to improve the regularity of the mosaic. Why the genetically depleted mosaics do not achieve higher levels of regularity is unclear; it may be that there is an upper limit to the distance a horizontal cell can disperse.
Second, these results demonstrate that horizontal cells modulate their dendritic growth in response to local homotypic density. This is in contrast to recent studies showing, for three other types of retinal neuron, that depletion of homotypic density had no effect upon dendritic field growth (Farajian et al., 2004; Lin et al., 2004), but is consistent with the preservation in dendritic coverage factor for horizontal cells in two strains of mice with different densities of horizontal cells (Reese et al., 2005). There, of course, gene polymorphisms between the strains may contribute to intrinsic differences in horizontal cell growth; in the present study, the Lim1+ cells should be genetically identical in the control and conditional knockout retinas. In the chick retina, expression of a dominant-negative cadherin construct in horizontal cells leads to a decrease in dendritic field area (Tanabe et al., 2006). As all cellular components of the OPL appear to express N-cadherin, those studies were unclear as to whether the homophilic interaction is mediated by like-type cells. The present results, coupled with those studies modulating afferent innervation (Reese et al., 2005; Raven et al., 2007), would suggest that it must be, but exactly how cadherins might mediate this proximity-dependent growth remains to be clarified.
The connectivity of the horizontal cells in the conditional knockout retinas also displays a degree of afferent-dependent developmental plasticity, differentiating a greater than normal number of terminal clusters in association with the larger number of cone photoreceptors lying within their dendritic fields. This is consistent with other recent studies showing a remarkable degree of morphological plasticity that is dependent on afferent density: the dendritic patterning of pure cone mouse retinas is massively hypertrophic, while in pure rod mouse retinas it is severely atrophic (Raven et al., 2007). Despite these conspicuous differences in dendritic branching, the overall size of the dendritic field barely changes in these genetically respecified retinas, consistent with the view that homotypic relationships alone control dendritic field size.
The recent finding that differentiated horizontal cells can re-enter the cell cycle while maintaining features of their differentiated status reveals an unexpected degree of proliferative plasticity into maturity (Ajioka et al., 2007). Alas, these cells do not self-space, instead forming metastatic retinoblastoma. Exactly how plastic these horizontal cells are remains to be seen, but the two daughter cells appear to acquire and maintain the dendritic branches associated with the parental cell (Ajioka et al., 2007). Mature horizontal cells are known to possess some degree of morphological plasticity, evidenced by the radially directed sprouting of processes in a variety of retinal degeneration models (Lewis et al., 1998; Fariss et al., 2000; Strettoi & Pignatelli, 2000; Claes et al., 2004), but little is known of the intrinsic determinants upon this plasticity. In light of our expanding appreciation of the genetic control upon horizontal cell proliferation in maturity, further study of horizontal cell plasticity in such models may ultimately reveal a comparable genetic constraint that normally holds this plasticity in check.
In summary, we have shown that a genetic depletion of the population of horizontal cells modulates the tangential positioning and the dendritic field size of remaining, wild-type, horizontal cells. In conjunction with this increase in dendritic field size, these cells show increased dendritic branching and an increase in the number of terminal clusters within their fields, consistent with the number of cone pedicles now residing within these larger fields (figure 7). While cell-intrinsic instructions may command the general morphology of the horizontal cell, both its dendritic field size and terminal branching pattern are shown here to be regulated by cellular interactions in the local environment, specifically, with their homotypic neighbors and their afferents, respectively.
Figure 7.

Summary diagram showing the effects of reducing the frequency of homotypic neighbors in Lim1 conditional knockout mice upon the intercellular spacing, dendritic field size and afferent connectivity of horizontal cells. Only a single horizontal cell is filled to show more clearly the difference in dendritic morphology within the OPL between the control and depleted conditions (specifically, the size of the dendritic field and number of terminal clusters). Also depicted is the increase in minimal spacing between neighboring horizontal cells in the depleted condition.
Acknowledgments
This work was supported by grants from the NIH (R01 EY011087 to B.E.R; R32 EY07102 to R.A.P; R01 EY013128 to Y.F.) and the Ben F. Love Endowment (to R.R.B.). We thank Hadi Nassar, Mahdi Diab and Natasha Gallo for technical assistance, and Connie Cepko for the Chx10-Cre mice.
Abbreviations
- CKO
conditional knock-out
- ER
effective radius
- INL
inner nuclear layer
- IPL
inner plexiform layer
- OPL
outer plexiform layer
- RI
regularity index
References
- Ajioka I, Martins RAP, Bayazitov IT, Donovan S, Johnson DA, Frase S, Cicero SA, Boyd K, Zakharenko SS, Dyer MA. Differentiated horizontal interneurons clonally expand to form metastatic retinoblastoma in mice. Cell. 2007;131:378–390. doi: 10.1016/j.cell.2007.09.036. [DOI] [PMC free article] [PubMed] [Google Scholar]
- Claes E, Seeliger M, Michalakis S, Biel M, Humphries P, Haverkamp S. Morphological characterization of the retina of the CNGA3B/BRhoB/B mutant mouse lacking functional cones and rods. Investigative Ophthalmology and Visual Science. 2004;45:2039–2048. doi: 10.1167/iovs.03-0741. [DOI] [PubMed] [Google Scholar]
- Cook JE. Spatial properties of retinal mosaics: An empirical evaluation of some existing measures. Visual Neuroscience. 1996;13:15–30. doi: 10.1017/s0952523800007094. [DOI] [PubMed] [Google Scholar]
- Edqvist PH, Hallbook F. Newborn horizontal cells migrate bi-directionally across the neuroepithelium during retinal development. Development. 2004;131:1343–1351. doi: 10.1242/dev.01018. [DOI] [PubMed] [Google Scholar]
- Farajian R, Raven MA, Cusato K, Reese BE. Cellular positioning and dendritic field size of cholinergic amacrine cells are impervious to early ablation of neighboring cells in the mouse retina. Visual Neuroscience. 2004;21:13–22. doi: 10.1017/s0952523804041021. [DOI] [PubMed] [Google Scholar]
- Fariss RN, Li ZY, Milam AH. Abnormalities in rod photoreceptors, amacrine cells, and horizontal cells in human retinas with retinitis pigmentosa. Am J Ophthalmol. 2000;129:215–223. doi: 10.1016/s0002-9394(99)00401-8. [DOI] [PubMed] [Google Scholar]
- Furuta Y, Lagutin O, Hogan BLM, Oliver GO. Retina- and ventral forebrain-specific Cre recombinase activity in transgenic mice. Genesis. 2000;26:130–132. [PubMed] [Google Scholar]
- Godinho L, Williams PR, Claassen Y, Provost E, Leach SD, Kamermans M, Wong ROL. Nonapical symmetric divisions underlie horizontal cell layer formation in the developing retina in vivo. Neuron. 2007;56:597–603. doi: 10.1016/j.neuron.2007.09.036. [DOI] [PubMed] [Google Scholar]
- Hinds JW, Hinds PL. Differentiation of photoreceptors and horizontal cells in the embryonic mouse retina: An electron microscopic, serial section analysis. Journal of Comparative Neurology. 1979;187:495–512. doi: 10.1002/cne.901870303. [DOI] [PubMed] [Google Scholar]
- Kwan KM, Behringer RR. Conditional inactivation of Lim1 function. Genesis. 2002;32:118–120. doi: 10.1002/gene.10074. [DOI] [PubMed] [Google Scholar]
- Lewis GP, Linberg KA, Fisher SK. Neurite outgrowth from bipolar and horizontal cells after experimental retinal detachment. Investigative Ophthalmology and Visual Science. 1998;39:424–434. [PubMed] [Google Scholar]
- Lin B, Wang SW, Masland RH. Retinal ganglion cell type, size, and spacing can be specified independent of homotypic dendritic contacts. Neuron. 2004;43:475–485. doi: 10.1016/j.neuron.2004.08.002. [DOI] [PubMed] [Google Scholar]
- Liu W, Wang JH, Xiang M. Specific expression of the LIM/Homeodomain protein Lim-1 in horizontal cells during retinogenesis. Developmental Dynamics. 2000;217:320–325. doi: 10.1002/(SICI)1097-0177(200003)217:3<320::AID-DVDY10>3.0.CO;2-F. [DOI] [PubMed] [Google Scholar]
- Poché RA, Kwan KM, Raven MA, Furuta Y, Reese BE, Behringer RR. Lim1 is essential for the correct laminar positioning of retinal horizontal cells. J Neurosci. 2007;27:14099–14107. doi: 10.1523/JNEUROSCI.4046-07.2007. [DOI] [PMC free article] [PubMed] [Google Scholar]
- Raven MA, Oh ECT, Swaroop A, Reese BE. Afferent control of horizontal cell morphology revealed by genetic re-specification of rods and cones. J Neurosci. 2007;27:3540–3547. doi: 10.1523/JNEUROSCI.0372-07.2007. [DOI] [PMC free article] [PubMed] [Google Scholar]
- Raven MA, Reese BE. Mosaic regularity of horizontal cells in the mouse retina is independent of cone photoreceptor innervation. Investigative Ophthalmology and Visual Science. 2003;44:965–973. doi: 10.1167/iovs.02-0831. [DOI] [PubMed] [Google Scholar]
- Raven MA, Stagg SB, Nassar H, Reese BE. Developmental improvement in the regularity and packing of mouse horizontal cells: Implications for mechanisms underlying mosaic pattern formation. Visual Neuroscience. 2005b;22:569–573. doi: 10.1017/S095252380522504X. [DOI] [PubMed] [Google Scholar]
- Raven MA, Stagg SB, Reese BE. Regularity and packing of the horizontal cell mosaic in different strains of mice. Visual Neuroscience. 2005a;22:461–468. doi: 10.1017/S0952523805224070. [DOI] [PubMed] [Google Scholar]
- Reese BE, Harvey AR, Tan SS. Radial and tangential dispersion patterns in the mouse retina are cell-class specific. Proc Natl Acad Sci. 1995;92:2494–2498. doi: 10.1073/pnas.92.7.2494. [DOI] [PMC free article] [PubMed] [Google Scholar]
- Reese BE, Necessary BD, Tam PPL, Faulkner-Jones B, Tan SS. Clonal expansion and cell dispersion in the developing mouse retina. Eur J Neurosci. 1999;11:2965–2978. doi: 10.1046/j.1460-9568.1999.00712.x. [DOI] [PubMed] [Google Scholar]
- Reese BE, Raven MA, Stagg SB. Afferents and homotypic neighbors regulate horizontal cell morphology, connectivity and retinal coverage. J Neurosci. 2005;25:2167–2175. doi: 10.1523/JNEUROSCI.4876-04.2005. [DOI] [PMC free article] [PubMed] [Google Scholar]
- Rodieck RW. The density recovery profile: A method for the analysis of points in the plane applicable to retinal studies. Visual Neuroscience. 1991;6:95–111. doi: 10.1017/s095252380001049x. [DOI] [PubMed] [Google Scholar]
- Rowan S, Cepko CL. Genetic analysis of the homeodomain transcription factor Chx10 in the retina using a novel multifunctional BAC transgenic mouse reporter. Developmental Biology. 2004;271:388B402. doi: 10.1016/j.ydbio.2004.03.039. [DOI] [PubMed] [Google Scholar]
- Sandmann D, Boycott BB, Peichl L. Blue-cone horizontal cells in the retinae of horses and other Equidae. J Neurosci. 1996;16:3381–3396. doi: 10.1523/JNEUROSCI.16-10-03381.1996. [DOI] [PMC free article] [PubMed] [Google Scholar]
- Strettoi E, Pignatelli V. Modifications of retinal neurons in a mouse model of retinitis pigmentosa. Proc Nat’l Acad Sci USA. 2000;97:11021–11025. doi: 10.1073/pnas.190291097. [DOI] [PMC free article] [PubMed] [Google Scholar]
- Tanabe K, Takahashi Y, Sato Y, Kawakami K, Takeichi M, Nakagawa S. Cadherin is required for dendritic morphogenesis and synaptic terminal organization of retinal horizontal cells. Development. 2006;133:4085–4096. doi: 10.1242/dev.02566. [DOI] [PubMed] [Google Scholar]
- Turner DL, Snyder EY, Cepko CL. Lineage-independent determination of cell type in the embryonic mouse retina. Neuron. 1990;4:833–845. doi: 10.1016/0896-6273(90)90136-4. [DOI] [PubMed] [Google Scholar]
- Wässle H, Peichl L, Boycott BB. Topography of horizontal cells in the retina of the domestic cat. Proc R Soc B (Lond) 1978;203:269–291. doi: 10.1098/rspb.1978.0105. [DOI] [PubMed] [Google Scholar]
- Zimmerman RP, Polley EH, Fortney RL. Cell birthdays and rate of differentiation of ganglion and horizontal cells of the developing cat’s retina. Journal of Comparative Neurology. 1988;274:77–90. doi: 10.1002/cne.902740108. [DOI] [PubMed] [Google Scholar]