

Abstract
Genome-wide identification of bona-fide targets of transcription factors in mammalian cells is still a challenge. We present a novel integrated computational and experimental approach to identify direct targets of a transcription factor. This consists of measuring time-course (dynamic) gene expression profiles upon perturbation of the transcription factor under study, and in applying a novel “reverse-engineering” algorithm (TSNI) to rank genes according to their probability of being direct targets. Using primary keratinocytes as a model system, we identified novel transcriptional target genes of TRP63, a crucial regulator of skin development. TSNI-predicted TRP63 target genes were validated by Trp63 knockdown and by ChIP-chip to identify TRP63-bound regions in vivo. Our study revealed that short sampling times, in the order of minutes, are needed to capture the dynamics of gene expression in mammalian cells. We show that TRP63 transiently regulates a subset of its direct targets, thus highlighting the importance of considering temporal dynamics when identifying transcriptional targets. Using this approach, we uncovered a previously unsuspected transient regulation of the AP-1 complex by TRP63 through direct regulation of a subset of AP-1 components. The integrated experimental and computational approach described here is readily applicable to other transcription factors in mammalian systems and is complementary to genome-wide identification of transcription-factor binding sites.
Identification of transcriptional networks can be achieved by computational analysis of gene expression profiles, known as reverse-engineering (Gardner et al. 2003; di Bernardo et al. 2005; Bansal et al. 2007). Reverse-engineering requires measurements of changes in RNA levels in response to cell perturbations. Application of reverse-engineering to mammalian cells has been hampered by the complexity of mammalian genomes. Basso and coworkers reported the application of a novel reverse-engineering approach (ARACNe) to identify regulatory networks in human B cells (Basso et al. 2005). Gene expression profiles were measured at steady-state, long after the perturbation event, under several experimental conditions (∼500). The large number of gene expression profiles required and the choice of appropriate perturbation experiments may limit the use of this approach to specific biological questions.
Alternatively, reverse-engineering using dynamic gene expression profiles, measured soon after the perturbation event, has the advantage of requiring a single perturbation experiment, fewer measurements, and the potential for identifying transient regulations that may be missed by steady-state approaches. Available methods, such as the Dynamic Bayesian network, work well for a small number of genes, but fail on large networks (hundreds of genes), as do other reverse-engineering techniques designed to recover the whole network from time-series data (Hartemink 2005; van Someren et al. 2005), due to the limited information contained in a single perturbation experiment.
In the present work, we specifically designed and applied a novel reverse-engineering algorithm (TSNI: Time Series Network Identification) to recover only the direct targets of the transcription factor TRP63 (formerly known as p63), rather than the whole gene network, building on our previous work in prokaryotes (Bansal et al. 2006; see Supplemental material for more details). TSNI is based on relating the rate of change in gene expression of each gene to the variation of all of the other genes in the cell, and to an external perturbation, i.e., the inducible activation of the transcription factor TRP63.
Trp63 belongs to the Trp53 gene family of transcription factors, and is required for the morphogenesis and maintenance of all stratified epithelia, as evident by the phenotype of Trp63-null mice (Mills et al. 1999; Yang et al. 1999). The transcription factor TRP63 has been involved in many cellular processes, including maintenance of the proliferative potential of progenitor cells (Pellegrini et al. 2001; Senoo et al. 2007). In addition, TRP63 is required for epidermal stratification (Koster et al. 2004; Truong et al. 2006), while suppressing terminal differentiation by inhibition of a subset of differentiation associated genes (King et al. 2003; Nguyen et al. 2006). The complexity of the transcription regulation mediated by TRP63, is just starting to be elucidated.
We identified a large set of direct and functional TRP63 target genes by applying TSNI to dynamic gene expression profiles following TRP63 activation in primary keratinocytes (Fig. 1A). Validation of the TRP63 target genes identified by TSNI was achieved by Trp63 knockdown and by ChIP-chip analysis, confirming the validity of our approach. Our analysis revealed a highly dynamic response to TRP63 activation and a previously uncovered direct and transient repression of the AP-1 complex by TRP63.
Figure 1.

(A) Experimental and computational approach for the identification of TRP63 target genes. ΔNp63α was fused to a modified estrogen receptor domain (ERΔNp63α) and expressed in primary mouse keratinocytes by retroviral infection. Upon treatment with estrogen agonist tamoxifen, total RNA was collected at 10-min intervals for the first hour, and then at 20-min intervals until 4 h. Dynamic gene expression data were filtered by the TSNI algorithm to yield a ranked list of predicted direct TRP63 target genes. Validation was performed by analyzing global gene expression data upon Trp63 knockdown and by ChIP-chip analysis using TRP63 specific antibodies. (B) Expression profiles of a ΔNp63α responsive gene following its activation. Y-axis shows mRNA levels in the ERΔNp63α expressing keratinocytes treated with tamoxifen versus untreated ones expressed as log2 ratio (i.e., +1 corresponds to a twofold increase with respect to the 0 time point [untreated], −1 to a twofold decrease). Gene expression data were clustered using a Hierarchical Clustering approach with correlation metric and average linkage to generate the hierarchical tree. The number of clusters was set to 5. (C) Transcripts in Clusters 2 and 4 were classified using a functional annotation enrichment analysis (see Supplemental Table 3). The biological categories are as indicated in the pie charts, and the number of transcripts for each category is indicated in parenthesis.
Results
Validation of TSNI algorithm on an in silico network
TSNI is based on ordinary differential equations, where the observed changes in a transcript concentration are assumed proportional to the concentration of other transcripts in the cell, and to the inducible activation of the transcription factor, according to unknown coefficients. These coefficients can be estimated from the dynamic gene expression profiles by solving a linear regression problem (Methods and Supplemental material) where the current concentration of a gene is assumed proportional to the concentrations of other genes at the previous time, and to the current activity of the transcription factor. TSNI thus assumes that the observed changes in gene expression can be caused either directly by the activation of the transcription factor, or indirectly by other genes in the network. TSNI identifies direct targets as those genes whose expression changes following the transcription factor activation can be better accounted for if it is assumed that a direct interaction exists.
We tested TSNI on an in silico data set consisting of simulated gene expression of 1000 genes at 20 different time-points following a simulated overexpression of one of the genes in the network. We added noise of different intensities to the simulated gene expression profiles and applied TSNI to the data. In the in silico data set, TSNI was able to identify the direct targets of the perturbation with close to 70% precision (Supplemental Fig. 1). These data suggest that TSNI can be applied to identify direct target genes in complex systems such as mammalian cells.
Dynamic gene expression profiles following Trp63 induction in primary mouse keratinocytes
Trp63 encodes for at least six alternative transcripts, displaying a differential tissue distribution; three of the transcripts have a transactivation domain (α, β, and γ TA isoforms), while the other three lack the TA domain (α, β, and γ ΔN isoforms) (Yang et al. 1998). ΔNp63α is the predominant isoform detectable in primary mouse keratinocytes, grown under conditions that closely mimic the basal layer of the epidermis. To identify ΔNp63α direct targets, we rendered the ΔNp63α protein functionally responsive to tamoxifen by fusion with the modified hormone-binding domain of the oestrogen receptor (ER) (Littlewood et al. 1995). A fusion protein with the ER domain at the amino terminus (ERΔNp63α) was inactive in the absence of tamoxifen, whereas it was active to a similar extent of the wild-type TRP63 protein in the presence of tamoxifen (Supplemental Fig. 2). In contrast, a fusion protein with the oestrogen receptor at the carboxyl terminus (ΔNp63αER) was a poor activator even in the presence of tamoxifen, and thus was not used further.
Primary mouse keratinocytes were infected with a retrovirus carrying the inducible ERΔNp63α fusion protein and subsequently treated with tamoxifen to induce activation of the exogenous gene. A quasi-linear accumulation of activated ERΔNp63α in the nuclei was observed for 4 h following tamoxifen treatment (Supplemental Fig. 3). We then measured global gene expression profiles at 10-min intervals for the first hour and at 20-min intervals until 4 h upon tamoxifen treatment in ERΔNp63α expressing keratinocytes. A total of 786 transcripts, corresponding to 639 unique genes, responded significantly (FDR corrected P-value ≤ 0.1) to tamoxifen induction (Supplemental Table 1). Of the 786 induced transcripts, 342 (44%) were up-regulated, and 444 (56%) were down-regulated. A total of 44 (6%) transcripts responded also to tamoxifen treatment alone, as determined by a control time-series experiment using mock-infected keratinocytes treated with tamoxifen (Supplemental Table 2). The timing of gene response, measured as the time point at which gene expression differed from its untreated level (0 h), ranged between 20 and 120 min (Supplemental Table 1).
We performed a preliminary analysis consisting of hierarchical clustering of the expression profiles (Eisen et al. 1998) (Fig. 1B). For each cluster, we performed gene functional annotation enrichment analysis (Dennis et al. 2003) (Fig. 1C; Supplemental Table 3). More than 95% of the transcripts were divided into two large clusters (Cluster 2 and Cluster 4). Clusters 1, 3, and 5 had much fewer elements and no significant annotation (Supplemental Table 3).
Cluster 2 included 340 positively regulated transcripts and was highly enriched for genes involved in DNA replication (P = 1.6 × 10⁻¹⁷), mitosis (P = 1.7 × 10⁻¹⁰), cell cycle progression (P = 6.4 × 10⁻¹¹), and to a lesser extent, cellular metabolism (P = 1.4 × 10⁻⁴), as shown in Figure 1C. Consistent with this observation, a positive effect on cell proliferation has been previously reported in human keratinocytes (Sbisa et al. 2006; Truong et al. 2006) and in zebrafish epidermis (Lee and Kimelman 2002).
Cluster 4 comprised 410 down-regulated transcripts, including genes involved in cell differentiation (P = 6 × 10⁻⁶) and epidermal development (P = 3.5 × 10⁻⁵). In addition, Cluster 4 included genes encoding for negative regulators of cell cycle progression (P = 2.4 × 10⁻⁴) (Fig. 1C). Thus, clustering and functional annotation of genes responding to ΔNp63α activation at early times are consistent with a role of ΔNp63α in sustaining cell proliferation and inhibiting keratinocyte differentiation. However, expression profiling and hierarchical clustering do not provide clear criteria to distinguish genes directly regulated by ΔNp63α from secondary responders.
Application of TSNI to dynamic gene expression profiles to identify direct TRP63 targets
To identify TRP63 transcriptional targets, we applied TSNI to the gene expression profiles. TSNI ranked the 786 transcripts according to their probability of being ΔNp63α direct transcriptional targets, and assigned a score and a P-value to each transcript (Methods; Supplemental material). By selecting a threshold of P ≤ 0.1, TSNI identified 100 transcripts of 786 as direct targets of TRP63; 33 of these were up-regulated and 67 down-regulated by ΔNp63α (Supplemental Table 1).
The most represented gene category in the TSNI-predicted TRP63 direct targets was cell differentiation (P = 8.3 × 10⁻⁵) (Supplemental Table 1), and included genes encoding for various members of the Small proline rich (Sprr2j, Sprr2f, Sprr2i) and Small proline rich-like proteins (also known as Late-cornified envelope) (Sprrl9, Sprrl2), Corneodesmosin (Cdsn), Sciellin (Scel), and Claudin 1 (Cldn1). Putative regulators of cell differentiation such as the transcription factors Mxd1 (Mad) (Vastrik et al. 1995) and Elf3 (Oettgen et al. 1997) were also predicted direct targets. Among the other transcription factors predicted by TSNI were Bhlhb2, Elk3, Tcf19, and Cdca7l, Egr1, Klf6, and the AP-1 complex components Fos, Fosl1, and Maff.
Validation of TSNI-predicted direct targets of TRP63
To validate the TRP63 target genes identified by ERΔNp63α activation, we first knocked-down Trp63 in primary mouse keratinocytes by transient transfection with Trp63-specific small interfering RNA oligonucleotides (siRNA) (Antonini et al. 2006). The efficiency of Trp63 knockdown was confirmed by real-time PCR and immunoblotting (Supplemental Fig. 4). We measured global changes in gene expression by microarray analysis following Trp63 knockdown 48 h after siRNA transfection. A total of 719 transcripts responded significantly to Trp63 siRNA treatment (posterior probability distribution estimate [PPDE] ≥ 99.99%), increasing to 1920 transcripts using a less stringent threshold (PPDE ≥ 99.00%) (Supplemental Table 4). Of the 786 transcripts regulated by ERΔNp63α activation, 129 responded significantly to Trp63 knockdown (298 when using the less stringent threshold). Genes that do not respond to Trp63 knockdown may include transiently regulated direct targets, since RNA changes are measured at 48 h following siRNA transfection (steady-state measurement).
We performed gene set enrichment analysis (GSEA) (Subramanian et al. 2005) to check whether the set of the 100 top ranked genes was enriched for genes responding significantly to TRP63 knockdown (Supplemental Fig. 5). GSEA yielded a P-value of 0.00 (with an enrichment score of 0.70) for the 100 top ranked transcripts, whereas no enrichment was found at a P < 0.01 for the 200 bottom ranked transcripts (see Supplemental material for details). Figure 2 shows that the 100 top ranked transcripts by TSNI changed significantly more following Trp63 knockdown as compared with the lower ranked transcripts (P = 1 × 10⁻⁴). Together, these data indicate that, on average, putative direct Trp63 target genes identified by TSNI are functional and respond more significantly than other genes to Trp63 knockdown.
Figure 2.

TSNI-predicted TRP63 target genes are enriched for genes responding to Trp63 knockdown. (A) Transcripts were grouped in bins containing 100 transcripts each and indicated on the X-axis (e.g., “1-100” corresponds to the first bin containing genes ranked by TSNI between position 1 and 100). The average fold change in response to Trp63 knockdown of each group of 100 transcripts is computed. Fold change is shown as log2 values. The top 100 TSNI ranked genes changed significantly more (P = 1 × 10⁻⁴) than a group of 100 transcripts picked at random. (B) Number of genes responding to Trp63 knockdown (siRNA) for each group of 100 transcripts. The top 100 TSNI ranked transcripts contain significantly more (P = 0.0001) transcripts that respond to Trp63 knockdown than a group of 100 transcripts picked at random.
To unambiguously identify direct targets and thus validate TSNI predictions, we performed ChIP-chip experiments (chromatin immunoprecipitation, followed by array hybridization) in primary mouse keratinocytes under basal conditions using anti-TRP63 polyclonal antibodies. Immunoprecipitated DNA was amplified and hybridized to a custom high-density oligonucleotide array covering the genomic sequence, plus 20 kb upstream of the transcription start site (TSS) of each gene ranked in the top 100 positions by TSNI. As a control, we included the genomic sequences of genes ranked in the bottom 200 positions by TSNI among the 786 transcripts (i.e., positions 587–786). The array also included the sequence of 22 genes of interest selected among the 786 transcripts (Supplemental Table 5), plus three positive control regions of 20 kb, centered on known TRP63 binding sites in the Mdm2 (Flores et al. 2002), Hes1 (Nguyen et al. 2006), and Perp (Ihrie et al. 2005) genes, as well as the genomic sequence of ΔNp63α plus 20 kb upstream of TSS, known to contain a well-characterized TRP63 binding site (Antonini et al. 2006) (Supplemental Table 5).
We identified 292 TRP63-bound regions, associated to 145 genes (Supplemental Table 6). All of the positive control TRP63-binding sites were correctly identified. ChIP, followed by real-time PCR, estimated a false discovery rate of 0.12 (i.e., 12%) (Supplemental Fig. 6). A total of 129 of the 292 TRP63-bound regions were associated with genes ranked by TSNI in the 100 top ranked transcripts; in contrast, 75 and 71 TRP63-bound regions were associated with genes ranked by TSNI, respectively, in the transcripts ranked between 587 and 686 and 687 and 786.
To check whether TSNI was ranking genes according to their probability of being direct targets, we associated with each gene a binding score (BS). The BS summarizes both the strength and the number of TRP63-bound regions for each gene (Yang et al. 2006). BS is 0 when no binding region is present in the genomic region taken into consideration, and it is equal to the sum of the negative logs of the P-value of each TRP63-bound region, if one or more TRP63-bound regions are present. The top 100 TSNI-ranked transcripts (corresponding to 91 genes) are significantly enriched for the strongest binding sites, as measured by the average BS (BS = 25.58 ± 5.48 SEM with P = 0.02) (Fig. 3).
Figure 3.

TSNI enriches for TRP63 direct targets. Average TRP63 binding score (BS) of genes associated to the top 100 TSNI-ranked transcripts and to the bottom 200 TSNI ranked transcripts (from rank 587 to rank 786) included on the array as controls. FC is the average BS obtained by ranking genes according to their fold changes following TRP63 induction; Early_genes is obtained by ranking genes according to their time of change upon ΔNp63α activation. siRNA is obtained by ranking genes according to their differential expression following Trp63 knockdown. (Dashed line) Central value of BS for a random selection of 100 genes. Significance is computed as compared with the average BS of a set of 100 transcripts picked at random. *P = 0.02.
By ranking transcripts simply according to the greatest fold-change following ΔNp63α activation (FC in Fig. 3), the estimated average binding score was BS = 10.22 ± 1.98 SEM, with no enrichment compared with random (Supplemental material). By ranking genes according to their timing following ΔNp63α activation (Early_genes in Fig. 3 with a BS = 16.94 ± 2.49 SEM) or to their fold-change following Trp63 knockdown (siRNA in Fig. 3 with a BS = 19.40 ± 3.42 SEM) the resulting BS were still not better than random. Thus, by taking into account the gene network, the TSNI algorithm enriches for direct targets more efficiently than simply selecting genes with the highest FC, or considering immediate early genes.
Figure 4 details the top 100 TSNI-ranked transcripts predicted to be direct targets of ΔNp63α, corresponding to 91 unique genes, of which 53 have a confirmed ChIP-chip TRP63-bound region. Thus, the estimated accuracy of TSNI is 58% (= 100 × 53/91), in agreement with the in silico performance of TSNI (Supplemental Fig. 1).
Figure 4.

TSNI-predicted TRP63 target genes. There are 91 unique genes in the figure corresponding to the top 100 TSNI ranked transcripts. A total of 53 of 91 genes have been validated by our ChIP-chip experiment. Color represents gene ontology classification (yellow, cell differentiation and development; red, metabolism; white, others). Squares represent genes confirmed by ChIP-chip experiment described in this study.
We found TRP63-bound regions by ChIP-chip also among the bottom TSNI-ranked transcripts that we used as controls (Supplemental Table 1), but their average Binding Score was lower (BS = 17 for transcripts ranked from 587 to 686 and BS = 15 for transcripts ranked from 687 to 786) (Fig. 3), and they responded more weakly to Trp63 knockdown (Fig. 2).
Characterization of TRP63-bound regions
The location of the TRP63-bound regions relative to gene position is summarized in Figure 5A. About half of the binding sites (53%) were found within a 20-kb window centered on the transcription start site (from −10 Kb to +10 Kb).
Figure 5.

TRP63-bound regions detected by ChIP-chip. (A) Distribution of TRP63-bound regions relative to the TSS of each gene. Each bar corresponds to −5 Kb/+5 Kb from the indicated position. The average length of each region was 952 ± 318 bp. (B) De novo motif identified by MEME algorithm (Bailey and Elkan 1994) in the 292 TRP63-bound regions.
We applied de novo motif-finding algorithm MEME (Bailey and Elkan 1994) to the 292 TRP53-bound regions to search for over-represented motifs. The most significant motif found (E-score = 4 × 10⁻³⁴) was composed of two direct repeats, with each half-site similar to the TRP53-decamer motif (Fig. 5B). This motif is consistent with the previously identified consensus in a genome-wide ChIP-chip experiment in human cancer cells (Yang et al. 2006), and further supports the notion that TRP63 binds in vivo to a TRP53-like consensus sequence. We also searched the TRP63-bound regions for the 354 known binding motifs in the TRANSFAC 10.1 database (Kel et al. 2003), using a search algorithm developed by King and Roth (2003). As expected, the most represented binding site in the TRP63-bound regions is the TRP53-binding motif (see Supplemental Table 7), followed by the AP-1 motif and the Ets motif. The latter motif was also previously identified in a TRP63-bound region in a genome-wide ChIP-chip experiment in human cancer cells (Yang et al. 2006). Interestingly, AP-1 complex components, such as Fos, Fosl1, and Maff, and members of the Ets transcription factor family, such as Elf3 and Elk3, were predicted to be TRP63 direct targets according to TSNI, suggesting a possible coordinated regulation of some targets by this set of transcription factors. All of these genes, except for Maff, had a confirmed TRP63 binding site according to our ChIP-chip experiment (Supplemental Table 1).
TRP63 transiently regulates the AP-1 complex
The partial overlap between genes responding to TRP63 activation at early time points and genes responding to Trp63 knockdown at 48 h, suggests that some of the genes responding to TRP63 activation may be transiently regulated direct targets. In order to verify transient regulation experimentally, we focused on the genes of the AP-1 complex, predicted by TSNI to be direct targets, associated with TRP63-bound regions according to the ChIP-chip experiment, but with a lack of response to the Trp63 knockdown experiment at 48 h (Supplemental Tables 1, 4).
The transcription complex AP-1 is a key regulator of a number of cellular processes in the skin (Zenz and Wagner 2006). ΔNp63α activation repressed transcription of various genes encoding for AP-1 components including Fos, Fosl1, and Jun (Fig. 6A). In addition, ΔNp63α negatively regulated Maff, Atf3, Atf5, and Atf6, as well as genes specifically involved in the Jnk/p38–AP-1 pathway, such as the dual-specificity phosphatases (Dusp) Dusp1 and Dusp10 (Supplemental Table 1).
Figure 6.

TRP63 directly regulates AP-1 encoding genes. (A) Expression profiles of AP-1 family members following tamoxifen-induced ERΔNp63α activation in primary keratinocytes. Data for Fosl1 and Jun are the average of two different probes on the microarray (see Supplemental Table 1 for profiles of individual probes). The experiment was performed as described in Figure 2. (B) Specific binding of endogenous TRP63 to Fos, Jun, and Fosl1 promoters. Primary mouse keratinocytes were processed for ChIP with antibodies specific for TRP63 (Ab-TRP63) or unrelated anti-Erk antibodies as control (Ab-GFP), followed by real-time PCR amplification on the promoter sequences indicated in D. Unprecipitated chromatin preparations were similarly analyzed and used as “input” control. The amount of precipitated DNA was calculated relative to the total input chromatin, and expressed as the percentage of the total (Frank et al. 2001). (C) Hela cells were cotransfected with plasmids encoding ΔNp63α, or an empty control vector, together with the luciferase reporter plasmids, Fosl1-Luc, and pAP-1-Luc, carrying multiple copies of the AP-1-Responsive Element. Cells were collected at 12, 24, and 48 h after transfection. Luciferase activity is expressed relative to the empty control vector. Renilla reporter was used for internal normalization. The experiment was repeated twice with similar results. (D) TRP63 binding sites on the Fos, Jun, and Fosl1 promoter regions. The predicted TRP63-binding site is indicated, together with its precise nucleotide sequence: bold nucleotides correspond to the core nucleotide sequence required for TRP63-binding, while underlined nucleotides are matches in the consensus.
Endogenous TRP63 directly bound to upstream regions of Fos, Jun, and Fosl1 as observed by ChIP-chip analysis (Supplemental Table 5). Each of these regions contained a predictive TRP63 binding site, located, respectively, 4.4 kb upstream of Fos, 5.2 kb upstream of Jun, and 1 kb upstream of the Fosl1 (Fig. 6D). TRP63 direct binding to these regions was further validated by ChIP, followed by real-time PCR (Fig. 6B).
To verify that TRP63 transiently affects AP-1 activity, we tested the ability of ΔNp63α to regulate an AP-1 responsive promoter and the Fosl1 promoter containing the TRP63 binding site at different times after transfection (12, 24, and 48 h) (Fig. 6C). ΔNp63α repressed both the AP-1 responsive promoter and the Fosl1 promoter at 12 and 24 h, whereas repression was lost at 48 h, consistent with the ability of TRP63 to transiently regulate the transcription of AP-1 complex components.
Discussion
We presented here an integrated experimental and computational approach to infer direct transcriptional targets of a transcription factor from dynamic gene expression profiles. We show that dynamic expression profiles can be used to elucidate the function of a transcription factor and to infer its direct targets, even if these are only transiently regulated.
ΔNp63α activation results in induction of genes encoding for cell cycle regulators. Conversely, Trp63 knockdown inhibits most of these regulatory genes. However, according to the TSNI ranking, TRP63 induces cell cycle regulators indirectly. This conclusion is supported by the observation that none of the eight cell cycle genes analyzed by ChIP-chip (Supplemental Table 5) was associated with a TRP63-bound region. In contrast, as predicted by TSNI and validated experimentally, ΔNp63α directly suppresses a subset of genes encoding for late differentiation markers, indicating that ΔNp63α has a previously uncovered direct influence on cell differentiation.
By applying TSNI to dynamic gene expression data following TRP63 activation, we were able to identify at least 53 direct and functional targets, including 39 novel targets. Of these 53 targets, only 15 respond to RNAi at 48 h (Supplemental Table 1), suggesting that TRP63 may transiently regulate a large number of its direct targets. This may be true of other mammalian transcription factors, pointing to the importance of performing dynamic gene expression experiments at short sampling times.
Among the transiently regulated targets, we found genes encoding for the AP-1 complex. We demonstrate a role of TRP63 in transiently regulating AP-1 activity, which has not been previously suggested. We found that ΔNp63α directly inhibits the expression of Fos, Fosl1, and Jun by binding to their promoter regions, as predicted by TSNI, and transiently suppresses AP-1 transcriptional activity.
The TSNI algorithm does not rely on the timing of gene expression, since, as we show in this study, immediate early genes are not necessarily direct targets; rather, it takes into account the behavior of all of the genes responding to TRP63 activation and the measured transcription factor activation profile to correctly infer direct targets. By considering the effect of all of the genes in the network, TSNI accounts for complex transcriptional regulation mechanisms, such as feedback (or feed-forward) regulation, known to affect the timing of gene expression (Amit et al. 2007). Our approach has some intrinsic limitations, as a number of genes requiring basal Trp63 expression may not be significantly affected by TRP63 overexpression. Recently, another approach has been proposed for direct target identification, but it requires prior information on a subset of target genes, it does not take into account the effect of other genes, and was not extensively validated (Barenco et al. 2006). An integrative approach to infer a transcriptional network using both ChIP-chip and steady-state expression data in wild-type and knockout cells has been applied to investigate a DNA damage response network in yeast (Workman et al. 2006). The extension of this approach to primary cells could be very useful, but it would require a significantly more complex experimental set up. In addition, it would be complementary to our method, since it would not capture the dynamics of transcriptional regulation.
TSNI has an estimated precision of about 60%. A higher precision could be achieved with a more accurate measurement of the transcription factor activation kinetics and a more excitatory perturbation (for example by both activating and deactivating the transcription factor in the same time-course experiment). Our approach is complementary to other experimental techniques such as ChIP-chip, and can provide increased confidence in highly noisy protein–DNA-binding data sets. According to a recent genome-wide identification of TRP63 binding sites performed in human cancer cells, only a small fraction (10%–20%) of TRP63-bound regions in the human genome was functional, as assessed by Trp63 knockdown (Yang et al. 2006). ChIP coupled with CpG island and promoter arrays has also been used to identify TRP63 direct targets in a human keratinocyte cell line (Vigano et al. 2006). In the same cell line, however, little overlapping was found between targets identified by ChIP-chip and genes affected by Trp63 knockdown (Testoni et al. 2006). These results suggest that only a subset of the TRP63-bound regions is functional, and, as we show, a large number of direct targets are transiently regulated by TRP63.
With our approach, we found that short sampling times, in the order of minutes, are needed to capture the dynamics of gene expression in mammalian cells. Direct and functional targets can be transiently activated by TRP63, and experiments that do not take into account temporal dynamics may fail to identify such targets. Our proposed approach is complementary to genome-wide ChIP-chip, which requires the availability of specific antibodies and is unable to distinguish between functional and nonfunctional target sequences, or between transient and nontransient direct targets. The integrated experimental and computational approach described here is readily applicable to other transcription factors in mammalian systems.
Methods
TSNI algorithm
We use a system of ordinary differential equations (de Jong 2002) to represent the rate of synthesis of a transcript as a function of the concentrations of every other transcript in a cell and the external perturbation:
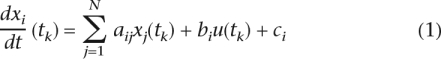 |
where i = 1...N; k = 1...M; xi(tk)is a measured concentration of transcript i measured at time tk; xi(tk) is the measured rate of change of concentration of gene transcript i at time tk, i.e., the first derivative of the mRNA concentration of gene i measured at time tk; aij represents the unknown influence of gene j on gene i with a positive, zero, or negative sign indicating activation, no interaction, and repression, respectively; bi represents the unknown effect of the activation of TRP63 on xi; u(tk) represents the measured activation of TRP63 at time tk; and ci represents the effect of tamoxifen and other external factors, which are not intrinsic to the network, on xi.
TSNI solves the above set of equations for the unknown coefficients aij and bi. The predicted targets of TRP63 are those genes with a large absolute value of bi. We converted Equation 1 into its discrete time form and preprocessed each expression profile by applying a smoothing filter. Smoothed profiles were then interpolated using piecewise cubic spline interpolation to increase the number of data-points. The discrete form of Equation 1 is:
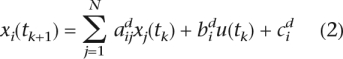 |
After interpolation, we solve the linear regression problem in Equation 2 for each gene by applying standard principle component analysis (PCA) linear regression to the data set (Montgomery et al. 2001). PCA linear regression enables us to reduce the dimensionality, thus decreasing the number of unknown parameters (Montgomery et al. 2001; Bansal et al. 2006; see Supplemental material for more details).
Cell cultures, retroviruses, and transfections
Primary mouse keratinocytes were isolated from 2-d-old Swiss CD1 mice and cultured under low calcium conditions (0.05 mm) in the presence of 4% Ca2+-chelated fetal bovine serum (Invitrogen) and EGF (BD Bioscience), as previously described (Antonini et al. 2006). HeLa and HEK293T cells were cultured in Dulbecco's modified Eagle's medium–10% fetal bovine serum. All cell types were transfected using Lipofectamine 2000 (Invitrogen), following the manufacturer’s protocol. High titer retrovirus production was obtained in HEK-293T cells by transient transfection of the PINCO constructs with pEco vector using Lipofectamine 2000 as previously described (Antonini et al. 2006). Primary keratinocytes were infected twice with the retrovirus 24 and 48 h after plating in the presence of 8 ug/mL polybrene. To knockdown Trp63 gene expression, we performed transient transfections in primary keratinocytes using 200 nM small interfering RNA (Stealth siRNA, Invitrogen) as previously described (Nguyen et al. 2006).
Immunostaining and immunoblotting
For the proliferation assay, primary keratinocytes were infected with a retrovirus carrying ΔNp63α under the control of the CMV promoter. Four days after infections, cells were labeled with BrdU (Zymed) for 3 h and subsequently fixed with 4% paraformaldehyde. After fixation, cells were permeabilized with NP-40 0.1%, and the DNA was denatured with 50 mM NaOH. BrdU was detected with mouse monoclonal antibodies (G3G4; Developmental Studies Hybridoma Bank, The University of Iowa) and rabbit-anti mouse TRITC (Dako Cytomation). DNA was counterstained with DAPI (100 ng/mL). Cell lysates were resolved on 10% SDS/polyacrylamide gels and transferred to an Immobilon-P membrane (Millipore). After blocking with 5% milk-PBS, the membranes were probed with anti-TRP63 mouse monoclonal antibodies (4A4, Santa Cruz Biotechnology), anti-beta tubulin antibodies (H-235, Santa Cruz Biotech.), or anti-Erk antibody (K-23, Santa Cruz Biotechnology). Immunoreactive bands were detected with ECL (Amersham).
Cloning and reporter assay
To generate the ΔNp63α inducible gene, a modified estrogen receptor ligand-binding domain (ER) (Littlewood et al. 1995) was cloned by PCR and inserted in-frame either at the 5′ or at the 3′ of ΔNp63α coding sequence in the pCMVFlag ΔNp63α (Nguyen et al. 2006). To construct the retroviruses, the Flag-ERΔNp63α or the FlagΔNp63α cDNA were inserted under the CMV promoter in the PINCO retroviral vector (Nguyen et al. 2006). To construct the reporter plasmid for Fosl1 promoter, a 2.1-kb fragment containing a 1.9-kb Fosl1 promoter region and 0.2 kb of the 5′ UTR upstream was amplified by PCR from mouse genomic DNA (forward primer: CCAGGGACCAAACTCAGGTA; reverse primer: AAAGTTCTTGGGCTGAACCA), and inserted in the pGL3-basic Luc reporter plasmid (Promega).
Hela cells were transfected with the following reporter plasmids: fosl1-promoter-Luc vector pGL3 (0.25 μg); an AP-1 responsive reporter pAP-1-Luc (Stratagene) (0.25 μg) containing seven copies of the AP-1 consensus sequence; C40-Luc (Antonini et al. 2006) (0.25 μg); and the following effector plasmids: pCMV-Flag empty plasmid, pCMV-FlagΔNp63α, and pCMVFlagTAp63γ (0.05 μg). pCMVRenilla (25 ng) was used as internal control. Luciferase activity was measured using Dual-Luciferase reporter assay (Promega) according to the manufacturer’s instructions.
RNA extraction, quantitative real time RT–PCR, and microarrays
Total RNA was extracted using TRIzol reagent (Invitrogen) and treated with RNase-free DNase I (Promega), and cDNA was synthesized using Superscript II (Invitrogen). Real time RT–PCR analysis was performed using Power SYBR Green PCR Master Mix (Applied Biosystems) in a Real Time PCR System 7000 (Applied Biosystems). For specific oligonucleotide sequences, see Supplemental Table 8.
For microarray analysis, retrovirally infected primary keratinocytes were grown for 5 d, and were subsequently treated with tamoxifen (4-hydroxytamoxifen, 20 nM, Sigma) at different times, or left untreated as control. RNA interference was performed by transfection of primary mouse keratinocytes with 200 nM siRNA for Trp63 (Antonini et al. 2006) and control siRNAs. Total RNA was extracted 48 h after transfection and sent to the Boston University Microarray Facility for labeling, amplification, and hybridization to the Affymetrix Mouse Genome 430A 2.0 microarrays.
Raw probe intensities for each of the hybridized microarrays were normalized to gene expression levels using the dChip algorithm as described in the Supplemental material. To identify genes significantly responding in the time-series experiment, we used a χ2 test with the estimated standard deviation from a generalized cross validation method based on cubic spline fitting. We then computed the P-values and false discovery rate (FDR) and identified 786 transcripts (FDR < 0.1) that responded significantly in the time series. For more details, see Supplemental material. To identify differentially regulated genes in the siRNA experiment, we used Cyber-T (Baldi and Long 2001; http://cybert.microarray.ics.uci.edu). Cyber-T estimates experiment-wide false positive and negative levels based on the modeling of P-value distributions by computing the posterior probability density estimate (PPDE). We selected 1920 genes with PPDE ≥ 0.9900 and 719 with a PPDE ≥ 0.9999. The use of a different threshold is suggested for a small number of replicates, typical for microarrays (Allison et al. 2002).
qChIP and ChIP-chip
Chromatin was immunoprecipitated using anti-TRP63 (H-137; Santa Cruz Biotechnology) and anti-MAPK3 antibodies (K23; Santa Cruz Biotechnology) as previously described (Antonini et al. 2006). Real-time PCR was performed as above. See Supplemental Table 9 for oligonucleotide sequences. To perform the ChIP-chip assay, ∼5 × 10⁷ keratinocytes were fixed with 1% formaldehyde. Cells extracts were sonicated to obtain DNA fragments ranging from 200 to 1000 bp in length. ChIP-chip was performed following the Agilent protocol (http://www.home.agilent.com) using the anti-TRP63 rabbit polyclonal antibody (H-137 from Santa Cruz Biotech). Input and immunoprecipitated DNA samples were amplified by ligation-mediated PCR, and labeled with a two-color labeling system (using Cy5 and Cy3 dyes, respectively). Samples were hybridized on a custom Agilent Array (1X 244K Format) including 60-mer oligonucleotide probes spaced every 100 bp across regions of interest. Raw images of the hybridized array were processed following the Agilent ChIP Analytics software to identify significant probes and regions with standard preset parameters (Blank subtraction normalization, Intra-array [dye-bias] median normalization, Intra-array Lowess [intensity-dependent] normalization, Whitehead Error Model v1.0).
Validation of ChIP-chip results by quantitative ChIP, followed by real time PCR, was performed as previously described (Yang et al. 2006). We verified 30 randomly chosen TRP63-bound regions across the range of P-values (i.e., 10% of the 292 TRP63-bound regions found) by ChIP, followed by real-time PCR. The estimated FDR was 12% for the 292 regions (Supplemental Fig. 5; Supplemental material).
Specific binding of endogenous TRP63 to Fos, Jun, and Fosl1 promoters in Figure 6B were obtained by ChIP, followed by real-time PCR with the primers listed in Supplemental Table 9.
TSNI enrichment analysis
To compute the fold-change enrichment of the top 100 TSNI-ranked transcripts in response to Trp63 knockdown by siRNA, we compared their average siRNA fold-change with an empirical distribution obtained by computing the average of 100 transcripts picked at random from the list of 786 transcripts. The process was repeated 10,000 times, and the estimated empirical distribution used to compute the P-value of m, which resulted in P < 0.0001 (= 1/10,000).
To compute the binding score (BS) enrichment of the top 100 TSNI-ranked transcripts, we selected 100 transcripts randomly from the 300 transcripts analyzed by ChIP-chip, built an empirical distribution as described above, and used the estimated empirical distribution to compute P-value. A P-value of 0.022 suggests that the binding score of the top 100 TSNI-ranked genes is significantly higher than the binding score of 100 genes selected randomly. For the bottom 200 TSNI-ranked transcripts, P-values of 0.700 and 0.935, respectively, suggest no significance over selecting transcripts randomly. For additional information, see Supplemental material.
De novo motif finding in the TRP63-bound regions
MEME software (version 3.5.4) was used to search for over-represented motifs among the 292 regions identified by ChIP-chip. For each bound region, a sequence of 261 bp was analyzed, centered on the probe with the smallest P-value. MEME estimates the statistical significance of a motif with an E-value. The E-value is an estimate of the expected number of motifs with the given log likelihood ratio (or higher), and with the same width and number of occurrences in a similarly sized set of random sequences.
Over-represented TRANSFAC motifs in the TRP63-bound regions
A total of 354 vertebrate transcription factor motifs (from Transfac 10.1) were scored on the 292 sequence regions using a nonparametric algorithm (King and Roth 2003) for known motif prediction. For each bound region detected by ChIP-chip analysis, a sequence of 261 bp was analyzed centered on the probe with the smallest P-value. For each of the 354 motifs, the best predicted binding site in each of the sequences was considered by choosing the maximum motif-score computed by the algorithm. The scores were then normalized considering mean scores on random sequences obtained by shuffling each of the 292 sequences. A P-value was then computed comparing the normalized score of each of the 354 motifs, with the scores obtained on the random sequences.
Acknowledgments
We thank J.J. Collins, A. Ballabio, G. Diez-Roux, and T. Russo for critical reading of the manuscript. We also thank A. Califano and A. Ferrando for help in designing the ChIP-chip experiment; T. Palomero, A. Margolin, and L. Cutillo for microarray hybridization and analysis. We thank W. Weinberg for providing the pBDS-2 reporter plasmid. This study was supported by grants from the Italian Telethon Foundation (TDDP17TELB and TDDP51TELC) to D.d.B., the Italian Telethon Foundation (GGP06243), and the National Foundation for Ectodermal Dysplasia (NFED) to C.M. M.B and D.A. are supported by the European School of Molecular Medicine (SEMM), Naples, Italy. G.D.G. and A.A. are supported by the Italian Telethon Foundation, Seconda Universita’ degli Studi di Napoli (SUN) and Universita’ degli Studi “Federico II” di Napoli.
Footnotes
[Supplemental material is available online at www.genome.org.]
Article published online before print. Article and publication date are at http://www.genome.org/cgi/doi/10.1101/gr.073601.107.
References
- Allison B., Gadbury G.L., Moonseong H, Lee C-K., Prolla T.A., Weindruch R., Gadbury G.L., Moonseong H, Lee C-K., Prolla T.A., Weindruch R., Moonseong H, Lee C-K., Prolla T.A., Weindruch R., Lee C-K., Prolla T.A., Weindruch R., Prolla T.A., Weindruch R., Weindruch R. Computat. Stat. Data Anal. Vol. 39. 2002. A mixture model approach for the analysis of microarray gene expression data; pp. 1–20. [Google Scholar]
- Amit I., Citri A., Shay T., Lu Y., Katz M., Zhang F., Tarcic G., Siwak D., Lahad J., Jacob-Hirsch J., Citri A., Shay T., Lu Y., Katz M., Zhang F., Tarcic G., Siwak D., Lahad J., Jacob-Hirsch J., Shay T., Lu Y., Katz M., Zhang F., Tarcic G., Siwak D., Lahad J., Jacob-Hirsch J., Lu Y., Katz M., Zhang F., Tarcic G., Siwak D., Lahad J., Jacob-Hirsch J., Katz M., Zhang F., Tarcic G., Siwak D., Lahad J., Jacob-Hirsch J., Zhang F., Tarcic G., Siwak D., Lahad J., Jacob-Hirsch J., Tarcic G., Siwak D., Lahad J., Jacob-Hirsch J., Siwak D., Lahad J., Jacob-Hirsch J., Lahad J., Jacob-Hirsch J., Jacob-Hirsch J., et al. A module of negative feedback regulators defines growth factor signaling. Nat. Genet. 2007;39:503–512. doi: 10.1038/ng1987. [DOI] [PubMed] [Google Scholar]
- Antonini D., Rossi B., Han R., Minichiello A., Di Palma T., Corrado M., Banfi S., Zannini M., Brissette J.L., Missero C., Rossi B., Han R., Minichiello A., Di Palma T., Corrado M., Banfi S., Zannini M., Brissette J.L., Missero C., Han R., Minichiello A., Di Palma T., Corrado M., Banfi S., Zannini M., Brissette J.L., Missero C., Minichiello A., Di Palma T., Corrado M., Banfi S., Zannini M., Brissette J.L., Missero C., Di Palma T., Corrado M., Banfi S., Zannini M., Brissette J.L., Missero C., Corrado M., Banfi S., Zannini M., Brissette J.L., Missero C., Banfi S., Zannini M., Brissette J.L., Missero C., Zannini M., Brissette J.L., Missero C., Brissette J.L., Missero C., Missero C. An autoregulatory loop directs the tissue-specific expression of p63 through a long-range evolutionarily conserved enhancer. Mol. Cell. Biol. 2006;26:3308–3318. doi: 10.1128/MCB.26.8.3308-3318.2006. [DOI] [PMC free article] [PubMed] [Google Scholar]
- Bailey T.L., Elkan C., Elkan C. Fitting a mixture model by expectation maximization to discover motifs in biopolymers. Proc. Int. Conf. Intell. Syst. Mol. Biol. 1994;2:28–36. [PubMed] [Google Scholar]
- Baldi P., Long A.D., Long A.D. A Bayesian framework for the analysis of microarray expression data: Regularized t-test and statistical inferences of gene changes. Bioinformatics. 2001;17:509–519. doi: 10.1093/bioinformatics/17.6.509. [DOI] [PubMed] [Google Scholar]
- Bansal M., Della-Gatta G., di Bernardo D., Della-Gatta G., di Bernardo D., di Bernardo D. Inference of gene regulatory networks and compound mode of action from time course gene expression profiles. Bioinformatics. 2006;22:815–822. doi: 10.1093/bioinformatics/btl003. [DOI] [PubMed] [Google Scholar]
- Bansal M., Belcastro V., Ambesi-Impiombato A., di Bernardo D., Belcastro V., Ambesi-Impiombato A., di Bernardo D., Ambesi-Impiombato A., di Bernardo D., di Bernardo D. How to infer gene networks from expression profiles. Mol. Syst. Biol. 2007;3:78. doi: 10.1038/msb4100120. [DOI] [PMC free article] [PubMed] [Google Scholar]
- Barenco M., Tomescu D., Brewer D., Callard R., Stark J., Hubank M., Tomescu D., Brewer D., Callard R., Stark J., Hubank M., Brewer D., Callard R., Stark J., Hubank M., Callard R., Stark J., Hubank M., Stark J., Hubank M., Hubank M. Ranked prediction of p53 targets using hidden variable dynamic modeling. Genome Biol. 2006;7:R25. doi: 10.1186/gb-2006-7-3-r25. [DOI] [PMC free article] [PubMed] [Google Scholar]
- Basso K., Margolin A.A., Stolovitzky G., Klein U., Dalla-Favera R., Califano A., Margolin A.A., Stolovitzky G., Klein U., Dalla-Favera R., Califano A., Stolovitzky G., Klein U., Dalla-Favera R., Califano A., Klein U., Dalla-Favera R., Califano A., Dalla-Favera R., Califano A., Califano A. Reverse engineering of regulatory networks in human B cells. Nat. Genet. 2005;37:382–390. doi: 10.1038/ng1532. [DOI] [PubMed] [Google Scholar]
- de Jong H. Modeling and simulation of genetic regulatory systems: A literature review. J. Comput. Biol. 2002;9:67–103. doi: 10.1089/10665270252833208. [DOI] [PubMed] [Google Scholar]
- Dennis G., Sherman B.T., Hosack D.A., Yang J., Gao W., Lane H.C., Lempicki R.A., Sherman B.T., Hosack D.A., Yang J., Gao W., Lane H.C., Lempicki R.A., Hosack D.A., Yang J., Gao W., Lane H.C., Lempicki R.A., Yang J., Gao W., Lane H.C., Lempicki R.A., Gao W., Lane H.C., Lempicki R.A., Lane H.C., Lempicki R.A., Lempicki R.A. DAVID: Database for Annotation, Visualization, and Integrated Discovery. Genome Biol. 2003;4:3. doi: 10.1186/gb-2003-4-5-p3. [DOI] [PubMed] [Google Scholar]
- di Bernardo D., Thompson M.J., Gardner T.S., Chobot S.E., Eastwood E.L., Wojtovich A.P., Elliott S.J., Schaus S.E., Collins J.J., Thompson M.J., Gardner T.S., Chobot S.E., Eastwood E.L., Wojtovich A.P., Elliott S.J., Schaus S.E., Collins J.J., Gardner T.S., Chobot S.E., Eastwood E.L., Wojtovich A.P., Elliott S.J., Schaus S.E., Collins J.J., Chobot S.E., Eastwood E.L., Wojtovich A.P., Elliott S.J., Schaus S.E., Collins J.J., Eastwood E.L., Wojtovich A.P., Elliott S.J., Schaus S.E., Collins J.J., Wojtovich A.P., Elliott S.J., Schaus S.E., Collins J.J., Elliott S.J., Schaus S.E., Collins J.J., Schaus S.E., Collins J.J., Collins J.J. Chemogenomic profiling on a genome-wide scale using reverse-engineered gene networks. Nat. Biotechnol. 2005;23:377–383. doi: 10.1038/nbt1075. [DOI] [PubMed] [Google Scholar]
- Eisen M.B., Spellman P.T., Brown P.O., Botstein D., Spellman P.T., Brown P.O., Botstein D., Brown P.O., Botstein D., Botstein D. Cluster analysis and display of genome-wide expression patterns. Proc. Natl. Acad. Sci. 1998;95:14863–14868. doi: 10.1073/pnas.95.25.14863. [DOI] [PMC free article] [PubMed] [Google Scholar]
- Flores E.R., Tsai K.Y., Crowley D., Sengupta S., Yang A., McKeon F., Jacks T., Tsai K.Y., Crowley D., Sengupta S., Yang A., McKeon F., Jacks T., Crowley D., Sengupta S., Yang A., McKeon F., Jacks T., Sengupta S., Yang A., McKeon F., Jacks T., Yang A., McKeon F., Jacks T., McKeon F., Jacks T., Jacks T. p63 and p73 are required for p53-dependent apoptosis in response to DNA damage. Nature. 2002;416:560–564. doi: 10.1038/416560a. [DOI] [PubMed] [Google Scholar]
- Frank S.R., Schroeder M., Fernandez P., Taubert S., Amati B., Schroeder M., Fernandez P., Taubert S., Amati B., Fernandez P., Taubert S., Amati B., Taubert S., Amati B., Amati B. Binding of c-Myc to chromatin mediates mitogen-induced acetylation of histone H4 and gene activation. Genes & Dev. 2001;15:2069–2082. doi: 10.1101/gad.906601. [DOI] [PMC free article] [PubMed] [Google Scholar]
- Gardner T.S., di Bernardo D., Lorenz D., Collins J.J., di Bernardo D., Lorenz D., Collins J.J., Lorenz D., Collins J.J., Collins J.J. Inferring genetic networks and identifying compound mode of action via expression profiling. Science. 2003;301:102–105. doi: 10.1126/science.1081900. [DOI] [PubMed] [Google Scholar]
- Hartemink A.J. Reverse engineering gene regulatory networks. Nat. Biotechnol. 2005;23:554–555. doi: 10.1038/nbt0505-554. [DOI] [PubMed] [Google Scholar]
- Ihrie R.A., Marques M.R., Nguyen B.T., Horner J.S., Papazoglu C., Bronson R.T., Mills A.A., Attardi L.D., Marques M.R., Nguyen B.T., Horner J.S., Papazoglu C., Bronson R.T., Mills A.A., Attardi L.D., Nguyen B.T., Horner J.S., Papazoglu C., Bronson R.T., Mills A.A., Attardi L.D., Horner J.S., Papazoglu C., Bronson R.T., Mills A.A., Attardi L.D., Papazoglu C., Bronson R.T., Mills A.A., Attardi L.D., Bronson R.T., Mills A.A., Attardi L.D., Mills A.A., Attardi L.D., Attardi L.D. Perp is a p63-regulated gene essential for epithelial integrity. Cell. 2005;120:843–856. doi: 10.1016/j.cell.2005.01.008. [DOI] [PubMed] [Google Scholar]
- Kel A.E., Gossling E., Reuter I., Cheremushkin E., Kel-Margoulis O.V., Wingender E., Gossling E., Reuter I., Cheremushkin E., Kel-Margoulis O.V., Wingender E., Reuter I., Cheremushkin E., Kel-Margoulis O.V., Wingender E., Cheremushkin E., Kel-Margoulis O.V., Wingender E., Kel-Margoulis O.V., Wingender E., Wingender E. MATCH: A tool for searching transcription factor binding sites in DNA sequences. Nucleic Acids Res. 2003;31:3576–3579. doi: 10.1093/nar/gkg585. [DOI] [PMC free article] [PubMed] [Google Scholar]
- King O.D., Roth F.P., Roth F.P. A non-parametric model for transcription factor binding sites. Nucleic Acids Res. 2003;31:e116. doi: 10.1093/nar/gng117. [DOI] [PMC free article] [PubMed] [Google Scholar]
- King K.E., Ponnamperuma R.M., Yamashita T., Tokino T., Lee L.A., Young M.F., Weinberg W.C., Ponnamperuma R.M., Yamashita T., Tokino T., Lee L.A., Young M.F., Weinberg W.C., Yamashita T., Tokino T., Lee L.A., Young M.F., Weinberg W.C., Tokino T., Lee L.A., Young M.F., Weinberg W.C., Lee L.A., Young M.F., Weinberg W.C., Young M.F., Weinberg W.C., Weinberg W.C. ΔNp63α functions as both a positive and a negative transcriptional regulator and blocks in vitro differentiation of murine keratinocytes. Oncogene. 2003;22:3635–3644. doi: 10.1038/sj.onc.1206536. [DOI] [PubMed] [Google Scholar]
- Koster M.I., Kim S., Mills A.A., DeMayo F.J., Roop D.R., Kim S., Mills A.A., DeMayo F.J., Roop D.R., Mills A.A., DeMayo F.J., Roop D.R., DeMayo F.J., Roop D.R., Roop D.R. p63 is the molecular switch for initiation of an epithelial stratification program. Genes & Dev. 2004;18:126–131. doi: 10.1101/gad.1165104. [DOI] [PMC free article] [PubMed] [Google Scholar]
- Lee H., Kimelman D., Kimelman D. A dominant-negative form of p63 is required for epidermal proliferation in zebrafish. Dev. Cell. 2002;2:607–616. doi: 10.1016/s1534-5807(02)00166-1. [DOI] [PubMed] [Google Scholar]
- Littlewood T.D., Hancock D.C., Danielian P.S., Parker M.G., Evan G.I., Hancock D.C., Danielian P.S., Parker M.G., Evan G.I., Danielian P.S., Parker M.G., Evan G.I., Parker M.G., Evan G.I., Evan G.I. A modified oestrogen receptor ligand-binding domain as an improved switch for the regulation of heterologous proteins. Nucleic Acids Res. 1995;23:1686–1690. doi: 10.1093/nar/23.10.1686. [DOI] [PMC free article] [PubMed] [Google Scholar]
- Mills A.A., Zheng B., Wang X.J., Vogel H., Roop D.R., Bradley A., Zheng B., Wang X.J., Vogel H., Roop D.R., Bradley A., Wang X.J., Vogel H., Roop D.R., Bradley A., Vogel H., Roop D.R., Bradley A., Roop D.R., Bradley A., Bradley A. p63 is a p53 homologue required for limb and epidermal morphogenesis. Nature. 1999;398:708–713. doi: 10.1038/19531. [DOI] [PubMed] [Google Scholar]
- Montgomery D.C., Peck E.A., Vining G.G., Peck E.A., Vining G.G., Vining G.G. Introduction to linear regression analysis. Wiley; New York: 2001. [Google Scholar]
- Nguyen B.C., Lefort K., Mandinova A., Antonini D., Devgan V., Della Gatta G., Koster M.I., Zhang Z., Wang J., di Tommasi Vignano A., Lefort K., Mandinova A., Antonini D., Devgan V., Della Gatta G., Koster M.I., Zhang Z., Wang J., di Tommasi Vignano A., Mandinova A., Antonini D., Devgan V., Della Gatta G., Koster M.I., Zhang Z., Wang J., di Tommasi Vignano A., Antonini D., Devgan V., Della Gatta G., Koster M.I., Zhang Z., Wang J., di Tommasi Vignano A., Devgan V., Della Gatta G., Koster M.I., Zhang Z., Wang J., di Tommasi Vignano A., Della Gatta G., Koster M.I., Zhang Z., Wang J., di Tommasi Vignano A., Koster M.I., Zhang Z., Wang J., di Tommasi Vignano A., Zhang Z., Wang J., di Tommasi Vignano A., Wang J., di Tommasi Vignano A., di Tommasi Vignano A., et al. Cross-regulation between Notch and p63 in keratinocyte commitment to differentiation. Genes & Dev. 2006;20:1028–1042. doi: 10.1101/gad.1406006. [DOI] [PMC free article] [PubMed] [Google Scholar]
- Oettgen P., Alani R.M., Barcinski M.A., Brown L., Akbarali Y., Boltax J., Kunsch C., Munger K., Libermann T.A., Alani R.M., Barcinski M.A., Brown L., Akbarali Y., Boltax J., Kunsch C., Munger K., Libermann T.A., Barcinski M.A., Brown L., Akbarali Y., Boltax J., Kunsch C., Munger K., Libermann T.A., Brown L., Akbarali Y., Boltax J., Kunsch C., Munger K., Libermann T.A., Akbarali Y., Boltax J., Kunsch C., Munger K., Libermann T.A., Boltax J., Kunsch C., Munger K., Libermann T.A., Kunsch C., Munger K., Libermann T.A., Munger K., Libermann T.A., Libermann T.A. Isolation and characterization of a novel epithelium-specific transcription factor, ESE-1, a member of the ets family. Mol. Cell. Biol. 1997;17:4419–4433. doi: 10.1128/mcb.17.8.4419. [DOI] [PMC free article] [PubMed] [Google Scholar]
- Pellegrini G., Dellambra E., Golisano O., Martinelli E., Fantozzi I., Bondanza S., Ponzin D., McKeon F., De Luca M., Dellambra E., Golisano O., Martinelli E., Fantozzi I., Bondanza S., Ponzin D., McKeon F., De Luca M., Golisano O., Martinelli E., Fantozzi I., Bondanza S., Ponzin D., McKeon F., De Luca M., Martinelli E., Fantozzi I., Bondanza S., Ponzin D., McKeon F., De Luca M., Fantozzi I., Bondanza S., Ponzin D., McKeon F., De Luca M., Bondanza S., Ponzin D., McKeon F., De Luca M., Ponzin D., McKeon F., De Luca M., McKeon F., De Luca M., De Luca M. p63 identifies keratinocyte stem cells. Proc. Natl. Acad. Sci. 2001;98:3156–3161. doi: 10.1073/pnas.061032098. [DOI] [PMC free article] [PubMed] [Google Scholar]
- Sbisa E., Mastropasqua G., Lefkimmiatis K., Caratozzolo M.F., D'Erchia A.M., Tullo A., Mastropasqua G., Lefkimmiatis K., Caratozzolo M.F., D'Erchia A.M., Tullo A., Lefkimmiatis K., Caratozzolo M.F., D'Erchia A.M., Tullo A., Caratozzolo M.F., D'Erchia A.M., Tullo A., D'Erchia A.M., Tullo A., Tullo A. Connecting p63 to cellular proliferation: The example of the adenosine deaminase target gene. Cell Cycle. 2006;5:205–212. doi: 10.4161/cc.5.2.2361. [DOI] [PubMed] [Google Scholar]
- Senoo M., Pinto F., Crum C.P., McKeon F., Pinto F., Crum C.P., McKeon F., Crum C.P., McKeon F., McKeon F. p63 Is essential for the proliferative potential of stem cells in stratified epithelia. Cell. 2007;129:523–536. doi: 10.1016/j.cell.2007.02.045. [DOI] [PubMed] [Google Scholar]
- Subramanian A., Tamayo P., Mootha V.K., Mukherjee S., Ebert B.L., Gillette M.A., Paulovich A., Pomeroy S.L., Golub T.R., Lander E.S., Tamayo P., Mootha V.K., Mukherjee S., Ebert B.L., Gillette M.A., Paulovich A., Pomeroy S.L., Golub T.R., Lander E.S., Mootha V.K., Mukherjee S., Ebert B.L., Gillette M.A., Paulovich A., Pomeroy S.L., Golub T.R., Lander E.S., Mukherjee S., Ebert B.L., Gillette M.A., Paulovich A., Pomeroy S.L., Golub T.R., Lander E.S., Ebert B.L., Gillette M.A., Paulovich A., Pomeroy S.L., Golub T.R., Lander E.S., Gillette M.A., Paulovich A., Pomeroy S.L., Golub T.R., Lander E.S., Paulovich A., Pomeroy S.L., Golub T.R., Lander E.S., Pomeroy S.L., Golub T.R., Lander E.S., Golub T.R., Lander E.S., Lander E.S., et al. Gene set enrichment analysis: A knowledge-based approach for interpreting genome-wide expression profiles. Proc. Natl. Acad. Sci. 2005;102:15545–15550. doi: 10.1073/pnas.0506580102. [DOI] [PMC free article] [PubMed] [Google Scholar]
- Testoni B., Borrelli S., Tenedini E., Alotto D., Castagnoli C., Piccolo S., Tagliafico E., Ferrari S., Vigano M.A., Mantovani R., Borrelli S., Tenedini E., Alotto D., Castagnoli C., Piccolo S., Tagliafico E., Ferrari S., Vigano M.A., Mantovani R., Tenedini E., Alotto D., Castagnoli C., Piccolo S., Tagliafico E., Ferrari S., Vigano M.A., Mantovani R., Alotto D., Castagnoli C., Piccolo S., Tagliafico E., Ferrari S., Vigano M.A., Mantovani R., Castagnoli C., Piccolo S., Tagliafico E., Ferrari S., Vigano M.A., Mantovani R., Piccolo S., Tagliafico E., Ferrari S., Vigano M.A., Mantovani R., Tagliafico E., Ferrari S., Vigano M.A., Mantovani R., Ferrari S., Vigano M.A., Mantovani R., Vigano M.A., Mantovani R., Mantovani R. Identification of new p63 targets in human keratinocytes. Cell Cycle. 2006;5:2805–2811. doi: 10.4161/cc.5.23.3525. [DOI] [PubMed] [Google Scholar]
- Truong A.B., Kretz M., Ridky T.W., Kimmel R., Khavari P.A., Kretz M., Ridky T.W., Kimmel R., Khavari P.A., Ridky T.W., Kimmel R., Khavari P.A., Kimmel R., Khavari P.A., Khavari P.A. p63 regulates proliferation and differentiation of developmentally mature keratinocytes. Genes & Dev. 2006;20:3185–3197. doi: 10.1101/gad.1463206. [DOI] [PMC free article] [PubMed] [Google Scholar]
- van Someren E.P., Vaes B.L., Steegenga W.T., Sijbers A.M., Dechering K.J., Reinders M.J., Vaes B.L., Steegenga W.T., Sijbers A.M., Dechering K.J., Reinders M.J., Steegenga W.T., Sijbers A.M., Dechering K.J., Reinders M.J., Sijbers A.M., Dechering K.J., Reinders M.J., Dechering K.J., Reinders M.J., Reinders M.J. Least Absolute Regression Network Analysis of the murine osteoblast differentiation network. Bioinformatics. 2005;22:477–484. doi: 10.1093/bioinformatics/bti816. [DOI] [PubMed] [Google Scholar]
- Vastrik I., Kaipainen A., Penttila T.L., Lymboussakis A., Alitalo R., Parvinen M., Alitalo K., Kaipainen A., Penttila T.L., Lymboussakis A., Alitalo R., Parvinen M., Alitalo K., Penttila T.L., Lymboussakis A., Alitalo R., Parvinen M., Alitalo K., Lymboussakis A., Alitalo R., Parvinen M., Alitalo K., Alitalo R., Parvinen M., Alitalo K., Parvinen M., Alitalo K., Alitalo K. Expression of the mad gene during cell differentiation in vivo and its inhibition of cell growth in vitro. J. Cell Biol. 1995;128:1197–1208. doi: 10.1083/jcb.128.6.1197. [DOI] [PMC free article] [PubMed] [Google Scholar]
- Vigano M.A., Lamartine J., Testoni B., Merico D., Alotto D., Castagnoli C., Robert A., Candi E., Melino G., Gidrol X., Lamartine J., Testoni B., Merico D., Alotto D., Castagnoli C., Robert A., Candi E., Melino G., Gidrol X., Testoni B., Merico D., Alotto D., Castagnoli C., Robert A., Candi E., Melino G., Gidrol X., Merico D., Alotto D., Castagnoli C., Robert A., Candi E., Melino G., Gidrol X., Alotto D., Castagnoli C., Robert A., Candi E., Melino G., Gidrol X., Castagnoli C., Robert A., Candi E., Melino G., Gidrol X., Robert A., Candi E., Melino G., Gidrol X., Candi E., Melino G., Gidrol X., Melino G., Gidrol X., Gidrol X., et al. New p63 targets in keratinocytes identified by a genome-wide approach. EMBO J. 2006;25:5105–5116. doi: 10.1038/sj.emboj.7601375. [DOI] [PMC free article] [PubMed] [Google Scholar]
- Workman C.T., Mak H.C., McCuine S., Tagne J.B., Agarwal M., Ozier O., Begley T.J., Samson L.D., Ideker T., Mak H.C., McCuine S., Tagne J.B., Agarwal M., Ozier O., Begley T.J., Samson L.D., Ideker T., McCuine S., Tagne J.B., Agarwal M., Ozier O., Begley T.J., Samson L.D., Ideker T., Tagne J.B., Agarwal M., Ozier O., Begley T.J., Samson L.D., Ideker T., Agarwal M., Ozier O., Begley T.J., Samson L.D., Ideker T., Ozier O., Begley T.J., Samson L.D., Ideker T., Begley T.J., Samson L.D., Ideker T., Samson L.D., Ideker T., Ideker T. A systems approach to mapping DNA damage response pathways. Science. 2006;312:1054–1059. doi: 10.1126/science.1122088. [DOI] [PMC free article] [PubMed] [Google Scholar]
- Yang A., Kaghad M., Wang Y., Gillett E., Fleming M.D., Dotsch V., Andrews N.C., Caput D., McKeon F., Kaghad M., Wang Y., Gillett E., Fleming M.D., Dotsch V., Andrews N.C., Caput D., McKeon F., Wang Y., Gillett E., Fleming M.D., Dotsch V., Andrews N.C., Caput D., McKeon F., Gillett E., Fleming M.D., Dotsch V., Andrews N.C., Caput D., McKeon F., Fleming M.D., Dotsch V., Andrews N.C., Caput D., McKeon F., Dotsch V., Andrews N.C., Caput D., McKeon F., Andrews N.C., Caput D., McKeon F., Caput D., McKeon F., McKeon F. p63, a p53 homolog at 3q27-29, encodes multiple products with transactivating, death-inducing, and dominant-negative activities. Mol. Cell. 1998;2:305–316. doi: 10.1016/s1097-2765(00)80275-0. [DOI] [PubMed] [Google Scholar]
- Yang A., Schweitzer R., Sun D., Kaghad M., Walker N., Bronson R.T., Tabin C., Sharpe A., Caput D., Crum C., Schweitzer R., Sun D., Kaghad M., Walker N., Bronson R.T., Tabin C., Sharpe A., Caput D., Crum C., Sun D., Kaghad M., Walker N., Bronson R.T., Tabin C., Sharpe A., Caput D., Crum C., Kaghad M., Walker N., Bronson R.T., Tabin C., Sharpe A., Caput D., Crum C., Walker N., Bronson R.T., Tabin C., Sharpe A., Caput D., Crum C., Bronson R.T., Tabin C., Sharpe A., Caput D., Crum C., Tabin C., Sharpe A., Caput D., Crum C., Sharpe A., Caput D., Crum C., Caput D., Crum C., Crum C., et al. p63 is essential for regenerative proliferation in limb, craniofacial and epithelial development. Nature. 1999;398:714–718. doi: 10.1038/19539. [DOI] [PubMed] [Google Scholar]
- Yang A., Zhu Z., Kapranov P., McKeon F., Church G.M., Gingeras T.R., Struhl K., Zhu Z., Kapranov P., McKeon F., Church G.M., Gingeras T.R., Struhl K., Kapranov P., McKeon F., Church G.M., Gingeras T.R., Struhl K., McKeon F., Church G.M., Gingeras T.R., Struhl K., Church G.M., Gingeras T.R., Struhl K., Gingeras T.R., Struhl K., Struhl K. Relationships between p63 binding, DNA sequence, transcription activity, and biological function in human cells. Mol. Cell. 2006;24:593–602. doi: 10.1016/j.molcel.2006.10.018. [DOI] [PubMed] [Google Scholar]
- Zenz R., Wagner E.F., Wagner E.F. Jun signalling in the epidermis: From developmental defects to psoriasis and skin tumors. Int. J. Biochem. Cell Biol. 2006;38:1043–1049. doi: 10.1016/j.biocel.2005.11.011. [DOI] [PubMed] [Google Scholar]