Abstract
Myosin V is an unconventional myosin proposed to be processive on actin filaments, analogous to kinesin on a microtubule [Mehta, A. D., et al. (1999) Nature (London) 400, 590–593]. To ascertain the unique properties of myosin V that permit processivity, we undertook a detailed kinetic analysis of the myosin V motor. We expressed a truncated, single-headed myosin V construct that bound a single light chain to study its innate kinetics, free from constraints imposed by other regions of the molecule. The data demonstrate that unlike any previously characterized myosin a single-headed myosin V spends most of its kinetic cycle (>70%) strongly bound to actin in the presence of ATP. This kinetic tuning is accomplished by increasing several of the rates preceding strong binding to actin and concomitantly prolonging the duration of the strongly bound state by slowing the rate of ADP release. The net result is a myosin unlike any previously characterized, in that ADP release is the rate-limiting step for the actin-activated ATPase cycle. Thus, because of a number of kinetic adaptations, myosin V is tuned for processive movement on actin and will be capable of transporting cargo at lower motor densities than any other characterized myosin.
Myosin V was identified in chicken brain cytoplasmic extracts as a calmodulin binding protein with actin-activated MgATPase activity and the ability to translocate actin filaments (1–3). By electron microscopy of rotary shadowed images, native chicken brain myosin V has two heads and two heavy chains that associate through a long coiled-coil domain in its tail region. Unlike myosin II, myosin V does not form filaments and is believed to act as a single molecule (4).
The unusual structure, cellular functions (5, 6), and steady-state biochemical properties (7), as well as single molecule mechanics (4) of myosin V support it being a processive motor. That is, for each diffusional encounter, a single (two-headed) myosin V molecule may be capable of going through multiple ATPase cycles and traveling long distances, equivalent to many individual steps of the motor, along its actin track before dissociating.
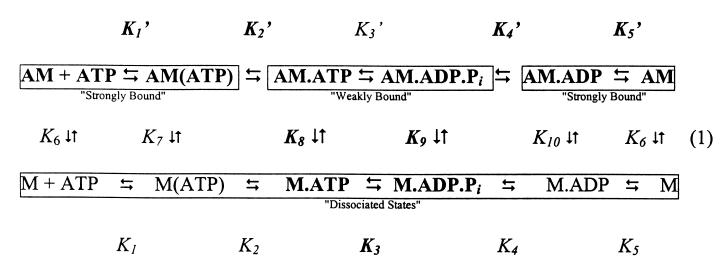
The myosin molecule, whether in the sarcomere of a muscle (myosin II) or moving vesicles on actin tracks (myosin V), goes through a characteristic cyclic interaction with actin (Scheme S1; predominant pathway is shown in bold). The key steps include the rapid binding of ATP to actin-bound myosin, the hydrolysis of ATP, the sequential release of phosphate (Pi) and ADP, and the rebinding of ATP. During the cycle, the myosin populates either the weak-binding states or strong-binding states (Scheme S1). Weak-binding myosin states dynamically detach and rebind to actin with a low affinity (Kd > 1 μM), whereas the strong-binding myosin states remain bound to actin with a high affinity (Kd ≪ 1 μM). Mechanical force generation, work, and directed movement on actin are possible only during periods when the myosin is strongly bound to actin. The fraction of the ATPase cycle that the myosin spends in these strong-binding states is called the duty ratio. For myosins that work together in asynchronous ensembles (as in the sarcomeres of muscle), high-speed movements are possible only if each myosin head spends a small fraction of the catalytic cycle strongly bound to actin (i.e., a low duty ratio). However, for a single, two-headed myosin molecule to achieve processivity, each of the two myosin heads must have a high duty ratio, because a two-headed myosin traversing an actin filament cannot dissociate both heads simultaneously or it will diffuse away before contacting the next attachment site on the filament. On average, each head must be strongly bound to actin 50% of the time, thus requiring a duty ratio of greater than 0.5.
Scheme 1.
There has been no direct observation of processive movement by myosin V as there has been for the microtubular motor, kinesin (8), although recent single molecule mechanical experiments provide compelling support for a processive motor (4). Assuming that it is processive, there is not enough known about the kinetic mechanism of myosin V to understand how this has been achieved. Therefore, we engineered a truncated myosin V (which we refer to as myosin V-1IQ) consisting of only the motor domain and an essential light chain to characterize the fundamental kinetic properties of the myosin V motor.
Materials and Methods
Reagents and Actin Purification.
Actin was purified from rabbit skeletal muscle, pyrene-labeled (9), and gel-filtered (10). Ca-actin was converted to Mg-actin with 0.2 mM EGTA and 50 μM MgCl2 before polymerizing by dialysis into KMg50 buffer (50 mM KCl/1 mM MgCl2/1 mM EGTA/1 mM DTT/10 mM imidazole, pH 7.0). Phalloidin does not significantly affect the steady-state ATPase activity of myosin V-1IQ (not shown) and was used throughout the study to stabilize actin filaments.
Construction, Expression, and Purification of Myosin V-1IQ.
The cDNA for chicken myosin V was truncated at the Arg792 codon, generating a construct consisting of the motor domain and the first IQ motif (referred to as myosin V-1IQ throughout text). A FLAG peptide (DYKDDDDK) sequence (11) was inserted at the N terminus of the myosin and subcloned into the baculovirus transfer vector, pVL1392 (Invitrogen). Positioning the FLAG sequence at the C terminus gave similar actin binding or steady-state ATPase kinetics as the N-terminally tagged construct (not shown). The human essential light chain (LC-1sa) was subcloned into pVL1393 for baculovirus expression and coexpressed with myosin V-1IQ. Myosin V-1IQ was purified as described (12). Purity was >99% with a stoichiometry of 1.0 light chain per heavy chain. [In a parallel study, we have determined that calmodulin or either of two essential light chains expressed in the brain, LC-1sa or LC17b, bind to the first IQ motif in myosin V. Preliminary measurements could not detect differences in the solution kinetics (steady-state actomyosin ATPase activities and ADP dissociation rates) as a function of the light chain. Thus this study was performed with the light chain (LC-1sa) that competition studies indicated to have the tightest binding to the heavy chain.]
ATPase Activity of Myosin V-1IQ and Actomyosin V-1IQ.
Steady-state MgATPase rates were measured in KMg50 buffer at 25°C with [γ-32P]-ATP (13). The ATPase rate in the absence of actin also was measured by single turnover fluorescence measurements (14). The K+/EDTA ATPase activity was measured in 500 mM KCl, 2 mM EDTA, 2 mM K+-ATP, 15 mM Tris, pH 7.5 at 25°C (13).
Titrations, Kinetics, and Modeling.
Equilibrium binding of actin filaments with myosin V-1IQ and myosin V-1IQ-ADP in KMg50 buffer was monitored by fluorescence quenching of pyrene-actin with a Photon Technology International (Princeton, NJ) Alphascan fluorimeter (15). Nucleotide-free conditions were achieved by incubating myosin V-1IQ with 0.01 units/ml apyrase at 25°C for 30 min.
Transient kinetic measurements were performed in KMg50 buffer at 25°C with an Applied Photophysics (Surrey, U.K.) SX.18MV stopped-flow having a 1.2-ms dead time. Quench flow measurements were made in KMg50 buffer with a Kintek (State College, PA) RQF-3 as described (15). Nonlinear least-squares fitting of the data was done with software provided with the instrument or with kaleidagraph (Synergy Software, Reading, PA). Errors reported are standard errors in the fits.
Transient Pi release was measured by using the coupled assay system containing the fluorescently labeled mutant of the Pi-binding protein as described (16). Background Pi was removed by incubating the stopped flow and all solutions with 7-methylguanosine (0.1 mM) and purine nucleoside phosphorylase (0.02 units/ml).
Kinetic modeling and simulations (17) were performed by using a simplified reaction mechanism (Scheme S1). Simulations of double mix transients were performed in two steps: (a) The concentrations of the reactants (Scheme S1) were determined for the 17-ms interval of the first mix by using the experimentally determined rate constants (Table 1). (b) The second mix was simulated by using the concentrations determined at 17 ms from the first simulation, plus the concentration of the new reactant. The simulated transients were constructed by assuming the strong-binding states (Scheme S1) correspond to the quenched pyrene-actin states.
Table 1.
Kinetic and equilibrium constants for myosin V-1IQ actin-activated ATPasea
| Steady-state | ATP binding and hydrolysis | ADP binding | Actin | ||||
|---|---|---|---|---|---|---|---|
| Vmax (+ actin) | 15 s−1b | K1′k2′ | 0.9 μM−1⋅s−1f,g | k+5 | 1.2 s−1j | k−6 | 73 μM−1⋅s−1f |
| Vmax (+ actin) | 12 s−1c | k2′ | 870 s−1f | k′+5 | 12 s−1j | k+6 | 0.00036 s−1f |
| ν0 (− actin) | 0.03 s−1b | K1k2 | 1.6 μM−1⋅s−1g,h | k′+5 | 16 s−1k | K6 | 4.9 × 10⁻¹² Mf |
| ν0 (− actin) | 0.02 s−1d | k2 | ≥750 s−1h | k−5 | 4.6 μM−1⋅s−1j | k−9 | 4.7 μM−1⋅s−1i |
| KATPase | 1.4 μMb,e | k+3 + k−3 | >250 s−1i | k′−5 | 12.6 μM−1⋅s−1j | k−10 | 4.2 μM−1⋅s−1f |
| k+3 + k−3 | 750 s−1h | K5 | 0.27 μMj | k+10 | 0.032 s−1f | ||
| k4′ | >250 s−1i | K′5 | 0.93 μMj | K10 | 7.6 × 10⁻⁹ Mf | ||
| K′5 | 0.7 μMl | ||||||
a50 mM KCl, 1 mM MgCl2, 1 mM EGTA, 1 mM DTT, 10 mM imidazole, pH 7.0, 25°C.
bSteady-state ATPase.
cQuench flow.
dSingle turnover.
eActin concentration at half maximum activation of steady-state ATPase.
fPyrene.
gMantATP.
hTryp fluorescence.
iPi-binding protein.
jMantADP.
kPyrene, simulated
lmantADP titration.
Results
Steady-State ATPase Activity of Myosin V-1IQ.
The steady-state myosin V-1IQ MgATPase activity is activated ≈750-fold by actin filaments (Table 1). Steady-state ATPases and single turnover measurements gave rates of 0.02–0.03 s−1 in the absence of actin (vo). At saturating actin filament concentrations (>10 μM) the steady-state ATPase rate is 15 sec−1. Long time courses are nonlinear because of product inhibition by ADP. The K+/EDTA ATPase is 0.9 μM head−1⋅s−1 at 25°C. Inclusion of 1 μM actin filaments reduces the rate 10-fold. Skeletal myosin is less sensitive to inhibition (18).
Myosin V-1IQ Binding to Actin Filaments.
A 75% fluorescence quenching upon myosin V-1IQ binding to pyrene-actin allowed us to monitor the association of myosin V-1IQ with actin in the presence and absence of 200 μM ADP (Scheme S1). By equilibrium titration, myosin V-1IQ and myosin V-1IQ-ADP quench the pyrene fluorescence stoichiometrically with K6 and K10 <20 nM (Table 1). From the dependence of binding on fractional labeling of actin, we estimate that pyrene weakens the actin affinity for myosin V-1IQ ≈2 fold (not shown) as reported for skeletal myosin (19).
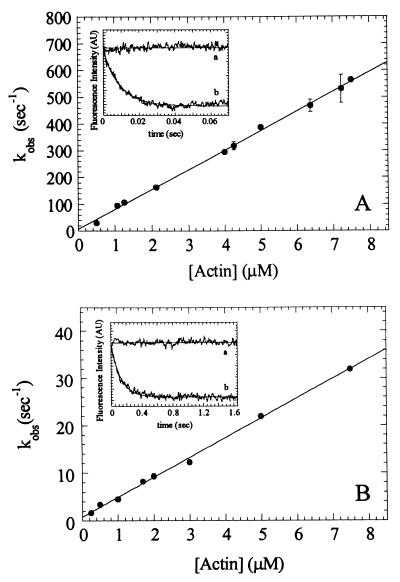
Time courses of myosin V-1IQ binding to actin with (k-10; Fig. 1A Inset) or without bound ADP (k−6; Fig. 1B Inset) follow single exponentials with no apparent lag phase (19). The observed rates depend linearly on the actin concentration over a wide range (Fig. 1). The apparent second-order rate constant for myosin V-1IQ binding to actin obtained from the slope is k−6 = 7.3 (± 0.7) × 107 M−1⋅s−1, and the rate for myosin V-1IQ-ADP binding to actin is k−10 = 4.2 (± 0.1) × 106 M−1⋅s−1. The actin association rate of myosin V-1IQ-ADP, but not myosin V-1IQ, is temperature dependent (5° ≈2-fold), suggesting that it is not diffusion limited.
Figure 1.
Kinetics of myosin V-1IQ and myosin V-1IQ-ADP binding to actin filaments. (A Inset) Time course of fluorescence change after mixing 1.2 μM pyrene actin filaments with 0.12 μM myosin V-1IQ (curve b) or buffer alone (curve a). The smooth lines through the raw data are the best fits to single exponentials (kobs = 107 s−1 for curve b). (A) Dependence of kobs on actin filament concentration. Error bars represent ± 1 SD (n = 3–6). (B Inset) Time course of fluorescence change after mixing 1.7 μM pyrene actin filaments with 0.15 μM myosin V-1IQ-ADP (curve b) or buffer alone (curve a). kobs = 8.2 s−1 for curve b. (B) Dependence of kobs on actin filament concentration.
Myosin V-1IQ dissociation from actin was measured by competition with a 40-fold excess of unlabeled actin. Time courses fit single exponentials with k+10 = 0.032 (± 0.001) s−1 for myosin V-1IQ-ADP and k+6 = 3.6 (± 0.1) × 10−4 s−1 in the absence of nucleotide (Table 1). The actomyosin V-1IQ dissociation constants determined from the ratio of the rate constants are K6 = 4.9 (± 0.4) × 10−12 M for myosin V-1IQ and K10 = 7.6 (± 0.3) × 10−9 M for myosin V-1IQ-ADP so ADP reduces the actin affinity of myosin V-1IQ ≈1,200-fold. ADP lowers the affinities of smooth and skeletal myosin only 5-fold (20).
ATP-Induced Population of the Weakly Bound States.
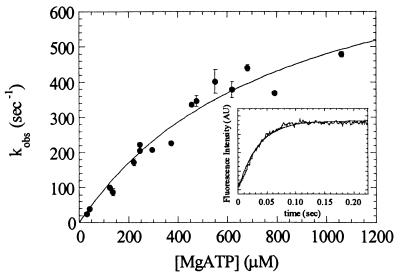
Pyrene fluorescence was used to monitor the ATP-induced population of the weak binding states of myosin (21). Concentrations lower than the KATPase (Table 1) were used to ensure ATP-induced dissociation of myosin V-1IQ from actin. MgATP increases the fluorescence of 0.5 μM pyrene-actomyosin V-1IQ to a level that is 80–100% that of pyrene-actin alone. The time courses follow single exponentials (Fig. 2 Inset) with rates that depend hyperbolically on the MgATP concentration (Fig. 2). The mechanism of ATP-induced fluorescence enhancement was modeled as:
 |
2 |
where AM(ATP) is the quenched collision complex in rapid equilibrium (K1′) with free nucleotide that isomerizes (k2′) to the high fluorescence A*M-ATP. The maximum rate (k2′) is 870 (± 130) s−1 and K1′ = 815 (± 200) μM. The association rate constant for MgATP binding to actomyosin V-1IQ obtained from the initial slope (K1′k2′) is 0.9 (± 0.1) μM−1⋅s−1 and agrees with the value of 0.9 (± 0.1) μM−1⋅s−1 measured with mantATP (Table 1). The rates are comparable to brush-border (17) and Acanthamoeba (15) myosin-I but slower than skeletal and smooth S1 (20).
Figure 2.
MgATP-induces population of the weakly bound states. Dependence of kobs on MgATP concentration. Error bars represent ± 1 SD (n = 3–5 from four different preparations). (Inset) Time course of fluorescence enhancement after mixing 30 μM MgATP with 1.25 μM pyrene acto-myosin V-1IQ. The smooth line is the best fit to a single exponential with a kobs of 29 s−1.
ATP Binding to Myosin V-1IQ by Tryptophan and MantATP Fluorescence.
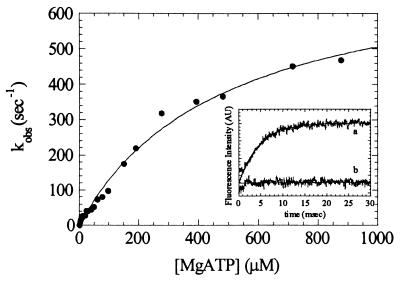
As demonstrated for other myosins, MgATP binding enhances the intrinsic tryptophan fluorescence of myosin V-1IQ (Fig. 3 Inset). Time courses follow single exponentials at rates up to 450 s−1 before saturation (Fig. 3). There is no indication of a biphasic fluorescence transient even at MgATP concentrations up to 1 mM. The data are modeled as a two-step reaction with formation of a collision complex [M(ATP)] followed by a conformational change to a high-fluorescence complex (M*.ATP):
 |
3 |
The association rate constant for MgATP binding to myosin V-1IQ (K1k2) determined from the initial slope is 1.6 (± 0.2) μM−1⋅s−1. The fluorescent nucleotide mantATP binds to myosin V-1IQ in the absence of actin by a similar mechanism and yields the same association rate constant (K1k2 = 1.5 (± 0.2) μM−1⋅s−1).
Figure 3.
Kinetics of MgATP binding to myosin V-1IQ by tryptophan fluorescence. Dependence of kobs on MgATP concentration. Points are the average of 1–3 transients. (Inset) Time course of intrinsic tryptophan fluorescence change after mixing 0.5 μM myosin V-1IQ with 200 μM MgATP (curve a) or buffer alone (curve b). The smooth line is the best fit to a single exponential with a kobs of 219 s−1.
The maximum rate of the fluorescence change determined by fitting the data to an hyperbola is k2 = 750 (± 45) s−1. For skeletal, smooth and Dictyostelium (20) myosin II, the maximum rate of fluorescence enhancement reports the rate of ATP hydrolysis (k+3 + k−3; Scheme S1). Although the contributions of individual tryptophans to the fluorescence signal have not established, it has been proposed (22) that the Trp510 of skeletal S1 reports the conformational change that precedes ATP hydrolysis. Because myosin V-1IQ contains this conserved tryptophan (Trp484), we suggest that the maximum rate corresponds to the rate of ATP hydrolysis in the absence of actin (k+3 + k−3).
ATP Hydrolysis.
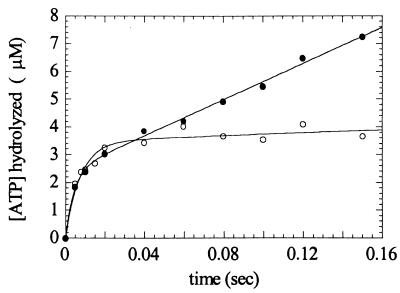
The rates of ATP hydrolysis in the presence (k+3′ + k−3′) and absence of actin (k+3 + k−3) were measured directly by quench-flow (Fig. 4). There is a rapid initial burst of ATP hydrolysis, followed by a slower linear phase that has an actin-dependent rate. In the absence of actin, the rate of the Pi burst (k+3 + k−3) fits a single exponential with a rate of 120 s−1 at 100 μM MgATP. The amplitude of the burst (B) is one Pi/myosin, suggesting that the prehydrolysis intermediates are not significantly populated during the steady-state. In the presence of 7.5 μM actin, the rate of the Pi burst (k+3′ + k−3′) fits a single exponential with a rate of 120 s−1, and B = 0.84 Pi/myosin. If we assume that B = K3/(1 + K3), then K3 equals 5.3 (Table 1). The linear portion of this curve confirms the steady-state ATPase value of 12 s−1⋅head−1 (Table 1). Because the rate of the Pi burst was the same in the absence and presence of actin may indicate that the myosin V-1IQ rapidly detached from actin after ATP association. This interpretation is supported by experiments below.
Figure 4.
Kinetics of MgATP hydrolysis by quench-flow. Time course of ADP-Pi formation after mixing 3.2 μM myosin V-1IQ in the presence (●) or absence (○) of 7.5 μM actin filaments with 100 μM MgATP. The smooth lines are the best fits to a single exponentials with a slope. Points are the average of 2–3 Pi determinations.
At the ATP concentration used in these experiments (100 μM), hydrolysis (k+3 + k−3) is limited by the rate of nucleotide binding (K1k2 and K1′k2′). However, even at this nucleotide concentration, ATP hydrolysis in the presence and absence of actin is significantly faster than actin-activated myosin V-1IQ turnover rate of 12 s−1 (Table 1).
ADP Binding and Dissociation by MantADP Fluorescence.
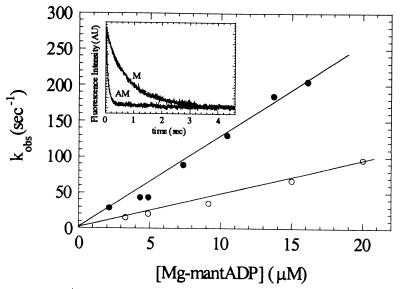
The fluorescence enhancement of mantADP upon binding to myosin was used to measure the affinity and rates of ADP binding to myosin V-1IQ. Time courses of mantADP binding to myosin V-1IQ and acto-myosin V-1IQ follow single exponentials with rates that depend linearly on the concentration of nucleotide (Fig. 5). The second- order rate constants determined from the slopes of kobs vs. nucleotide concentration are k−5 = 4.6 (± 0.2) μM−1⋅s−1 for mantADP binding to myosin V-1IQ and k−5′ = 12.6 (± 0.4) μM−1⋅s−1 for binding to actomyosin V-1IQ. MantADP dissociation from myosin V-1IQ is increased by actin from k+5 = 1.2 s−1 to k+5′ = 11.7 s−1 (Fig. 5 Inset). The rate of ADP dissociation from actomyosin V-1IQ (k+5) is the same as the actin-activated steady-state ATPase rate (Table 1), suggesting that ADP release is rate-limiting.
Figure 5.
Kinetics of mantADP binding to myosin V-1IQ and acto-myosin V-1IQ. Dependence of mantADP binding to myosin V-1IQ (○) or acto-myosin V-1IQ (●). The kobs were determined from the fits of the time courses to single exponentials. (Inset) Time course of mantADP dissociation from acto-myosin V-1IQ (curve AM) and myosin V-1IQ (curve M). The rate constants for mantADP dissociation (k−) determined from fits to single exponentials are 1.24 (± 0.01) s−1 for myosin V-1IQ and 11.7 (± 0.2) s−1 for acto-myosin V-1IQ. Fluorescence is normalized for clarity. Points are the average of 2–4 transients.
From the ratio of rate constants we calculate ADP affinities of K5 = 0.27 (± 0.01) μM for myosin V-1IQ and K5′ = 0.93 (± 0.03) μM for actomyosin V-1IQ (Table 1). Equilibrium titrations give a comparable dissociation constant of K5′ = 0.7 (± 0.1) μM for actomyosin V-1IQ (Table 1). Therefore, actin reduces the affinity of myosin V-1IQ for ADP only ≈3-fold even though it increases the dissociation rate by an order of magnitude. The affinity is maintained by favoring ADP association when bound to actin. The affinities are well below the range of physiological ADP concentrations (23).
ADP Dissociation from Actomyosin V-1IQ.
The rate of ADP dissociation from pyrene-actomyosin V-1IQ was measured by monitoring the rate of enhancement of pyrene fluorescence upon ATP binding according to the following mechanism (24):
 |
4 |
 |
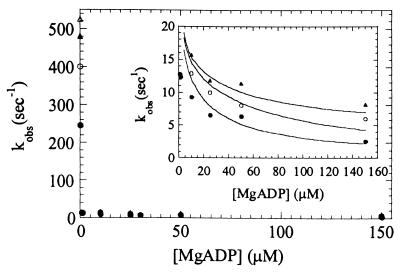
In the presence of excess ATP the population of the A*M.ATP state is limited by ADP release. Actomyosin V-1IQ (0.5 μM) was equilibrated with a range of MgADP concentrations and mixed with 0.3–1.4 mM MgATP (Fig. 6). By pyrene fluorescence, myosin V-1IQ-ADP is bound strongly to actin before mixing. The time course of the fluorescence increase after mixing with MgATP is best fit to two exponentials at substoichiometric ADP concentrations and to a single exponential at [ADP] > [myosin V-1IQ]. This behavior is the result of the slow release of ADP from actomyosin V-1IQ (Fig. 5 Inset). As a result, the reaction cannot be modeled as ADP binding to actomyosin V-1IQ (K5′) in rapid equilibrium as is the case for other characterized myosins (15).
Figure 6.
ADP inhibits population of the weakly bound states induced by MgATP. The rates of pyrene fluorescence increase after mixing 300 μM (●), 700 μM (○), or 1.4 mM (▴) MgATP with 0.5 μM acto-myosin V-1IQ equilibrated with the indicated [MgADP] (after mixing). Points are the average of 1–3 transients. The smooth lines through the data in the inset are simulations generated as described in the text.
We performed kinetic simulations of Scheme 4 by using our experimentally determined rate constants K1′, k2′, k+5′, and k−5′ (Table 1), and the experimental ADP and ATP concentrations. Simulations reported the transient population of the A*M.ATP state. The rates of the simulated transients at each condition were plotted (Fig. 6 Inset, solid line) and show excellent agreement with the experimental data. Therefore, (a) mantADP and pyrene-actin measurements are reporting the same kinetic transitions, and (b) the fluorescent modification of ADP and actin are not significantly altering the observed rate constants. Thus we can model the ADP and ATP binding and dissociation reactions, and we can confidently report the effective rate constants (Table 1).
Phosphate Release and the Weak to Strong Transition.
We performed double-mix stopped-flow experiments to determine the rate that limits the transition between the weak-binding and strong-binding states of myosin V-1IQ. The weak to strong transition as reported by pyrene-actin fluorescence is believed to coincide with the force-generating power stroke. The rate of the weak to strong transition has never been measured directly for any myosin, but it is believed to be rate-limiting in the ATPase cycle (25). The weak to strong transition can be measured directly by a single turnover experiment if either (a) myosin-V-1IQ does not dissociate from actin during the ATPase cycle, or (b) the rate of myosin V-1Q association (k-9; Scheme S1) is faster than the weak to strong transition.
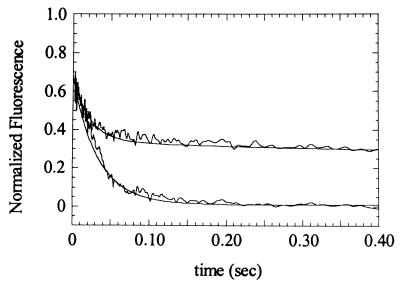
Because high concentrations of ADP inhibit the myosin V-1IQ ATPase activity, we were able to perform the following single-turnover experiment (all concentrations are after mixing): (a) an equilibrated mixture of 7.5 μM pyrene-actin and 2.3 μM myosin V-1IQ was mixed with 100 μM ATP; (b) the reaction was aged for 17 ms, allowing ATP to bind, hydrolyze, and populate the weak binding states (>95%), and (c) the reaction was quenched with 2 mM ADP to prevent free ATP from binding (upon ADP dissociation) and the enzyme from cycling. The observed transient fluorescence quench (Fig. 7, lower trace) is the transition from the high-fluorescence weak-binding states (Scheme S1) to the low-fluorescence strong-binding states (Scheme S1). The transient can be fitted to a single exponential with a rate of 32 s−1. This rate is >2× faster than the turnover rate of actin-activated myosin V-1IQ (15 s−1), indicating that ADP dissociation limits the acto-myosin V-1IQ ATPase rate. The final fluorescence amplitude indicates that all myosin heads are bound strongly to actin. Without a 2-mM ADP quench (Fig. 7, upper trace), ATP can rebind, the time courses do not follow single exponentials, and the final fluorescence is higher. The final pyrene-actin fluorescence indicates that 70% of the myosin-1IQ is strongly bound to actin, demonstrating that the monomeric myosin V-1IQ has a high duty ratio (0.7) at low actin and ADP concentrations. This result was confirmed by steady-state pyrene-quenching measurements (not shown).
Figure 7.
Determination of the rate constant for transition from weakly bound to strongly bound states by sequential mixing. Measurements and simulations (smooth lines) were made as described in the text. Fluorescence under rigor conditions is set to zero (not shown for clarity). Final conditions at t = 0 sec were 2.3 μM myosin V-1IQ, 7.5 μM pyrene-actin, 100 μM MgATP, 2 mM MgADP (lower trace only), 25°C.
Kinetic simulations (see Materials and Methods) using the experimentally determined rate constants (Table 1) and the rate of 32 s−1 before the transition between the weak and strong-binding states show excellent agreement with the experimental data obtained in the presence and absence of 2 mM ADP (Fig. 7, solid lines), thus confirming our experimentally determined rate constants (Table 1), and showing that the rate-limiting step in the acto-myosin V-1IQ ATPase cycle occurs after the weak to strong transition.
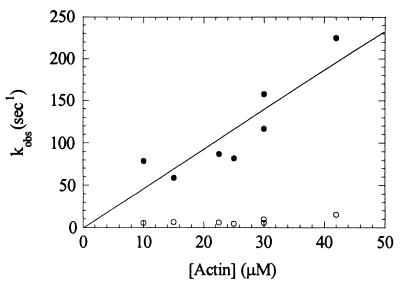
To determine whether the rate of 32 s−1 is a direct measure of the weak to strong transition, rather than the rate of dissociated myosin V-1IQ rebinding actin, single turnover experiments must be performed at several actin concentrations. However, that is not practical because of the large quantity of protein required for the experiments. Phosphate release is thought to occur either concomitant with or immediately after the weak to strong transition (26). Thus the direct measurement of Pi release (k4′; Scheme S1) places a lower limit on the rate of the weak to strong transition. Therefore, we measured the rate of Pi release from actomyosin V-1IQ at several actin concentrations (Fig. 8). The Pi release rate was shown (a) to depend on actin concentration and (b) to be >250 s−1. We calculate the second-order rate constant for M.ADP.Pi binding to actin to be k-9 = 4.7 (± 0.4) μM−1⋅s−1, which suggests that the rate of 32 s−1 observed in Fig. 7 represents rebinding of the myosin V-1IQ-ADP.Pi complex to actin. Furthermore, when myosin V-1IQ was mixed simultaneously with >30 μM actin and 1 mM ATP, the observed rate of Pi release was >250 s−1 (data not shown). Therefore, the rates of ATP hydrolysis and Pi release are both >250 s−1.
Figure 8.
Kinetics of Pi release from 1IQ as a function of actin concentration. Myosin V 1IQ (4.0 μM) was mixed with 1 mM MgATP, aged for 14 ms to populate the weak-binding states then mixed with a solution of actin filaments and Pi-binding protein. Time courses fit two exponentials. The fast rate (●) corresponds to a phosphate burst during the first turnover of ATP with a stoichiometry of one Pi/myosin and the slow rate (○) to yields the steady-state ATPase rate at 1 μM ADP. Final concentrations at t = 0 were 1.0 μM 1IQ, 250 μM MgATP, 10 μM Pi-binding protein, and the indicated actin filament concentrations.
Discussion
The key features of the myosin V kinetic mechanism are: (a) rate-limiting ADP release when bound to actin, (b) a high ADP affinity, both on and off actin, (c) rapid ATP hydrolysis, both in the presence and absence of actin, and (d) extremely rapid Pi release on actin. In combination, these kinetic adaptations generate a duty ratio (the fraction of the overall ATPase cycle that myosin V-1IQ is strongly bound to actin) of 0.7 at 25°C, which is greater than that of any previously characterized myosin.
ADP Release.
The ADP dissociation rate from myosin V on actin (12–16 s−1) is virtually identical to the maximal actin-steady-state actin-activated ATPase rate (12–15 s−1), implying that ADP release is the rate-limiting step in the ATPase cycle. Indeed, all of the other rates within the cycle (Table 1) are faster than ADP release. The high ADP affinity (0.9 μM) of myosin V, caused in part by a rapid ADP association rate, results in a significant inhibition of the ATPase rate at physiological ADP (12–50 μM) concentrations (23). This inhibition occurs at physiological ATP concentrations and may contribute to an increased duty ratio under cellular conditions.
Thermodynamic Balance of the Actomyosin V-1IQ Interaction.
Four equilibrium constants (K5, K′5, K6, and K10) define the interaction of myosin V-1IQ with ADP and actin filaments (Scheme 5).
 |
5 |
The product of the equilibrium constants in a cyclic path must equal one. Using our experimentally determined rate and equilibrium constants (Table 1), we obtain a product of 0.0022. Such a large discrepancy may be caused by additional intermediates or side reactions at any point within the square. However, the most likely explanation for the discrepancy is that ADP release by actomyosin V is a two-step process involving an isomerization between two ADP states not resolved by our measurements:
 |
6 |
This situation is believed to occur in smooth muscle myosin (20) and has been shown for brush-border myosin I (17), both of which show a light chain domain movement correlated with the transition from a state that binds ADP to the rigor state (27). The speculated purpose of this isomerization is to create strain-dependent ADP release. As has been proposed for smooth muscle myosin, this strain dependence will slow or prevent ADP release until the power stroke is complete. For a two-headed myosin V molecule, it could serve two purposes. The first would be to prevent ADP release until the power stroke was complete, analogous to the situation in smooth muscle. A second possible role would be in coordinating the two heads (i.e., pulling on a head might accelerate ADP release).
The Duty Ratio.
For a two-headed myosin V molecule to be processive, it must be shown that a single-headed molecule spends a significant fraction of its ATPase cycle strongly bound to actin (duty ratio >0.5), thus supporting the possibility of a two-headed molecule having a duty ratio of 1.0 (i.e., one head always remains attached to actin). Using our experimentally determined rate constants (Table 1), we find that myosin V-1IQ satisfies this requirement for processivity. At high ATP concentrations (>0.1 mM) the duty ratio (i.e., the fraction of myosin V-1IQ heads strongly bound to actin) can be expressed as k4app/(k4app + k+5′), where k4app is the apparent rate of the weak to strong transition. Therefore, at 7.5 μM actin (k4app = 32 s−1; Fig. 7), we calculate the duty ratio to be 0.67, which is in excellent agreement with our direct measurement of the duty ratio (0.7) by quenching of pyrene-actin fluorescence by nucleotide-bound myosin V-1IQ (Fig. 7, upper trace; see Results). Note that the rate of entry into the strong binding states is limited by the rate of myosin V-1IQ.ADP.Pi binding to actin (Fig. 8), thus the duty ratio of myosin V-1IQ is a function of the actin concentration. Therefore, under physiological conditions (two-headed myosin molecule and high actin concentration), the duty ratio of myosin V is likely to be greater than 0.7.
Comparison to Other Myosins.
The ADP release specializations discussed above are not unique to myosin V. Although the ADP release rate and ADP affinity, respectively, are much slower and tighter than for skeletal muscle myosin II (20), they are only slightly different from those observed for smooth muscle myosin II (20). The profound difference in myosin V compared with any other characterized myosin is that a slow (rate-limiting) ADP dissociation rate exists in a myosin with rapid rates of ATP hydrolysis and Pi release rate (weak to strong transition). For myosin I and myosin II, as ADP release is made slower, the other rate constants in the cycle also are slowed, preserving a low duty ratio. For both skeletal and smooth muscle myosin II, the steady-state actin-activated ATPase rate in solution is limited by a combination of the hydrolysis rate and the Pi release (weak to strong transition) rate. The ADP release rate is 1–2 orders of magnitude faster.
Conclusions.
The kinetics of myosin V are a sharp contrast to those of smooth and skeletal myosin. Myosin V hydrolyzes ATP at >250 s−1 (and perhaps as high as 750 s−1; see Table 1) when dissociated from actin, and releases Pi on actin at >250 s−1, while releasing ADP when bound to actin at only 12–16 s−1. Thus the critical kinetic adaptation of myosin V is to accelerate the rates after ATP binding and preceding strong attachment to actin (which are faster than the corresponding rates of skeletal muscle myosin II), while slowing the rate that controls transition out of the strong state (the ADP release rate is slower than that of smooth muscle myosin II). This degree of disproportional tuning of rates has never been observed for another myosin and is a necessary adaptation for a processive myosin. Thus, because of unique kinetic adaptations, each head of the two-headed myosin V molecule possesses a duty ratio that is consistent with the native myosin V molecule being a processive motor.
Acknowledgments
We thank Dr. Ed Taylor (University of Chicago) for providing mant-ATP, Fred Brown and Mary Studeny for assistance with baculovirus stocks, and Dr. Annemarie Weber for the fluorimeter. E.M.D.L.C. is a Burroughs Wellcome Fellow of The Life Sciences Research Foundation. This work was supported by National Institutes of Health Grants GM57247 to E.M.O. and AR35661 to H.L.S.
Footnotes
This paper was submitted directly (Track II) to the PNAS office.
References
- 1.Larson R E, Pitta D E, Ferro J A. Brazilian J Med Biol Res. 1988;21:213–217. [PubMed] [Google Scholar]
- 2.Espindola F S, Espreafico E M, Coelho M V, Martins A R, Costa F R C, Mooseker M S, Larson R E. J Cell Biol. 1992;118:359–368. doi: 10.1083/jcb.118.2.359. [DOI] [PMC free article] [PubMed] [Google Scholar]
- 3.Nascimento A A C, Cheney R E, Tauhata S B F, Larson R E, Mooseker M S. J Biol Chem. 1996;271:17561–17569. doi: 10.1074/jbc.271.29.17561. [DOI] [PubMed] [Google Scholar]
- 4.Mehta A D, Rock R S, Rief M, Spudich J A, Mooseker M S, Cheney R E. Nature (London) 1999;400:590–593. doi: 10.1038/23072. [DOI] [PubMed] [Google Scholar]
- 5.Hill K L, Catlett N L, Weisman L S. J Cell Biol. 1996;135:1535–1549. doi: 10.1083/jcb.135.6.1535. [DOI] [PMC free article] [PubMed] [Google Scholar]
- 6.Prekeris R, Terrian D M. J Cell Biol. 1997;137:1589–1601. doi: 10.1083/jcb.137.7.1589. [DOI] [PMC free article] [PubMed] [Google Scholar]
- 7.Titus M A. Curr Biol. 1997;7:R301–R304. doi: 10.1016/s0960-9822(06)00143-6. [DOI] [PubMed] [Google Scholar]
- 8.Vale R D, Funatsu T, Pierce D W, Romberg L, Harada Y, Yanagida T. Nature (London) 1996;380:451–453. doi: 10.1038/380451a0. [DOI] [PMC free article] [PubMed] [Google Scholar]
- 9.Pollard T D. J Cell Biol. 1984;99:769–777. doi: 10.1083/jcb.99.3.769. [DOI] [PMC free article] [PubMed] [Google Scholar]
- 10.MacLean-Fletcher S, Pollard T D. Biochem Biophys Res Commun. 1980;96:18–27. doi: 10.1016/0006-291x(80)91175-4. [DOI] [PubMed] [Google Scholar]
- 11.Hopp T P, Prickett K S, Price V, Libby R T, March C J, Cerretti P, Urdal D L, Conlon P J. Bio/Technology. 1988;6:1205–1210. [Google Scholar]
- 12.Sweeney H L, Rosenfeld S S, Brown F, Faust L, Smith J, Xing J, Stein L A, Sellers J R. J Biol Chem. 1998;273:6262–6270. doi: 10.1074/jbc.273.11.6262. [DOI] [PubMed] [Google Scholar]
- 13.Pollard T D. Methods Enzymol. 1982;85:123–130. doi: 10.1016/0076-6879(82)85015-5. [DOI] [PubMed] [Google Scholar]
- 14.White H D. Methods Enzymol. 1982;85:698–708. doi: 10.1016/0076-6879(82)85057-x. [DOI] [PubMed] [Google Scholar]
- 15.Ostap E M, Pollard T D. J Cell Biol. 1996;132:1053–1060. doi: 10.1083/jcb.132.6.1053. [DOI] [PMC free article] [PubMed] [Google Scholar]
- 16.White H D, Belknap B, Webb M R. Biochemistry. 1997;36:11828–11836. doi: 10.1021/bi970540h. [DOI] [PubMed] [Google Scholar]
- 17.Jontes J D, Milligan R A, Pollard T D, Ostap E M. Proc Natl Acad Sci USA. 1997;94:14332–14337. doi: 10.1073/pnas.94.26.14332. [DOI] [PMC free article] [PubMed] [Google Scholar]
- 18.Cooke R, Franks K. Biochemistry. 1980;19:2265–2269. doi: 10.1021/bi00551a042. [DOI] [PubMed] [Google Scholar]
- 19.Taylor E W. J Biol Chem. 1991;266:294–302. [PubMed] [Google Scholar]
- 20.Cremo C R, Geeves M A. Biochemistry. 1998;37:1969–1978. doi: 10.1021/bi9722406. [DOI] [PubMed] [Google Scholar]
- 21.Geeves M A, Jeffries T E. Biochem J. 1988;256:41–46. doi: 10.1042/bj2560041. [DOI] [PMC free article] [PubMed] [Google Scholar]
- 22.Rayment I, Smith C, Yount R G. Annu Rev Physiol. 1996;58:671–702. doi: 10.1146/annurev.ph.58.030196.003323. [DOI] [PubMed] [Google Scholar]
- 23.Roth K, Weiner M W. Magn Reson Med. 1991;22:505–511. doi: 10.1002/mrm.1910220258. [DOI] [PubMed] [Google Scholar]
- 24.White H D, Taylor E W. Biochemistry. 1976;15:5818–5826. doi: 10.1021/bi00671a020. [DOI] [PubMed] [Google Scholar]
- 25.White H D, Belknap B, Webb M R. Biochemistry. 1997;36:11828–11836. doi: 10.1021/bi970540h. [DOI] [PubMed] [Google Scholar]
- 26.Dantzig J A, Goldman Y E, Millar N C, Lacktis J, Homsher E. J Physiol. 1992;451:247–278. doi: 10.1113/jphysiol.1992.sp019163. [DOI] [PMC free article] [PubMed] [Google Scholar]
- 27.Whittaker M, Wilson-Kubalek E M, Smith J E, Faust L, Milligan R A, Sweeney H L. Nature (London) 1995;378:748–751. doi: 10.1038/378748a0. [DOI] [PubMed] [Google Scholar]


