

Abstract
The molecular mechanism underlying the export of G protein-coupled receptors (GPCRs) from the endoplasmic reticulum (ER) remains largely unknown. In this manuscript, we investigated the role of Sar1 GTPase, which coordinates the assembly and budding of COPII-coated vesicles, in the cell-surface targeting, signaling and ER export of α2B-adrenergic (α2B-AR), β2-AR and angiotensin II type 1 receptors (AT1R). The cell-surface expression of α2B-AR, β2-AR and AT1R, and receptor-mediated ERK1/2 activation were significantly attenuated by the GTP-bound mutant Sar1H79G, suggesting that export from the ER of these receptors is mediated through the Sar1-dependent COPII-coated vesicles. Interestingly, subcellular distribution analyses showed that α2B-AR and AT1R were highly concentrated at discrete locations near the nucleus in cells expressing Sar1H79G, whereas β2-AR exhibited an ER distribution. These data indicate that Sar1-catalyzed efficient GTP-hydrolysis differentially regulates ER export of adrenergic and angiotensin II receptors. These data provide the first evidence indicating distinct mechanisms for the recruitment of different GPCRs into the COPII vesicles on the ER membrane.
1. Introduction
G protein-coupled receptors (GPCRs) are a superfamily of cell surface receptors which couple to heterotrimeric G-proteins and regulate multiple downstream effectors such as adenylyl cyclases, phospholipases, protein kinases and ion channels [1-4]. All GPCRs share common structural features with a hydrophobic core of seven transmembrane-spanning α-helices, three intracellular loops, three extracellular loops, an N-terminus outside the cell and a C-terminus inside the cell. It has been well documented that the magnitude of receptor-elicited cellular response to a given signal is modulated by elaborately regulated intracellular trafficking which dictates the level of the receptor expression at the plasma membrane and the targeting of the receptor to specific subcellular compartments [5-8]. The life of GPCRs begins at the endoplasmic reticulum (ER) where they are synthesized, folded and assembled. Properly folded receptors are transported from the ER to the ER-Golgi intermediate complex (ERGIC), the Golgi apparatus and the trans-Golgi network (TGN). During their migration, receptors undergo post-translational modifications to attain mature status [5]. Mature receptors then move from the TGN to the plasma membrane, their functional destination. At the plasma membrane GPCRs may undergo internalization upon stimulation by their ligands. The internalization involves phosphorylation of GPCRs by G protein receptor kinases and subsequent binding of the phosphorylated receptors to arrestins, which serve as adaptor proteins recruiting components of the transport machinery to the clathrin-coated pits, initiating formation of the early endosome [9]. The internalized receptors in the early endosome may be sorted to the lysosome for degradation or to the recycling endosome for return to the plasma membrane [10].
Protein export from the ER is mediated through COPII-coated vesicles containing of a small GTPase Sar1 and the heterodimeric Sec23/24 and Sec13/31 complexes [11-14]. It has been well demonstrated that GDP/GTP exchange and GTP hydrolysis by Sar1 GTPase play a crucial role in the regulation of formation and budding of COPII-coated vesicles on the ER membrane. Assembly of the COPII coat takes place on the ER membrane at discrete locations called ER exit sites and is initiated by the exchange of GDP for GTP on Sar1 GTPase, which is catalyzed by the ER-localized transmembrane guanine nucleotide exchange factor Sec12. GTP activation of Sar1 GTPase then recruits the Sec23/24 complex to the ER membrane forming a functional prebudding complex. The prebudding complex containing GTP-bound Sar1 and Sec23/24 are then clustered by Sec13/31 forming the COPII vesicles. Hydrolysis of GTP to GDP by Sar1 GTPase results in the dissociation of Sar1 GTPase from the prebudding complex and facilitates the release of the COPII vesicles from the ER membrane [14-18].
ER export of GPCRs represents the first step in intracellular trafficking of the receptors and influences the kinetics of receptor maturation and cell-surface targeting [19,20]. Interestingly, recent studies have demonstrated that β2-adrenergic receptor (β2-AR) may form signaling complexes with G protein βγ subunits and adenylyl cyclase II in the ER [21,22]. However, compared with extensive studies on the events involved in the endocytic and recycling pathways, molecular mechanism underlying the ER export and targeting to the cell surface of GPCRs and regulation of receptor signaling by export trafficking are relatively less understood. The progress achieved over the past few years indicates that GPCR export from the ER is a highly regulated process. First, GPCR export from the ER is directed by highly conserved motifs identified exclusively in the membrane-proximal C-termini [23-27]. Second, GPCR dimerization (homo- and hetero-dimerization) plays an important role in proper receptor folding and assembly to pass through the ER quality control mechanism, in addition to regulating ligand binding, signal transduction and internalization [28,29]. Third, GPCR export from the ER is modulated by direct interactions with multiple regulatory proteins such as ER chaperones, accessory proteins and receptor activity modifying proteins, which may stabilize receptor conformation, facilitate receptor maturation and promote receptor delivery to the plasma membrane [8,19].
To define the mechanism underlying the export from the ER and transport from the ER to the cell surface of GPCRs, we focused our effort on angiotensin II type 1 receptor (AT1R), β2-AR, α1-AR and α2-AR, representative members of the GPCR superfamily, which couple to different G proteins and initiate distinct signaling pathways. We previously determined the role of Rab1, a Ras-like small GTPase that specifically coordinates protein transport from the ER to the Golgi [30,31], in the transport of these receptors. We demonstrated that the transport from the ER to the cell surface of AT1R, β2-AR and α1-AR is dependent on Rab1, whereas the transport of α2B-AR is independent of Rab1 [32-34]. We have recently reported that the transport of α2B-AR from the ER to the cell surface is also independent of Rab6 [35], a small GTPase involved in regulation of retrograde protein transport from the Golgi to the ER. These data indicate that the cell surface targeting of different GPCRs may be mediated through distinct pathways and suggest a novel pathway mediating α2B-AR targeting to the cell surface. We have identified the highly conserved F(X)6LL motif which is required for the export of AT1R and α2B-AR from the ER [26,27] and the YS motif in the N-termini close to the first transmembrane domain which is essential for α2-AR export from the Golgi [36]. In this manuscript we sought to further define the mechanism underlying the export of GPCRs from the ER by investigating the role of the ER-derived COPII transport vesicles in mediating GPCR export from the ER through manipulating the function of Sar1 GTPase. We demonstrated that expression of the constitutively active GTP-bound mutant Sar1H79G similarly inhibits the cell-surface expression and signaling of α2B-AR, β2-AR and AT1R, but differentially modifies their subcellular localization. These data indicate that efficient GTP hydrolysis by Sar1 GTPase selectively regulates GPCR export from the ER and provide the first evidence indicating different regulatory roles for Sar1-coordinated COPII vesicle assembly on the ER membrane in the export of distinct GPCRs.
2. Experimental procedures
2.1. Materials
Rat α2B-AR in vector pcDNA3, human β2-AR in vector pBC and rat AT1R in vector pCDM8 were kindly provided by Dr. Stephen M. Lanier, Dr. John D. Hildebrandt (Department of Pharmacology and Experimental Therapeutics, Medical University of South Carolina, Charleston, SC) and Kenneth E. Bernstein (Department of Pathology, Emory University, Atlanta, GA), respectively. AT1R, α2B-AR and β2-AR tagged with green fluorescent protein (GFP) at their C-termini and α2B-AR tagged with the HA epitope at its N-terminus were generated as described previously [32]. These epitope tagged receptors have characteristics similar to their wild-type receptors [32]. Sar1, the GTP-bound mutant Sar1H79G and antibodies against Sar1 were gifts from Dr. William E. Balch (Institute for Childhood and Neglected Diseases, Scripps Research Institute, La Jolla, CA). Antibodies against phospho-ERK1/2 and β-actin were purchased from Santa Cruz Biotechnology, Inc. (Santa Cruz, CA) and antibodies against ERK1/2 from Cell Signaling Technology. High affinity fluorescein-conjugated anti-HA antibody 3F10 was from Roche Applied Science (Mannheim, Germany). Anti-GM130 antibodies were from Transduction Laboratories (San Diego, CA). Alexa Fluor 594-labeled anti-mouse antibodies and 4,6-diamidino-2-phenylindole were obtained from Molecular Probes, Inc. (Eugene, OR). pDsRed2-ER, an ER marker, was from BD Biosciences (Palo Alto, CA). Isoproterenol (ISO) and UK14304 were obtained from Sigma (Saint Louis, MO). Human angiotensin II (Ang II) was purchased from Calbiochem. Penicillin/streptomycin, L-glutamine, and trypsin/EDTA were from Invitrogen. [3H]-CGP12177 (specific activity = 51 Ci/mmol), [3H]-RX821002 (41 Ci/mmol) and (3-(125I)-iodotyrosyl 4) angiotensin II ([125I]-Ang II) (2000 Ci/mmol) were purchased from Amersham Biosciences/GE Healthcare. All other materials were obtained as described elsewhere [26,32].
2.2. Cell Culture and Transient Transfection
HEK293T cells were cultured in Dulbecco's Modified Eagle's medium (DMEM) with 10% fetal bovine serum, 100 units/ml penicillin, and 100 μg/ml streptomycin. Transient transfection of the HEK293T cells was carried out using LipofectAMINE 2000 reagent (Invitrogen) as previously described [32]. The transfection efficiency was estimated to be greater than 70% based on the GFP fluorescence.
2.3. Radioligand Binding
Cell-surface expression of α2B-AR, β2-AR and AT1R in HEK293T cells was measured by ligand binding of intact live cells as previously described using [3H]-RX821002, [3H]-CGP12177 and [125I]-Ang II [33-37], respectively. Briefly, HEK293T cells were cultured 6-well dishes and transfected with 200 ng of the α2B-AR or β2-AR plasmid together with 800 ng of pcDNA3, Sar1 or Sar1H79G. After 6 h the cells were split into 12-well plates at a density of 4 × 10⁵ cells/well and cultured for an additional 24 h. For measurement of β2-AR expression at the cell surface, the cells were incubated with DMEM containing the ligand [3H]-CGP12177 at a concentration of 20 nM for 90 min at room temperature. Non-specific binding was determined by pre-incubation with alprenolol at a concentration of 20 μM for 30 min followed by incubation with [3H]-CGP12177 (20 nM) in the presence of alprenolol (20 μM). For measurement of α2B-AR expression at the cell surface, the cells were incubated with DMEM plus [3H]-RX821002 at a concentration of 20 nM for 90 min at room temperature. The non-specific binding was determined in the presence of rauwalscine (10 μM). The cells were washed twice with 1 ml of ice-cold PBS, and the cell surface-bound ligands were extracted by 1M NaOH treatment for 2 h. The radioactivity was counted by liquid scintillation spectrometry in 3.5 ml of Ecoscint A scintillation solution (National Diagnostics, Inc., Atlanta, GA).
For measurement of AT1R expression at the cell surface, HEK293T cells were cultured on 6-well plates and transfected with 0.5 μg of AT1R together with 1.5 μg of pcDNA3 or Sar1H79G. The cells then were split into 12-well plates and starved for 24 h followed by an incubation with 400 μl DMEM containing 125I-Ang II at a concentration of 20 pM for 5 h at 4°C to avoid AT1R internalization. The non-specific binding was determined in the presence of nonradioactive Ang II (3 μM). After washing the cells twice with 1 ml DMEM, the bound ligand was extracted by mild acid treatment (2 × 5 min with 0.5 ml buffer containing 50 mM glycine, and 125 mM NaCl, pH 3,). The radioactivity was counted in a γ-counter. All radioligand binding assays were performed in triplicate.
2.4. Flow Cytometric Analysis of Receptor Expression
For measurement of total receptor expression, HEK293T cells transfected with individual receptors were collected and resuspended in PBS containing 1% fetal calf serum at a density of 8 × 10⁶ cells/ml. Total receptor expression was determined by measuring total GFP fluorescence on a flow cytometer (BD Biosciences FACSCalibur) as described [32].
2.5. Immunofluorescence Microscopy
For fluorescence microscopic analysis of receptor subcellular localization, HEK293T cells were grown on coverslips pre-coated with poly-L-lysine in 6-well plates and transfected with 100 ng of GFP-tagged receptors with or without co-transfection with 400 ng of the pcDNA3 vector, Sar1 or Sar1H79G. For co-localization of GFP-tagged receptors with the ER marker pDsRed2, HEK293T cells grown on coverslips were transfected with 100 ng of GFP-tagged receptors and 100 ng of the ER marker pDsRed2-ER with or without 400 ng of the pcDNA3 vector or Sar1. The cells were fixed with 4% paraformaldehyde-4% sucrose mixture in PBS for 15 min and stained with 4, 6-diamidino-2-phenylindole for 5 min. The coverslips were mounted, and fluorescence was detected with a Leica DMRA2 epifluorescent microscope as described previously. Images were deconvolved using SlideBook software and the nearest neighbor deconvolution algorithm (Intelligent Imaging Innovations, Denver, CO) as described previously [27, 32]. For co-localization of GFP-tagged receptors with HA-tagged receptors or GM130, HEK293T cells were permeabilized with PBS containing 0.2% Triton X-100 for 5 min, and blocked with 5% normal donkey serum for 1 h. The cells were then incubated with antibodies against the epitope HA or GM130 (1:50) for 1 h. After washing with PBS (3 × 5 min), the cells were incubated with Alexa Fluor 594-labeled secondary antibody (1:2000 dilution) for 1 h at room temperature, and the fluorescence was analyzed as described above.
For co-localization of GFP-tagged receptors with the ER marker pDsRed2-ER in live cells, HEK293T cells were plated on 35-mm glass dishes pre-coated with poly-L-lysine and transiently transfected with GFP-tagged receptor and the ER marker pDsRed2-ER mixed in equal amounts (100 ng) with LipofectAMINE 2000 reagent as described above. One hour before imaging, culture medium was replaced with CO2-independent medium (Invitrogen) [36]. Images were obtained in a Zeiss Axiovert microscope (200M)
2.6. Measurement of ERK1/2 Activation
HEK293T cells were cultured on 10-cm dishes and transfected with 2 μg of receptor plasmids with or without con-transfection with 8 μg of the pcDNA3 vector, Sar1 or Sar1H79G. At 6-8 h after transfection, the cells were split into 6-well dishes and cultured for 24-30 h. The cells were starved for at least 2 h and then stimulated with agonists as indicated in the figure legends. Stimulation was terminated by addition of 1 × SDS gel loading buffer as described previously [32]. After solubilizing the cells, 20 μl of total cell lysates was separated by 12% SDS-PAGE. ERK1/2 activation was determined by Western blotting measuring the levels of phosphorylation of ERK1/2 with phospho-specific ERK1/2 antibodies.
2.7. Immunoblotting
Western blot analysis of protein expression was carried out as previously described [32]. HEK293T cell lysates were separated by SDS-PAGE and transferred onto polyvinylidene difluoride membranes. The signal was detected using ECL Plus (PerkinElmer Life Sciences) and a Fuji Film luminescent image analyzer (LAS-1000 Plus) and quantitated using the Image Gauge program (Version 3.4).
2.8. Statistical Analysis
Differences were evaluated using Student's t test, and P < 0.05 was considered as statistically significant. Data are expressed as the mean ± S.E.
3. Results
3.1. Effect of Transient Expression of Sar1H79G on the Cell-surface Expression and Signaling of AT1R, α2B-AR and β2-AR
Sar1 GTPase, through its abilities to undergo GDP/GTP exchange and hydrolyze GTP to GDP, plays a crucial role in regulating the assembly of the COPII-coated vesicles, which mediate the transport of newly synthesized proteins exclusively from the ER to the ERGIC. The function of Sar1 GTPase was manipulated by transiently expressing the constitutively active GTP-bound mutant Sar1H79G, which has been well characterized to inhibit protein transport from the ER [14-18]. We first determined the effect of transient expression of Sar1 and Sar1H79G on the overall and cell surface expression of α2B-AR, β2-AR and AT1R. Sar1 and Sar1H79G expression was determined by Western blotting using Sar1-specific antibodies (Fig. 1A). The total receptor expression was determined by measuring GFP signal using flow cytometry and the cell-surface expression of α2B-AR, β2-AR and AT1R in HEK239T cells quantitated by ligand binding in intact live cells. The cell-surface expression of α2B-AR, β2-AR and AT1R was markedly attenuated in cells expressing Sar1H79G and the individual receptor compared with cells expressing receptor alone. Sar1H79G similarly inhibited the cell-surface expression of α2B-AR, β2-AR or AT1R by 48%, 59% and 55%, respectively (Fig. 1B). In contrast, expression of wild-type Sar1 did not significantly influence the cell-surface expression of all three receptors (Fig. 1B). The overall expression of α2B-AR, β2-AR or AT1R was also not significantly altered by either Sar1 or Sar1H79G expression (Fig. 1B). These data indicate that the export from the ER and transport to the cell surface of α2B-AR, β2-AR and AT1R is mediated through Sar1-coordinated COPII-coated vesicles.
Fig. 1.

Effect of transient expression of Sar1 and Sar1H79G on the cell-surface expression of α2B-AR, β2-AR and AT1R. A, Western blot analysis of Sar1 and Sar1H79G expression. HEK293T cells cultured on 6-well plates were transfected with the pcDNA3 vector (control), Sar1 or Sar1H79G. Cell homogenates (30 μg) were separated by 12% SDS-PAGE and expression of endogenous Sar1 and transfected Sar1 and Sar1H79G was detected by Western blotting using anti-Sar1 antibodies. Two bands with similar apparent molecular weight revealed by Sar1 antibodies are probably Sar1a and Sar1b isoforms (upper panel). Expression of β-actin is used as a control for equal loading (lower panel). B, inhibition of the cell-surface expression of α2B-AR, β2-AR and AT1R by Sar1 and Sar1H79G. HEK293T cells were transfected with GFP-conjugated α2B-AR, β2-AR or AT1R together with the pcDNA3 vector (control), Sar1 or Sar1H79G mutant. The expression of α2B-AR, β2-AR or AT1R at the cell surface was determined by intact cell ligand binding using [3H]-RX821002, [3H]-CGP12177 and [125I]-Ang II, respectively, and total receptor expression by measuring GFP fluorescence using a flow cytometer as described under “Experimental procedures.” The mean values of specific ligand binding were 14863 ± 901, 15372 ± 1248 and 10583 ± 230 cpm (n = 3, each in triplicate) from cells transfected with α2B-AR, β2-AR or AT1R together with the pcDNA3 vector, respectively. The data shown are percentages of the mean value obtained from cells transfected with individual receptor and the pcDNA3 vector and are presented as the means ± S.E. of three experiments. *, P < 0.05 versus the cells transfected with respective receptor and the pcDNA3 vector.
We then determined if transient expression of Sar1 and Sar1H79G could influence receptor signaling by measuring activation of the mitogen-activated protein kinase pathway in response to stimulation with receptor agonists. The agonists UK14304 (Fig. 2A), ISO (Fig. 2B) and Ang II (Fig. 2C) stimulated ERK1/2 activation in a dose-dependent fashion in cells expressing α2B-AR, β2-AR and AT1R, respectively. ERK1/2 activation by the agonists was markedly compromised in cells expressing Sar1H79G and individual receptor as compared with cells expressing receptor alone (Fig. 2A, 2B and 2C). In contrast, agonist-mediated ERK1/2 activation was similar in cells expressing Sar1 and individual receptor as compared with cells expressing receptor alone (Fig. 2D) These data are consistent with the effect of Sar1 and Sar1H79G on the cell-surface expression of these receptors, and further indicate that cell-surface targeting and signaling of α2B-AR, β2-AR and AT1R are dependent on the function of Sar1 GTPase.
Fig. 2.

Effect of Sar1 and Sar1H79G on ERK1/2 activation by α2B-AR, β2-AR and AT1R. A, B and C. Effect of Sar1H79G on ERK1/2 activation. HEK293T cells transfected with GFP-tagged α2B-AR (A), β2-AR (B) or AT1R (C) together with pcDNA3 (control; squares) or Sar1H79G (triangles) were stimulated with increasing concentrations of UK14304 (0.01-10 μM) for 5 min (A), or isoproterenol (ISO; 0.01-10 μM) for 5 min (B) Ang II (1-1000 nM) for 2 min (C) at 37 °C. ERK1/2 activation was determined by Western blot analysis using phospho-specific ERK1/2 antibodies (ERK1/2-P). Left panels, representative blots of ERK1/2 activation (upper panels), total ERK1/2 expression (middle panels), and Sar1H79G expression (bottom panels); right panels, quantitative data expressed as percentages of ERK1/2 activation obtained from cells transfected with individual receptors and stimulated with 10 μM UK14304 (A), 10 μM ISO (B) or 1 μM Ang II (C) and are presented as the mean ± S.E. of three experiments. D. Effect of Sar1 on ERK1/2 activation. HEK293T cells transfected with GFP-tagged α2B-AR (left panel), β2-AR (middle panel) or AT1R (right panel) together with pcDNA3 (control) or Sar1 were stimulated with UK14304, isoproterenol and Ang II, respectively. Each experiment was repeated three times with similar results.
3.2. Differential Regulation of the Subcellular Distribution of AT1R, α2B-AR and β2-AR by Sar1H79G
We then determined the effect of Sar1H79G on the subcellular distribution of α2B-AR, β2-AR and AT1R. The receptors were conjugated with GFP at their C-termini and their subcellular localization at steady state was revealed by fluorescence microscopy analysis. As anticipated, AT1R, α2B-AR and β2-AR were expressed at the cell surface in cells transfected with the pcDNA3 vector and Sar1 (Fig. 3), which was confirmed by co-localization with tetramethylrhodamine-conjugated concanavalin A, a plasma membrane marker (data not shown). Consistent with the marked reduction in the cell-surface expression as measured by intact cell radioligand binding, α2B-AR, β2-AR and AT1R lost their cell-surface expression pattern in cells transfected with Sar1H79G. Interestingly, the subcellular localization of α2B-AR, β2-AR and AT1R was apparently different. Whereas α2B-AR and AT1R were highly concentrated at discrete locations near the nucleus, β2-AR exhibited an even distribution in the perinuclear region.
Fig. 3.
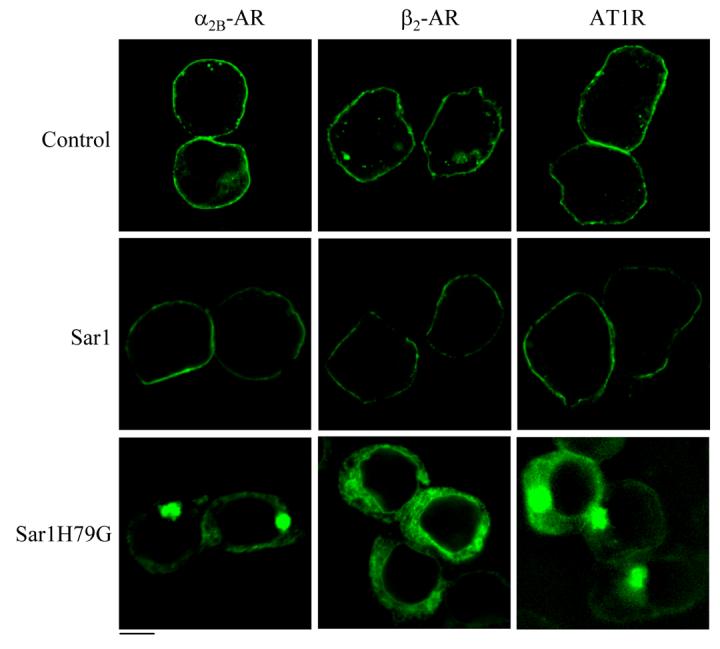
Effect of Sar1 and Sar1H79G on the subcellular distribution of α2B-AR, β2-AR and AT1R. HEK293T cells cultured on coverslips were transfected with GFP-conjugated α2B-AR, β2-AR or AT1R (40 ng) together with the pcDNA3 vector (control), Sar1 or Sar1H79G (400 ng). The subcellular distribution of the receptors was revealed by detecting GFP fluorescence as described under “Experimental procedures.” The data are representative images of at least five independent experiments. Scale bar, 10 μm.
To further confirm that the Sar1H79G mutant was capable of arresting α2B-AR, β2-AR and AT1R at distinct subcellular compartments, we determined the effect of Sar1H79G on the subcellular localization of two receptors tagged with different epitopes being expressed in the same cell. HA-α2B-AR and Sar1H79G were expressed together with AT1R-GFP or β2-AR-GFP in HEK293T cells. The effect of Sar1H79G on the subcellular distribution of AT1R-GFP and HA-α2B-AR or β2-AR-GFP and HA-α2B-AR was determined in the same transfected cells by fluorescence microscopy analysis following staining with anti-HA antibodies. β2-AR-GFP and AT1R-GFP were nicely co-localized with HA-α2B-AR at the cell surface in cells transfected with the pcDNA3 vector (Fig. 4). HA-α2B-AR was also extensively co-localized with AT1R-GFP in cells transfected with Sar1H79G (Fig. 4B). In contrast, HA-α2B-AR was not co-localized with β2-AR-GFP in Sar1H79G-transfected cells (Fig. 4A). Expression of Sar1 did not disrupt the co-localization of HA-α2B-AR with β2-AR-GFP (Fig. 4A) or AT1R-GFP (Fig. 4B). These data demonstrate that expression of GTP-bound Sar1H79G mutant induced an arrest of AT1R and α2B-AR in the same intracellular compartment, which is different from that where β2-AR accumulated. These data indicate that manipulation of the GTP hydrolysis of Sar1 GTPase differentially modifies the subcellular distribution of α2B-AR, β2-AR and AT1R,.
Fig 4.
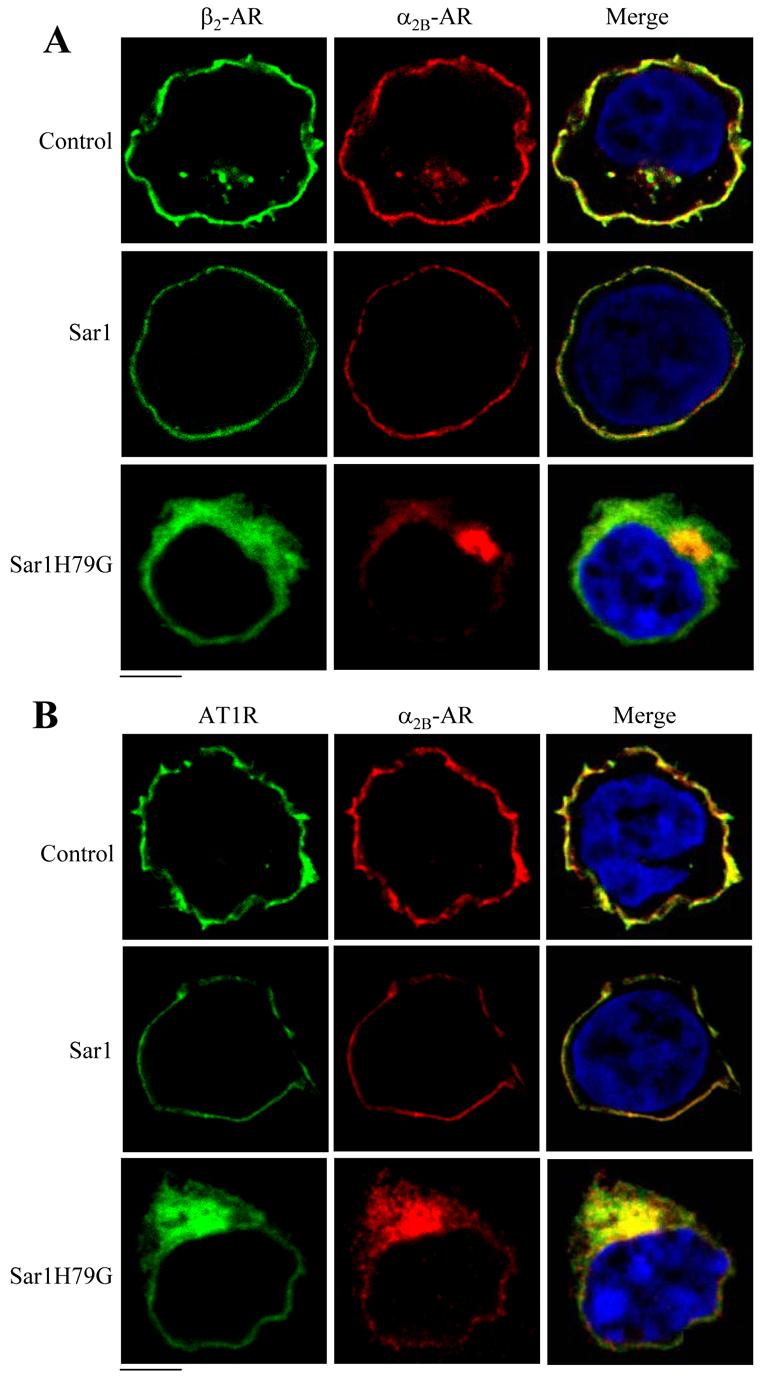
Effect of Sar1 and Sar1H79G on the subcellular distribution of α2B-AR, β2-AR and AT1R in the same transfected cells. HEK293T cells were transfected with β2-AR-GFP and HA-α2B-AR (A) or AT1R-GFP and HA-α2B-AR (B) together with pcDNA3 (control, upper panels), Sar1 (middle panels) or Sar1H79G (lower panels). The subcellular distribution of the receptors was detected by fluorescence microscopy following immunostaining with rhodamine-conjugated anti-HA antibodies as described under “Experimental procedure.” Green, β2-AR-GFP (A) and AT1R-GFP (B); red, HA-α2B-AR; blue, DNA staining by 4,6-diamidino-2-phenylindole (nucleus); yellow, co-localization of HA-α2B-AR with β2-AR-GFP (A) and with AT1R-GFP (B). The data are representative images of at least three independent experiments. Scale bars, 10 μm.
3.3. Colocalization of α2B-AR, β2-AR and AT1R with organelle markers in the presence of Sar1H79G
To precisely define the sites at which α2B-AR, β2-AR and AT1R, are arrested by expression of Sar1H79G, we first co-localized the receptors with GM130. GM130 is a cis-Golgi protein which redistributes into ER exit sites in the presence of Sar1H79G [38]. GFP-tagged α2B-AR, β2-AR and AT1R were expressed in HEK293T cells and their co-localization with GM130 was visualized by microscopy analysis following staining with anti-GM130 antibodies. α2B-AR (Fig. 5A) and AT1R (Fig. 5B) were markedly co-localized with GM130 in cells expressing Sar1H79G. In contrast, β2-AR did not co-localize with GM130 in cells transfected with Sar1H79G (data not shown). Both α2B-AR and AT1R transported to the cell surface in cells expressing Sar1 (Fig. 5).
Fig. 5.
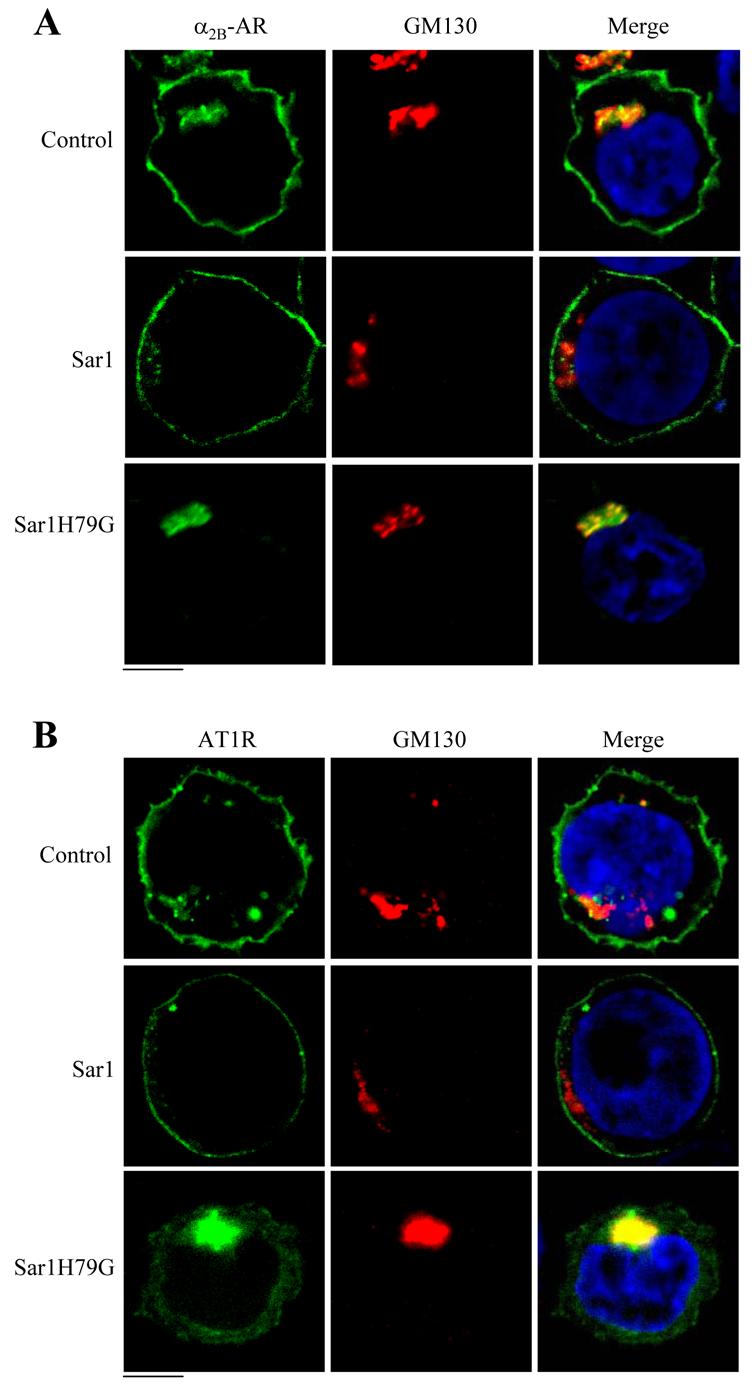
Co-localization of α2B-AR and AT1R with GM130. HEK293T cells were transfected with α2B-AR-GFP (A) or AT1R-GFP (B) (100 ng) together with the pcDNA3 vector (control), Sar1 or Sar1H79G (400 ng) and then stained with antibodies against GM130 (1:50 dilution) as described under “Experimental procedure.” Subcellular distribution and co-localization with GM130 of α2B-AR and AT1R were revealed by fluorescence microscopy. The data are representative images of four independent experiments. Green, GFP-tagged receptors; red, GM130; blue, DNA staining by 4,6-diamidino-2-phenylindole (nucleus); yellow, co-localization of the receptors and GM130. Scale bars, 10 μm.
We then sought to define the site where β2-AR accumulated during co-expression with the GTP-bound mutant Sar1H79G. In the first series of experiments, GFP-tagged β2-AR, α2B-AR and AT1R were transiently transfected together with the ER marker pDsRed2-ER. Co-localization of the receptors with the ER marker was revealed by microscopy analysis in fixed cells. β2-AR extensively co-localized with the ER marker DsRed2-ER in cells transfected with Sar1H79G, but not in cells transfected with the pcDNA3 vector or Sar1 (Fig. 6A). In contrast, α2B-AR and AT1R were not co-localized with the ER marker in cells expressing Sar1H79G (data not shown).
Fig. 6.
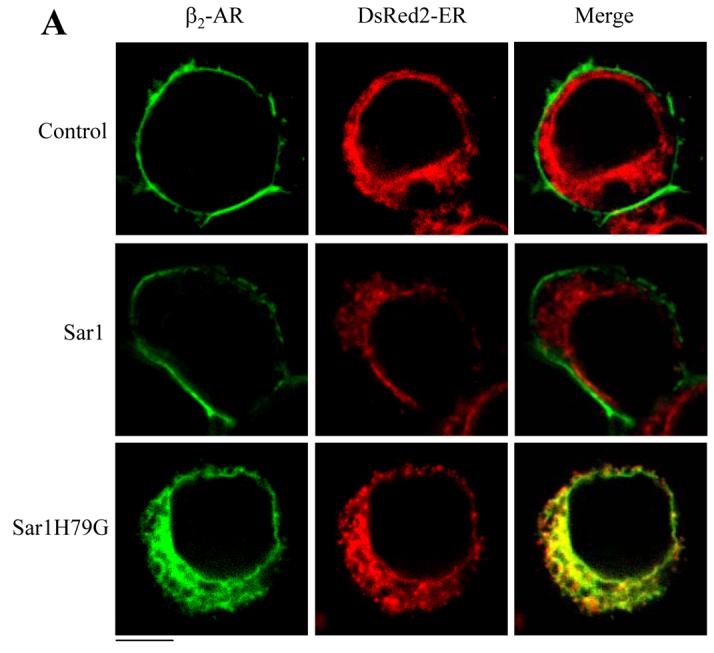
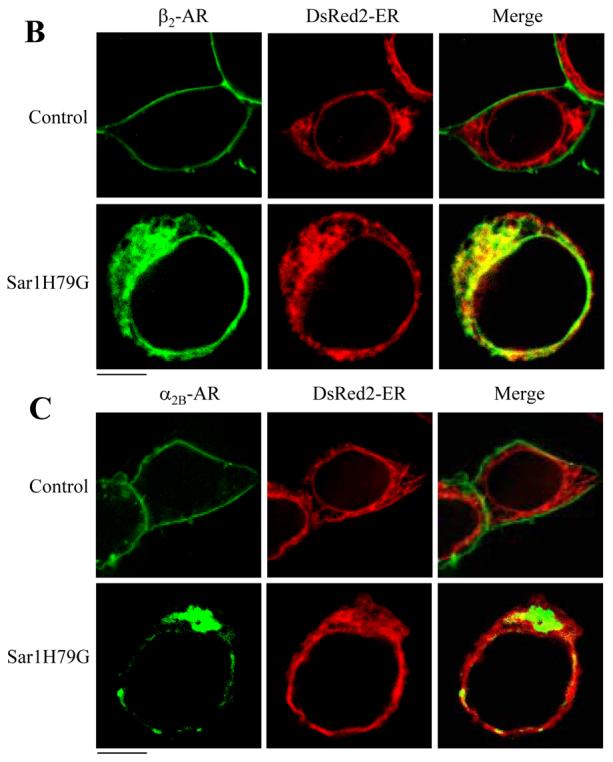
Colocalization of β2-AR with the ER marker DsRed2-ER. HEK293T cells cultured on coverslips were transiently transfected with pDsRed2-ER (100 ng) and GFP-tagged β2-AR (100 ng) or GFP-tagged α2B-AR together with the pcDNA3 vector (control), Sar1 or Sar1H79G (400 ng). Subcellular distribution and co-localization with DsRed2-ER of the receptors in fixed cells (A) and in live cells (B and C) were revealed by fluorescence microscopy as described under “Experimental procedures.” The data are representative images of five independent experiments. Green, β2-AR-GFP (A and B) and α2B-AR (C); red, the ER marker DsRed2-ER; yellow, colocalization of β2-AR (A and B) or α2B-AR (C) with DsRed2-ER. Scale bars, 10 μm.
To eliminate the possible non-specific influence of cell fixation on the subcellular localization of the receptors, in the second series of experiments we determined the effect of transient expression of Sar1H79G on the co-localization of α2B-AR, β2-AR and AT1R with the ER marker DsRed2-ER in live HEK293T cells. Similar to the results obtained from the fixed cells, β2-AR strongly co-localized with the ER marker DsRed2-ER in live cells (Fig. 6B). In contrast, α2B-AR (Fig. 6C) and AT1R (data not shown) were not co-localized with the ER marker. These data demonstrate that expression of the GTP-bound Sar1H79G mutant resulted in the selective arrest of β2-AR in the ER, indicating that GTP hydrolysis by Sar1 GTPase differentially modulates the export of α2B-AR, β2-AR and AT1R from the ER.
4. Discussion
The molecular mechanism underlying the recruitment and package of GPCRs into the ER-derived COPII-coated vesicles, which transport cargo proteins exclusively from the ER to the ERGIC, remains undefined. To address this issue we investigated the function of Sar1 GTPase, which plays a crucial role in the assembly and budding of the COPII-coated vesicles on the ER membrane, in regulating the export from the ER and transport to the cell surface of α2B-AR, β2-AR and AT1R. Loss-of-function of Sar1 GTPase was achieved by transiently expressing the GTP-restricted mutant Sar1H79G. Inhibition of normal Sar1 function by Sar1H79G has been demonstrated to attenuate protein transport to the cell surface [14-18]. Our data demonstrated that transient expression of Sar1H79G significantly inhibited the cell-surface expression of all GPCRs examined as determined by intact cell ligand binding. Consistent with attenuation of receptor expression at the cell surface, ERK1/2 activation in response to stimulation with the receptor agonists was also blocked. These data indicate that ER export of α2B-AR, β2-AR and AT1R is mediated through the Sar1-dependent COPII vesicles. In contrast, expression of wild-type Sar1 GTPase did not significantly influence the cell-surface expression of all three receptors and receptor-mediated ERK1/2 activation, suggesting that endogenous Sar1 expression is not a rate-limiting factor for the transport of the receptors to the cell surface.
Microscopic analysis on the subcellular distribution of the receptors revealed that Sar1H79G clearly arrested α2B-AR, β2-AR and AT1R in distinct subcellular compartments. Co-localization of the receptors with different intracellular compartment markers revealed that α2B-AR and AT1R did not co-localize with the ER marker DsRed2-ER, but co-localized strongly with GM130 in Sar1H79G-transfected cells. GM130 has been demonstrated to translocate from the cis-Golgi to ER exit site in the presence of Sar1H79G. These data suggest that α2B-AR and AT1R were still able to export from the ER and reached ER exit sites. These data are consistent with the function of GTP hydrolysis by Sar1 GTPase in the assembly and disassembly of the COPII-coated transport vesicles. It has been shown that Sar1H79G supports the budding of the COPII vesicles on the ER membrane, but blocks protein transport further, and therefore, arrests transported cargo proteins at ER exit sites [38]. In contrast to α2B-AR and AT1R, β2-AR exhibited marked co-localization with the ER in cells expressing Sar1H79G. These data indicate that efficient GTP hydrolysis by Sar1 GTPase differentially modulates the export of α2B-AR, β2-AR and AT1R from the ER. Such a differential requirement for Sar1 GTP hydrolysis has been reported for ER export of glycosylphosphatidylinositol-anchored protein, vesicular stomatitis virus glycoprotein and soluble lumenal GFP [17].
There are several possibilities regarding the differential regulation by Sar1H79G of targeting of different GPCRs to ER exit sites. It is possible that export from the ER of α2B-AR, β2-AR and AT1R is mediated through distinct populations of COPII vesicles or at distinct sites on the ER membrane, which have different sensitivities to the GTP hydrolysis by Sar1 GTPase. Consistent with this possibility, exit of glycosylphosphatidylinositol-anchored proteins and other membrane proteins from the ER is mediated through distinct COPII vesicles [39]. Furthermore, it has been recently demonstrated that GTP hydrolysis by Sar1 GTPase can be linked to the specificity of cargo incorporation into budding structures [16]. AT1R, α2B-AR and β2-AR may have different affinities for components of the COPII vesicles (such as active GTP-bound Sar1). α2B-AR and AT1R may bind to Sar1 or other components of COPII vesicles with higher affinity than β2-AR, resulting in the recruitment of the receptors to ER exit sites. This possibility is supported by the fact that many cargo proteins directly interact with the COPII components to facilitate their export from the ER [40-43]. It is also possible that export from the ER of different GPCRs is differentially regulated by their interaction with the ER-resident proteins. The ER retention of β2-AR may be caused by strong interaction between the receptor and ER-localized proteins, which traps the newly synthesized β2-AR in the ER and limits packaging of the receptor into ER exit sites. This possibility is supported by interaction of GPCRs with a number of ER-localized proteins to modulate their proper folding and assembly and to facilitate their maturation during biosynthesis of the receptors [8,19].
Export trafficking of GPCRs from the ER to the cell surface is a highly regulated, dynamic process and the specificity/selectivity of export trafficking can be modulated by multiple regulators at each stage of the transport process along the secretory pathway. We have demonstrated that AT1R and α2B-AR use the same F(X)6LL motif to export from the ER, implying that these receptors may be sorted from other GPCRs with different ER exit motifs [26,27]. The YS motif in the N-termini dictates the export from the Golgi of α2-AR, providing a means for the segregation of GPCRs at the level of the Golgi [36]. We have also demonstrated that the transport of AT1R, β2-AR and α2B-AR from the ER to the cell surface is selectively regulated by Rab1 and Rab6, indicating multiple routes by which GPCRs move to their functional destination [32-35]. In this manuscript, our data have showed that export from the ER of α2B-AR, β2-AR and AT1R is differentially modulated by GTP hydrolysis of Sar1 GTPase, suggesting that GPCRs could be sorted from one another at the level of ER exit sites. Therefore, selective export trafficking of GPCRs with similar structural features may be achieved at discrete intracellular levels and are modulated by multiple regulatory molecules.
Acknowledgments
This work was supported by the National Institutes of Health grant GM076167 (to G. W.) and an American Heart Association, Southeast Affiliate postdoctoral fellowship (to C. D.). We are grateful to Drs. Stephen M. Lanier, William E. Balch, Kenneth E. Bernstein and John D. Hildebrandt for sharing reagents.
Footnotes
Publisher's Disclaimer: This is a PDF file of an unedited manuscript that has been accepted for publication. As a service to our customers we are providing this early version of the manuscript. The manuscript will undergo copyediting, typesetting, and review of the resulting proof before it is published in its final citable form. Please note that during the production process errors may be discovered which could affect the content, and all legal disclaimers that apply to the journal pertain.
References
- 1.Pierce KL, Premont RT, Lefkowitz RJ. Nat. Rev. Mol. Cell. Biol. 2002;3:639. doi: 10.1038/nrm908. [DOI] [PubMed] [Google Scholar]
- 2.Wess J. Pharmacol. Ther. 1998;80:231. doi: 10.1016/s0163-7258(98)00030-8. [DOI] [PubMed] [Google Scholar]
- 3.Wu G, Bogatkevich GS, Mukhin YV, Benovic JL, Hildebrandt JD, Lanier SM. J. Biol. Chem. 2002;275:9026. doi: 10.1074/jbc.275.12.9026. [DOI] [PubMed] [Google Scholar]
- 4.Wu G, Benovic JL, Hildebrandt JD, Lanier SM. J. Biol. Chem. 1998;273:7197. doi: 10.1074/jbc.273.13.7197. [DOI] [PubMed] [Google Scholar]
- 5.Duvernay MT, Filipeanu CM, Wu G. Cell. Signal. 2005;17:1457. doi: 10.1016/j.cellsig.2005.05.020. [DOI] [PubMed] [Google Scholar]
- 6.Insel PA, Head BP, Ostrom RS, Patel HH, Swaney JS, Tang CM, Roth DM. Ann. N. Y. Acad. Sci. 2005;1047:166. doi: 10.1196/annals.1341.015. [DOI] [PubMed] [Google Scholar]
- 7.Marchese A, Chen C, Kim YM, Benovic JL. Trends Biochem. Sci. 2003;28:369. doi: 10.1016/S0968-0004(03)00134-8. [DOI] [PubMed] [Google Scholar]
- 8.Tan CM, Nickols HH, Limbird LE. J. Biol. Chem. 2003;278:35678. doi: 10.1074/jbc.M301888200. [DOI] [PubMed] [Google Scholar]
- 9.Goodman OB, Jr., Krupnick JG, Santini F, Gurevich VV, Penn RB, Gagnon AW, Keen JH, Benovic JL. Nature. 1996;383:447. doi: 10.1038/383447a0. [DOI] [PubMed] [Google Scholar]
- 10.von Zastrow M. Life Sci. 2003;74:217. doi: 10.1016/j.lfs.2003.09.008. [DOI] [PubMed] [Google Scholar]
- 11.Gurkan C, Stagg SM, Lapointe P, Balch WE. Nat. Rev. Mol. Cell. Biol. 2006;7:727. doi: 10.1038/nrm2025. [DOI] [PubMed] [Google Scholar]
- 12.Bickford LC, Mossessova E, Goldberg J. Curr. Opin. Struct. Biol. 2004;14:147. doi: 10.1016/j.sbi.2004.02.002. [DOI] [PubMed] [Google Scholar]
- 13.Barlowe C, Orci L, Yeung T, Hosobuchi M, Hamamoto S, Salama N, Rexach MF, Ravazzola M, Amherdt M, Schekman R. Cell. 1994;77:895. doi: 10.1016/0092-8674(94)90138-4. [DOI] [PubMed] [Google Scholar]
- 14.Kuge O, Dascher C, Orci L, Rowe T, Amherdt M, Plutner H, Ravazzola M, Tanigawa G, Rothman JE, Balch WE. J. Cell. Biol. 1994;125:51. doi: 10.1083/jcb.125.1.51. [DOI] [PMC free article] [PubMed] [Google Scholar]
- 15.Aridor M, Fish KN, Bannykh S, Weissman J, Roberts TH, Lippincott-Schwartz J, Balch WE. J. Cell. Biol. 2001;152:213. doi: 10.1083/jcb.152.1.213. [DOI] [PMC free article] [PubMed] [Google Scholar]
- 16.Sato K, Nakano A. J. Biol. Chem. 2004;279:1330. doi: 10.1074/jbc.C300457200. [DOI] [PubMed] [Google Scholar]
- 17.Stephens DJ, Pepperkok R. J. Cell. Sci. 2004;117:3635. doi: 10.1242/jcs.01269. [DOI] [PubMed] [Google Scholar]
- 18.Altan-Bonnet N, Sougrat R, Liu W, Snapp EL, Ward T, Lippincott-Schwartz J. Mol. Biol. Cell. 2006;17:990. doi: 10.1091/mbc.E05-02-0155. [DOI] [PMC free article] [PubMed] [Google Scholar]
- 19.Dong C, Filipeanu CM, Duvernay MT, Wu G. Biochim. Biophys. Acta. 2007;1768:853. doi: 10.1016/j.bbamem.2006.09.008. [DOI] [PMC free article] [PubMed] [Google Scholar]
- 20.Petaja-Repo UE, Hogue M, Laperriere A, Walker P, Bouvier M. J. Biol. Chem. 2000;275:13727. doi: 10.1074/jbc.275.18.13727. [DOI] [PubMed] [Google Scholar]
- 21.Dupre DJ, Robitaille M, Ethier N, Villeneuve LR, Mamarbachi AM, Hebert TE. J. Biol. Chem. 2006;281:34561. doi: 10.1074/jbc.M605012200. [DOI] [PubMed] [Google Scholar]
- 22.Dupre DJ, Baragli A, Rebois RV, Ethier N, Hebert TE. Cell. Signal. 2007;19:481. doi: 10.1016/j.cellsig.2006.07.021. [DOI] [PubMed] [Google Scholar]
- 23.Schulein R, Hermosilla R, Oksche A, Dehe M, Wiesner B, Krause G, Rosenthal W. Mol. Pharmacol. 1998;54:525. doi: 10.1124/mol.54.3.525. [DOI] [PubMed] [Google Scholar]
- 24.Bermak JC, Li M, Bullock C, Zhou QY. Nat. Cell Biol. 2001;3:492. doi: 10.1038/35074561. [DOI] [PubMed] [Google Scholar]
- 25.Robert J, Auzan C, Ventura MA, Clauser E. J. Biol. Chem. 2005;280:42198. doi: 10.1074/jbc.M510180200. [DOI] [PubMed] [Google Scholar]
- 26.Duvernay MT, Zhou, Wu G. J. Biol. Chem. 2004;279:30741. doi: 10.1074/jbc.M313881200. [DOI] [PubMed] [Google Scholar]
- 27.Zhou F, Filipeanu CM, Duvernay MT, Wu G. Cell. Signal. 2006;18:318. doi: 10.1016/j.cellsig.2005.05.014. [DOI] [PMC free article] [PubMed] [Google Scholar]
- 28.Bulenger S, Marullo S, Bouvier M. Trends Pharmacol. Sci. 2005;26:131. doi: 10.1016/j.tips.2005.01.004. [DOI] [PubMed] [Google Scholar]
- 29.Milligan G. Mol. Pharmacol. 2004;66:1. doi: 10.1124/mol.104.000497.. [DOI] [PubMed] [Google Scholar]
- 30.Tisdale EJ, Bourne JR, Khosravi-Far R, Der CJ, Balch WE. J. Cell Biol. 1992;119:749. doi: 10.1083/jcb.119.4.749. [DOI] [PMC free article] [PubMed] [Google Scholar]
- 31.Martinez O, Goud B. Biochim. Biophys. Acta. 1998;1404:101–112. doi: 10.1016/s0167-4889(98)00050-0. [DOI] [PubMed] [Google Scholar]
- 32.Wu G, Zhao G, He Y. J. Biol. Chem. 2003;278:47062. doi: 10.1074/jbc.M305707200. [DOI] [PubMed] [Google Scholar]
- 33.Filipeanu CM, Zhou F, Claycomb WC, Wu G. J. Biol. Chem. 2004;279:41077. doi: 10.1074/jbc.M405988200. [DOI] [PubMed] [Google Scholar]
- 34.Filipeanu CM, Zhou F, Fugetta EK, Wu G. Mol. Pharmacol. 2006;69:1571. doi: 10.1124/mol.105.019984. [DOI] [PubMed] [Google Scholar]
- 35.Dong C, Wu G. Cell. Signal. 2007;19:2388. doi: 10.1016/j.cellsig.2007.07.017. [DOI] [PMC free article] [PubMed] [Google Scholar]
- 36.Dong C, Wu G. J. Biol. Chem. 2006;281:38543. doi: 10.1074/jbc.M605734200. [DOI] [PMC free article] [PubMed] [Google Scholar]
- 37.Filipeanu CM, Zhou F, Lam ML, Kerut KE, Claycomb WC, Wu G G. J. Biol. Chem. 2006;281:11097. doi: 10.1074/jbc.M511460200. [DOI] [PMC free article] [PubMed] [Google Scholar]
- 38.Ward TH, Polishchuk RS, Caplan S, Hirschberg K, Lippincott-Schwartz J. J. Cell Biol. 2001;155:557. doi: 10.1083/jcb.200107045. [DOI] [PMC free article] [PubMed] [Google Scholar]
- 39.Muniz M, Morsomme P, Riezman H. Cell. 2001;104:313. doi: 10.1016/s0092-8674(01)00215-x. [DOI] [PubMed] [Google Scholar]
- 40.Nishimura N, Balch WE. Science. 1997;277:556. doi: 10.1126/science.277.5325.556. [DOI] [PubMed] [Google Scholar]
- 41.Fiedler K, Veit M, Stamnes MA, Rothman JE. Science. 1996;273:1396. doi: 10.1126/science.273.5280.1396. [DOI] [PubMed] [Google Scholar]
- 42.Votsmeier C, Gallwitz D D. EMBO J. 2001;20:6742. doi: 10.1093/emboj/20.23.6742. [DOI] [PMC free article] [PubMed] [Google Scholar]
- 43.Miller EA, Beilharz TH, Malkus PN, Lee MC, Hamamoto S, Orci L, Schekman R. Cell. 2003;114:497. doi: 10.1016/s0092-8674(03)00609-3. [DOI] [PubMed] [Google Scholar]