Abstract
Sixty years on, the NHS is still struggling to ensure equal access to the best care. In the second article in his series, Tony Delamothe examines the difficulties
One of the objectives of the National Health Service set out in the 1940s was “To ensure that everybody in the country—irrespective of means, age, sex, or occupation—shall have equal opportunity to benefit from the best and most up to date medical and allied services available.”1 How have these founding principles of universality, equity, and quality fared after 60 years?
Universality
Everyone who is “ordinarily resident” in the United Kingdom has the right to free primary and secondary care provided by the NHS. Until earlier this year, failed asylum seekers were deemed not to be ordinarily resident, but a judicial review has successfully challenged the lawfulness of Department of Health guidance on this point.2
Otherwise, this founding principle seems the least contested of all. From time to time it’s argued that certain categories of patients should be excluded from certain treatments—usually based on disapproval of their lifestyles (smoking, obesity, etc)—but these are mostly half hearted attempts that don’t get very far.
Equity
Although the words “equity” and “equality” do not feature in documents from the early days of the NHS, there are enough pointers to conclude that the service was intended to provide equal access or actual treatment for those in equal need. The concept has been refined since then. An equitable health service is currently understood to mean “one where individuals’ access to and utilisation of the service depends on their health status alone.”3
Socioeconomic status
On the basis of an analysis of studies of NHS services, Anna Dixon and colleagues concluded that there is strong evidence that lower socioeconomic groups use services less in relation to need than higher groups. They cite many supporting studies in cardiac care, elective surgery, cancer care, and preventive services.3 A typical example reports that socioeconomically deprived patients were less likely to be investigated and offered surgery once coronary heart disease had developed. In addition, these patients may have been further disadvantaged by having to wait longer for surgery because of being given lower priority.4
Disadvantage can be divided into problems with making first contact with the service and problems experienced once contact has been made. Possible sources of disadvantage include distance and transport, employment, and personal commitments, voice (the ability to express your needs and to “work” the system), and health beliefs and health seeking behaviour.3
A more radical formulation of equity claims that a truly equitable NHS would produce similar health outcomes regardless of socioeconomic group “as nothing can be more fundamental than the right to live as long and as well as anyone else.”5
The goal of abolishing the gap between health outcomes in different social classes goes back at least to a statement in 1980 by David Ennals, minister for health.6 However, even narrowing that gap is proving hard. Is this even a reasonable aspiration, given that so many of the determinants of ill health lie outside what a health service can affect? The original 1944 white paper underlying the NHS Bill was clear about the new service’s responsibilities, and they did not include “all those environmental factors—good housing, sanitation, conditions in school and at work, diet and nutrition, economic security and so on—which create the conditions of health and prepare the ground for it.”1
Nevertheless, reducing health inequalities is now one of the key delivery targets for the NHS and the Department of Health in England.7 And, as Rudolf Klein points out, two thirds of the indicators chosen to monitor progress fall outside the Department of Health’s remit.8 Its goals of cutting by 10% the social class gap in health outcomes (measured by infant mortality and life expectancy at birth) are unlikely to be met by the target date of 2010.9
Geography
Serious attempts to reduce the geographical inequalities of access arising from the unequal distribution of resources began with the Resource Allocation Working Party formula in 1976. Allocation of money to today’s primary care trusts is similarly meant to reflect need. Yet how that money is spent still varies widely, and inequitably, around the country, as a recent snapshot shows.
Expenditure on cancer treatment per cancer patient varies fantastically between £17 028 (€21 400; $33 700) in Nottingham City Primary Care trust (PCT) to just £5182 in Oxfordshire PCT and even more so per premature death from heart disease, where spending ranges from £166 151 in Wakefield PCT to just £17 241 in Calderdale PCT. Postcode lotteries also preside over how long people can expect to wait for treatment. As of October 2007, just 33% of elective (non-emergency) patients received treatment within 18 weeks in Hastings & Rother PCT, compared with 82% in Blackpool PCT.10
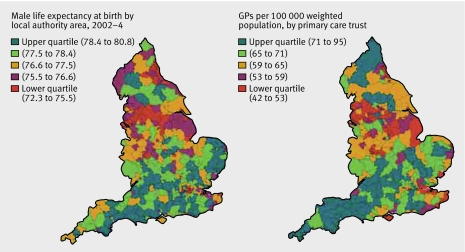
Areas where life expectancy is lowest (London, the Midlands, Yorkshire, North West, and North East) broadly match those that have fewer general practitioners per head (fig 1). And as the number of general practitioners has increased over the past two decades, so has the inequality in their distribution.11
Fig 1 Male life expectancy at birth by local authority 2002-4, and number of general practitioners per 100 000 weighted population by primary care trust11
One of the most politically sensitive manifestations of geographical inequality is “postcode prescribing”—variations in the availability of services or treatment by address. The setting up of the National Institute for Clinical Excellence (NICE) in 1999 was meant to remedy this: its purpose was “to give a strong lead on clinical and cost effectiveness, drawing up new guidelines and ensuring they reach all parts of the health service.”
However, according to Sheila Leatherman and Kim Sutherland, “In the process of its annual health check of NHS trusts, the Healthcare Commission reports that one of the most common self-declarations of non-compliance is with respect to implementing NICE guidance. NICE can guide commissioning and clinical decisions but budgetary constraints at a local level mean that it is simply not possible to fund all NICE guidance, as well as maintain existing service.” They conclude that “this conundrum is yet to be resolved.”12
Age, sex, and ethnic group
Working class wives and elderly people of both sexes stood to benefit most from the arrival of the NHS. The evidence suggests that while women’s access to health care has improved, that of elderly people still has a long way to go.
Launched in 2001, the National Service Framework for Older People was “a frank acknowledgment that the NHS has been riddled with discrimination against older people.”13 At the heart of the document were proposals to overhaul several key NHS services, so that older people would receive the same treatment as those younger than 65 for conditions such as cancer and heart disease.
Abundant evidence of ageism existed by then. A survey by Help the Aged showed that:
Only 4% of older patients who died after surgery had been admitted to a high dependency unit
Upper age limits existed for several procedures, including heart bypass, kidney dialysis, and routine breast screening
Patients over 60 had to wait longer in accident and emergency departments than patients under 40.14
More recently, John Young, who heads an academic unit of elderly care and rehabilitation, lamented the endemic ageism of the NHS. Decades of health service underfunding had provided an environment in which ageism flourished: “Whenever a clinical stone is turned over, ageism is revealed,” he wrote, citing studies in cancer services, coronary care units, prevention of vascular disease, mental health services, and the management of transient ischaemic attacks and minor strokes.15
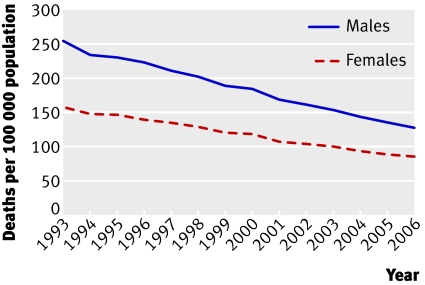
By contrast, Lesley Doyal has hailed the removal of financial obstacles to women’s access to health care as one of the main achievements of the NHS.16 Women experience lower mortality than men from conditions considered amenable to health care (fig 2). However, they haven’t achieved complete equality. She cites evidence that women are treated by some doctors as less valuable than men, leading to demeaning attitudes as well as the unequal allocation of clinical resources. Genderbias is also present in medical research, which often excludes women from recruitment into trials.
Fig 2 Mortality from causes considered amenable to health care among men and women, England, 1993-200612
Julia Hippisley-Cox and colleagues have detailed the unequal care of women with ischaemic heart disease compared with men. Women with angina are less likely to be referred to a specialist or to have revascularisation. In secondary care, inequalities in investigation and use of drug treatment exist between the sexes. Inequalities exist in primary care regarding drug treatment for the secondary prevention of ischaemic heart disease.17
In an overview of the health of ethnic minorities, Gill and colleagues reported that apart from under-registration of African-Caribbean men, ethnic minorities did not underuse either general practitioner or hospital services.18 After adjusting for socioeconomic factors, ethnic minority respondents are equally likely to have been admitted to hospital, with a few exceptions, such as the over-representation of African-Caribbean people in mental health admissions. Healthcare Commission surveys have found that Pakistani, Indian, and Bangladeshi patients report poorer experiences as hospital patients than the white majority.19
Two issues require resolving before confident conclusions can be drawn about inequities experienced by ethnic minorities. Firstly, the patchy collection of ethnic data by the NHS needs to be improved, with the recording by general practitioners of ethnicity a key starting point.20 And secondly, ethnic differences in measures of process and outcome need to be adjusted for the confounding effects of socioeconomic disadvantage. The degree to which belonging to an ethnic minority group carries adverse consequences over and above those relating to socioeconomic status has yet to be determined.
The most recent study published in the BMJ on inequities of access (April 2008) looked at coronary angiography for suspected stable angina patients.21 Despite decades of awareness of the existence of inequities, its pessimistic findings were: “At an early stage after presentation with suspected angina, coronary angiography is underused in older people, women, south Asians, and people from deprived areas. Not receiving appropriate angiography was associated with a higher risk of coronary events in all groups.” So in some cases, it’s reasonable to conclude, these inequalities kill.
Quality: simply the best?
Aneurin Bevan, the NHS’s architect, wanted to roll out the same high standard of care—the best—to everyone.1 According to NHS historian, Charles Webster, Bevan aspired to the standards of the private wing of the voluntary hospital rather than those of the poor law infirmary. Bevan’s wasn’t merely a “good enough” service; he wanted to “place this country in the forefront of all countries of the world” in its medical services.1
Sixty years later, how good are the services provided by the NHS? Are they getting better or worse? The lack of data makes it hard to answer these questions with any certainty, although the data drought is gradually lifting.
Before 1997, published information about the quality of care didn’t extend much beyond statistics on hospital mortality, renal transplantations, and in vitro fertilisation.22 That began to change with the election of the Labour government in 1997 and its pledge to put “quality at the heart of the NHS.”
The best source of up to date summary assessments of the quality of NHS services are the reports of Sheila Leatherman and Kim Sutherland, commissioned by the Nuffield Trust. Five years ago, they were favourably disposed towards the NHS because of its “intention to provide equitable and universal healthcare to all UK residents”22; in their latest evaluation they admitted to seeing “a very mixed picture of quality of care in the NHS.”12 And this despite an enormous raft of quality initiatives (box).
NHS quality agenda, 1997-200812
Standard setting and monitoring
National Institute for Clinical Excellence (NICE)*
National service frameworks
Core and development standards (set by Department of Health)
Clinical audit
Target setting
Public service agreements
Clinical governance
Legislation
Regulation
Institutional
Healthcare Commission
Monitor
Audit Commission
Individual
National Clinical Assessment Authority
General Medical Council
Appraisal and revalidation
Patient or public engagement
Patient choice of providers
Expert patient programme
Patient and public involvement
Patient advice and liaison services
Payment and incentives
Payment by results
General practitioner contract
Consultants’ contract
Agenda for change
Public reporting
Dr Foster
League tables
Healthcare Commission’s annual health checks
Commissioning
NICE commissioning guides
Adopting the Department of Health’s definition of quality (“doing the right things, at the right time, for the right people, and doing them right—first time”), they analysed data on effectiveness and appropriateness, access, capacity, safety, patient centredness, and equity.
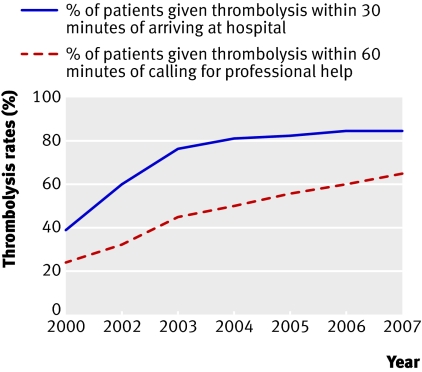
On effectiveness and efficiency, Leatherman and Sutherland note greater efforts being made to achieve evidence based standards of care for several conditions—for example, thrombolysis (fig 3); mortality due to the major disease groups has dropped, though there are continuing deficiencies in a range of clinical areas.
Fig 3 Thrombolysis rates after acute myocardial infarction, England, 2000-712
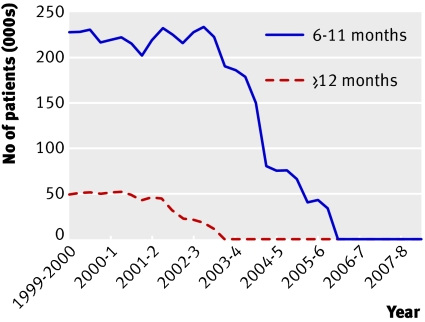
Access here is defined as “the ability to obtain effective health care services in a timely fashion, when medically needed,” with waiting lists the unambiguous marker of problems with access. Waiting times for hospital admission, outpatient, and cancer care have fallen significantly but problems exist in some specialties and for some investigations (fig 4). Access matters: part of the UK’s relatively poor international performance in cancer mortality has been attributed to delays in referral and treatment. By September 2007, however, 97% of patients with suspected cancer (100% with breast cancer) were treated within the government’s two month target.
Fig 4 Number of patients in England waiting 6-11 months and ≥12 months for hospital admission12
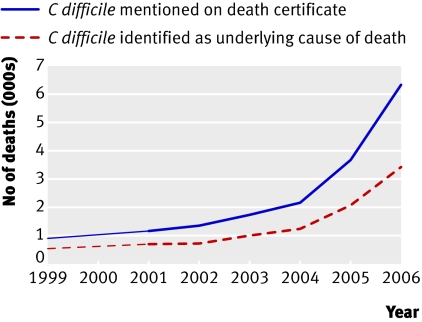
Numbers of staff and new facilities (capacity) have gone up. Regarding safety, reports of methicillin resistant Staphylococcus aureus (MRSA) infection have been steadily falling since March 2004, and mentions of MRSA on death certificates look as if they are stabilising. Deaths from Clostridium difficile, however, are increasing sharply (fig 5). Difficulties in monitoring the safety of health services continue.
Fig 5 Numbers of deaths involving Clostridium difficile, England12
Patient reported experience of care has not improved, and the gap in life expectancy and infant mortality between the most deprived populations and England as a whole has widened (as discussed in the section on socioeconomic status above).
The authors qualify these findings by observing that international data show trends—particularly in health outcomes and death rates—that are strikingly similar to those seen in England. And time series show few, if any, dramatic changes in trends as a result of reforms or investment. So what has the massive investment in quality initiatives bought? Was it worth it? And are there any new levers available to pull?
Bevan’s verdict?
How would Bevan rate this performance against his founding principles? On universality, he would certainly be content. But on equity and quality he would be far from happy. For age, sex, socioeconomic group, and geography it’s easy to uncover glaring inequities of access and use. Rather than providing services of world beating quality, there’s enough comparative data from similar countries to judge the NHS’s outcomes of care as distinctly average (or worse).12 It’s as if most of Bevan’s successors had simply forgotten that equity and quality were founding principles of the NHS. Next week, I will be considering whether the founding principle of comprehensiveness has fared any better.
In the preparation of this article I have greatly benefited from discussions with Sheila Leatherman, Julian Le Grand, Veena Raleigh, and Julian Sheather.
Competing interests: None declared.
This is the second of six articles marking 60 years of the NHS
References
- 1.Ministry of Health, Department of Health for Scotland. A national health service London: HMSO, 1944. (Cmd 6502.)
- 2.Department of Health. Failed asylum seekers and ordinary residence—advice to overseas visitors managers 2008. www.dh.co.uk (search for: 9854).
- 3.Dixon A, Le Grand J, Henderson J, Murray R, Poteliakhoff E. Is the NHS equitable? A review of the evidence London: London School of Economics, 2003. (Health and social care discussion paper No 1.)
- 4.Pell JP, Pell ACH, Norrie J, Ford I, Cobbe SM. Effect of socioeconomic deprivation on waiting time for cardiac surgery: retrospective cohort study. BMJ 2000;320:15-8. [DOI] [PMC free article] [PubMed] [Google Scholar]
- 5.Lawson N. Machines, markets and morals: the new politics of a democratic NHS London: Compass, 2008
- 6.Le Grand J. The strategy of equality: redistribution and the social services London: George Allen & Unwin, 1982
- 7.Department of Health. Tackling inequalities: a programme for action London: DoH, 2003.
- 8.Klein R. The new politics of the NHS: from creation to reinvention Abingdon: Radcliffe, 2006
- 9.Department of Health. Tackling health inequalities: 2007 status report on the programme for action London: DoH, 2008
- 10.Gubb J. Why the NHS is the sick man of Europe. Civitas Rev 2008;5(1):1-11. [Google Scholar]
- 11.Department of Health. Our NHS, our future. NHS next stage review interim report. London: DoH, 2007
- 12.Leatherman S, Sutherland K. The quest for quality: refining the NHS reforms. London: Nuffield Trust, 2008
- 13.Kmietowicz Z. Plan to end age discrimination in NHS is launched. BMJ 2001;322:751. [PMC free article] [PubMed] [Google Scholar]
- 14.Eaton L. Help the Aged accuses NHS of discrimination. BMJ 2002;324:564 [Google Scholar]
- 15.Young J. Ageism in services for transient ischaemic attack and stroke. BMJ 2006;333:508-9. [DOI] [PMC free article] [PubMed] [Google Scholar]
- 16.Doyal L. Sex, gender, and health: the need for a new approach. BMJ 2001;323:1061-3. [DOI] [PMC free article] [PubMed] [Google Scholar]
- 17.Hippisley-Cox J, Pringle M, Crown N, Meal A, Wynn A. Sex inequalities in ischaemic heart disease in general practice: cross sectional survey. BMJ 2001;322:832. [DOI] [PMC free article] [PubMed] [Google Scholar]
- 18.Gill PS, Kai J, Bhopal RS, Wild S. Black and minority ethnic groups www.hcna.bham.ac.uk/series/bemgframe.htm
- 19.Parliamentary Office of Science and Technology. Ethnicity and health. Postnote 2007;276:1 www.parliament.uk/documents/upload/postpn276.pdf
- 20.Hitchen L. Compulsory recording of patients’ ethnic data will help show disease trends. BMJ 2008;336:1039 [Google Scholar]
- 21.Sekhri N, Timmis A, Chen R, Junghans C, Walsh N, Zaman J, et al. Inequity of access to investigation and effect on clinical outcomes: prognostic study of coronary angiography for suspected stable angina pectoris. BMJ 2008;336:1058-61. [DOI] [PMC free article] [PubMed] [Google Scholar]
- 22.Leatherman S, Sutherland K. The quest for quality: a mid-term evaluation of the ten-year quality agenda guide London: Nuffield Trust, 2003


