

Abstract
The goal of this study was to test whether the contractile patterns of two major hindlimb extensors of guinea fowl are altered by load-carrying exercise. We hypothesized that changes in contractile pattern, specifically a decrease in muscle shortening velocity or enhanced stretch activation, would result in a reduction in locomotor energy cost relative to the load carried. We also anticipated that changes in kinematics would reflect underlying changes in muscle strain. Oxygen consumption, muscle activation intensity, and fascicle strain rate were measured over a range of speeds while animals ran unloaded vs. when they carried a trunk load equal to 22% of their body mass. Our results showed that loading produced no significant (P > 0.05) changes in kinematic patterns at any speed. In vivo muscle contractile strain patterns in the iliotibialis lateralis pars postacetabularis and the medial head of the gastrocnemius showed a significant increase in active stretch early in stance (P < 0.01), but muscle fascicle shortening velocity was not significantly affected by load carrying. The rate of oxygen consumption increased by 17% (P < 0.01) during loaded conditions, equivalent to 77% of the relative increase in mass. Additionally, relative increases in EMG intensity (quantified as mean spike amplitude) indicated less than proportional recruitment, consistent with force enhancement via stretch activation, in the proximal iliotibialis lateralis pars postacetabularis; however, a greater than proportional increase in the medial gastrocnemius was observed. As a result, when averaged for the two muscles, EMG intensity increased in direct proportion to the fractional increase in load carried.
Keywords: Locomotion, oxygen consumption muscle strain, electromyography
Researchers have long sought to understand what factors underlie the metabolic cost of terrestrial locomotion. Several studies support the conclusion that much of the cost is dictated by the need to generate muscle forces to support body weight (29, 34, 45– 47). One experimental design used to test this hypothesis has been to place loads on animals and humans, thereby increasing the forces that must be produced by the muscles to run at equivalent speeds (13, 15, 30, 36, 46). The results of these studies have reached differing conclusions regarding the percentage of energy used in stance vs. that used to swing the limbs, but all agree that supporting and accelerating the mass of the animal constitutes a major portion of the cost of locomotion.
There are several factors that influence how much force a given volume of muscle can produce, such as the time course of activation, operating length, and contractile velocity (33, 37). Kinematic patterns have traditionally been used to infer underlying muscle contractile patterns, where changes in kinematics during loading experiments presumably reflect changes in the contractile behavior of the muscles. In studies in which there was no change in kinematics, it has been assumed that operating length and shortening velocities of the leg muscles were unaltered by load carrying (30, 46). However, in cases where time of contact increased with load (32, 38), it is possible that leg muscles shorten more slowly. A reduced shortening velocity would allow a muscle to produce more force, helping to offset the increase in muscle recruitment required to carry a load. It is also possible that under an increased external load, muscles may be actively stretched to a greater extent than during unloaded conditions, further enhancing muscle force output (1, 17, 23, 31, 33. To our knowledge, the effect of load carrying on muscle strain pattern has not been directly measured. The purpose of this study was to explore how trunk loading influences muscle contractile patterns (active stretch and shortening velocity), limb kinematics, and metabolic cost in guinea fowl during treadmill exercise.
In several studies, general kinematic patterns have been measured to determine whether subjects altered their mechanics in response to the load carried. In many cases there was little or no significant change in the time of foot contact with the ground or duty factor (9, 15, 30, 36, 42, 46), and oxygen consumption increased in nearly direct proportion to the increase in load carried. However, other studies have shown that stride frequency (9, 13, 48) and ground contact time (32, 38) may increase slightly during load carriage, and, interestingly, in these cases the increase in oxygen consumption rate (V̇o2) was less than one to one with respect to the load carried. In a recent loading study, Marsh et al. (38) showed that guinea fowl also increase their time of contact a small, but significant amount (4%), when carrying a trunk load, and this corresponded to an increase in metabolic rate that was 77% of the load carried.
In this study we chose to examine the contractile behavior of the iliotibialis lateralis pars postacetabularis (ILPO) and the medial head of the gastrocnemius (MG), which are both known to be active predominately during the support phase of the locomotor cycle (25). These are also two of the larger hindlimb muscles of guinea fowl. We sought to test the hypothesis that a decrease in muscle fascicle strain rate (shortening velocity) and/or enhanced stretch activation of the muscles would reduce locomotor energy cost relative to the load carried. This reflects the fact that both a slower shortening velocity and force enhancement via active stretch likely reduce a muscle’s cost of generating force (33, 37, 40). We propose that changes in kinematics, such as an increase in time of foot contact at a given speed, may enable this reduction in fascicle shortening rate, thereby allowing the muscles to more economically generate the forces required for weight support.
In the absence of changes in muscle contractile patterns and limb kinematics, assuming that muscle forces are distributed relative to their cross-sectional area (i.e., they produce equal stress; Refs. 2, 4, 30, 44), we predicted that the increase in recruitment in these muscles would be proportional to the added load relative to the animal’s weight. We quantified muscle recruitment in terms of EMG intensity, because EMG intensity has been shown to correlate well with direct measurements of muscle force in guinea fowl (14). We assumed that the increase in metabolic cost due to a trunk load would be proportional to the cost of producing force to support weight during the stance phase of a stride. On the basis of recent work showing that the relative metabolic cost of swinging the limbs constitutes ~25% of the total cost of locomotion (18, 28, 39, 41), we predicted that the relative increase in metabolic cost would be ~75% of the relative increase in weight due to the trunk load carried.
METHODS
Animals and training
Six female adult guinea fowl (Numida meleagris) with an average mass of 1.31 ± 0.06 kg (± SD) were obtained from a local breeder. Throughout the training and experiments, the animals were housed at Harvard University’s Concord Field Station in a large outdoor coop and given food and water ad libitum. All housing, training, and experimental procedures were conducted under protocols approved by the Harvard Institutional Animal Care and Use Committee (protocol no. 20-09).
Three animals (average mass 1.32 ± 0.02 kg) were selected at random for the metabolic energy studies. These animals were trained to run on a motorized treadmill (Proform, Logan, UT, model PFTL 08040, belt: 0.4 m wide, 1.0 m long) with and without a load of 0.286 kg (on average this represented 21.7% of the animals’ mean body weight, which we report hereafter as ~22% to reflect the slight variation among animals) supported over their back. The load consisted of a pack constructed of small lead grains in three plastic bags. These were wrapped in elastic tape such that two of the bags hung symmetrically on either side of the bird with the third centered over the bird’s back. The packs were positioned approximately over the animals’ center of mass (just anterior to the synsacrum as determined from a frozen specimen) and secured with VetWrap. The VetWrap was worn in both loaded and unloaded trials. The animals ran 3–4 days/wk for 6 wk before data collection. Each training session consisted of three to five runs with and without the load, at speeds of 0.5, 1.0, and 1.5 m/s, each lasting for 5 min. At the time of data collection, each bird could comfortably maintain the highest speed while running with a 22% body weight load for 5 min.
Five animals (average mass 1.31 ± 0.07 kg), including two used in the metabolic trials, were selected for in vivo muscle measurements. The three animals not used to obtain metabolic rate data were trained using the same protocol for 3– 4 wk before surgery and experimental muscle recordings.
Metabolic rate measurements
Measurements of V̇o2 were collected by using an open-circuit indirect calorimetry system (24) while the animals walked or ran in a clear Plexiglas box (0.64 × 0.33 × 0.23 m) that was only open to the room at its base as it slid over the moving treadmill belt. A mass flow pump (Flow-Kit model 500H, Sable Systems International, Las Vegas, NV) pulled air from the front of the box at a rate of 55 l/min. This rate was high enough to ensure that all expired gas from the animal was collected. A subsample of the mixed expired air was pulled from the main air flow at 200 ml/min and passed through two columns filled with Drierite and Ascarite to remove water and CO2, respectively. Oxygen content was analyzed using a Sable Systems PA-1B Oxygen Analyzer (Sable Systems International). The system was calibrated using nitrogen at a known flow rate (V Series 16-bit volumetric gas flowmeter, Alicat Scientific, Tucson, AZ) following Fedak et al. (24), which enabled the calculation of V̇o2. Accuracy of the flow system was found to be within ±1%.
All trials lasted a minimum of 5 min, and oxygen consumption was measured throughout the trial. V̇o2 was determined from the last minute of the trial when it was clear that oxygen consumption had reached steady state. Speeds (0.5, 1.0, and 1.5 m/s) and loading conditions were randomized, and trials for each condition were collected on different days, with no more than three trials being collected from any one animal on a single day to ensure that the animals were sufficiently well rested to readily perform the exercise. All V̇o2 values measured were below the maximal rate of oxygen consumption for guinea fowl (20). Resting V̇o2 values were collected as the guinea fowl sat quietly for 10 min inside the box darkened with a towel covering before exercise trials were conducted. Data were collected at 100 Hz using a 12-bit analog-to-digital (A/D) converter (Digidata 1200B system, Axon Instruments, Union City, CA) and analyzed using AxoScope software (v 8.2, Axon Instruments). Metabolic power was calculated from V̇o2 assuming an equivalence of 20.1 J/ml O2 (8).
Muscles
To evaluate support phase muscle function, we sampled EMG and fascicle strain from two major limb extensors: the ILPO and the MG (Fig. 1). The ILPO is the largest muscle in the hindlimb; it originates on the dorsolateral iliac crest, the terminal iliac process, and the posterior ischium and inserts on the patellar tendon, giving it an extensor moment at both the hip and knee (25). The MG is primarily an ankle extensor, with the majority of its origin arising from the tibiotarsus; however, a small portion of the MG originates on the patellar tendon, acting to extend the knee as well. EMG studies have shown that both of these muscles are predominately active during stance (25). In addition, recent blood flow studies have shown that these two muscles, along with a few other muscles in the leg, receive a disproportionate increase in blood flow, relative to their mass, during exercise (21, 39) and during trunk loading (22).
Fig. 1.
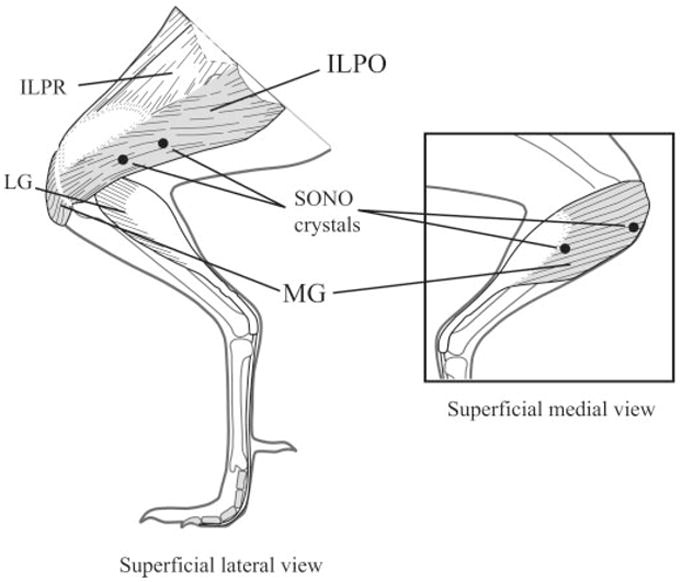
Schematic diagram of a guinea fowl hindlimb showing the anatomy of the iliotibialis lateralis pars postacetabularis (ILPO) and the medial head of the gastrocnemius (MG), highlighted in gray. Sonomicrometry (SONO) crystals are indicated by black circles. Crystals were implanted approximately midbelly in both muscles. EMG electrodes (not shown) were implanted adjacent to each pair of SONO crystals. The lateral gastrocnemius (LG) and iliotibialis lateralis pars preacetabularis (ILPR) are indicated for reference.
Surgical procedures and electrode design
Before in vivo recordings, sonomicrometry (SONO) crystals and electromyography (EMG) electrodes were implanted in the ILPO and MG with sterile surgical technique. The animals were anesthetized with isoflurane gas delivered via a mask. Animals were induced at 4% and maintained throughout the surgery at 1–3%. The surgical field was plucked of feathers and sterilized with an antiseptic solution (Prepodyne, West Argo, Kansas City, MO). Three small incisions were made in the skin: just above the hip, on the lateral side of the thigh parallel to the femur, and along the medial surface of the shank parallel to the tibiotarsus. After being sterilized (Nolvasan Solution, Fort Dodge), the EMG electrodes and SONO crystals, which had previously been soldered into a micro-connector plug (3 × GM-6 Microtech, Boothwyn) and embedded in waterproof epoxy, were passed under the skin through the incision over the hip and fed subcutaneously to the target muscles.
Each pair of 2.0-mm piezoelectric SONO crystals (Sonometrics, London, ON, Canada) was implanted in the muscles by forming two small pockets in the muscle with the tips of a sharp pair of scissors. The pockets were spaced ~10–15 mm apart and were arranged parallel to the muscle fascicles. Because the MG is a unipennate muscle, the depths of the crystals were adjusted to match the pennation angle of the muscle. After insertion, the crystals were aligned to maximize their signal-to-noise ratio by monitoring their output on an oscilloscope. Once a good signal (high signal-to-noise ratio) was obtained, the opening was sutured, and the lead wires were anchored to the surface of the muscle belly by use of 4-0 silk suture. In the ILPO, the crystals were implanted in the middle third of the muscle belly, whereas in the MG the crystals were implanted midbelly, spanning most of the muscle fascicles’ length (Fig. 1).
Two fine-wire bipolar EMG electrodes (offset twist hook, 0.5-mm bared tips with 1-mm spacing) were inserted into each muscle adjacent to the placement of the SONO crystals, using a 21-gauge hypodermic needle and secured to the muscle belly with 4-0 suture near their insertion site. The EMG electrodes were constructed from insulated fine silver wire (0.1-mm diameter, California Fine Wire, Grover Beach, CA). After all electrodes were implanted, the skin incisions were closed with 3-0 suture and the connector plug anchored above the hip. The wing feathers were trimmed so they did not obscure the limb, joint centers of rotation were palpated, and nontoxic white paint was applied and marked with black ink for obtaining basic joint kinematic data. The animals were administered an analgesic and antibiotics and given 24 h to recover.
In vivo data and video collection
In vivo muscle data were collected while the animals walked or ran on a motorized treadmill (Woodway USA, Waukesha, WI) over a speed range from 0.5 to 3.0 m/s in 0.5 m/s increments, with and without a 0.286 kg (~22% body wt) load. During data collection, a lightweight shielded cable ran between the external connector attached above the animal’s hip and the recording equipment. Outputs from the EMG electrodes were amplified × 1,000 and filtered (10-Hz to 10-kHz band pass) by using Grass P511 preamplifiers (Grass-Telefactor, West Warwick, RI). Signals from the SONO crystals were connected to a sonomicrometry amplifier (Triton 120.2, Triton Technology, San Diego, CA) and monitored via an oscilloscope (Tektronix 2235A, Tektronix Texas, LLC, Richardson, TX). Outputs from the SONO and EMG amplifiers were sampled at 5 kHz by use of a 12-bit A/D converter (Digidata 1200B system, Axon Instruments) and stored on a personal computer. High-speed video (250 Hz, Photron Fastcam-X 1280 PCI; Photron USA, San Diego, CA) was recorded from the lateral view simultaneously with muscle measurements and was synchronized to the muscle recordings via a posttrigger pulse that stopped the video and was recorded by the A/D converter.
Muscle length change and shortening velocity
Fractional changes in muscle fascicle length were determined following Biewener and Corning (5). The sonomicrometry signals were corrected for the offset error introduced by the faster speed of sound propagation through the epoxy lens of the crystals relative to the muscle (determined to be 0.82 mm for the Sonometrics 2.0-mm crystals) and for the 5-ms delay introduced by the Triton 120.2 amplifier’s filter. Changes in distance between crystal pairs were normalized to muscle fascicle strain by dividing by a rest length recorded when the animals stood quietly. Fascicle strain recorded locally within the region of the muscle sampled was assumed to be indicative of the full length of the fascicle, as well as the entire muscle. In the MG, this is more likely the case, as the crystal spacing spanned the majority of the fascicles’ length. Given the complex architecture of the ILPO, this may not be as valid an assumption. Preliminary results (10) have shown that some regional differences in fascicle strain within the ILPO occur during unloaded locomotion. Despite this possibility, we assume here that changes in strain pattern due to loading observed locally at the sampling site are representative for the whole muscle.
In vivo data from unloaded and loaded conditions were analyzed for four speeds: 0.5, 1.0, 1.5, and 3.0 m/s. This speed range was selected because it includes all of the speeds for which metabolic data were collected, as well as the highest speed for which we were able to obtain recordings from the animals during steady running. For each condition, five strides were selected for analysis and were used to create individual means for each variable. Foot-on and foot-off times were determined from the video data. Strain patterns observed in each muscle were separated into regions of shortening and lengthening based on inflections in the pattern throughout the stride cycle. Because we were primarily interested in muscle strain during stance, mean fascicle strain rates were measured by dividing the highest magnitude strains recorded during stance by the time over which they occurred.
Kinematics
Ten consecutive strides were selected from the video data for kinematic analysis. Stride time, stance time, and swing time were determined for all speeds and conditions (at 250 Hz, errors in time are likely to average one frame, or 0.004 s). A subset of three trials from unloaded and loaded conditions at 0.5, 1.0, 1.5, and 3.0 m/s (for a total of 24 trials) was selected from these data for more detailed joint kinematic analysis. Markers at the posterior iliac process, hip, knee, ankle, and tarsometatarsal-phalangeal joints were digitized by use of a customized MATLAB (v.6.5, The MathWorks, Natick, MA) routine (coded by T. L. Hedrick, University of Washington) and filtered by a quintic spline fit to known root mean square data, using the generalized cross-validatory/spline (GCVSPL) program (49). Because of the skin movement over the knee during locomotion, the coordinates of the knee joint were calculated by generating the equations for circles centered at the coordinates of hip and ankle, with the length of the femur and tibiotarsus being their radii, respectively. The knee joint location was determined by the intersection point of these two circles that most closely matched the digitized knee point. The other intersection point was always clearly incorrect. These coordinates were used to calculate mean joint angles at the hip, knee, and ankle throughout the stride.
EMG analysis
EMG data were analyzed for the same five strides selected for muscle fascicle strain analysis. Several variables were quantified for each signal, including onset time relative to foot-on, duration, and intensity. EMG burst onset and offset were determined by eye, and EMG intensity for a single burst of activation was determined by averaging the spike amplitude of the rectified EMG signal. EMG intensities were then converted to a relative scale for each muscle by dividing this value by the largest value recorded in that muscle for that animal. Thus, for a given animal, the largest burst intensity recorded in a given muscle was assigned the value of 1, and all other bursts from that muscle ranged between 0 and 1 (26). Two EMG electrodes were implanted in each muscle to ensure that at least one reliable signal was recorded. In cases in which both EMG electrodes provided signals, the values for the two signals were averaged.
Statistics
The effects of speed and load were assessed by a mixed-model ANOVA, which included individual as a factor. A general linear model that included first order interaction effects was used to determine significant differences in muscle fascicle strain and strain rate, as well as EMG intensity and timing variables. All tests were conducted in Systat (version 10.2 for PC) with a significance level of P < 0.05. Population means for each variable were calculated from the average for each individual, and are reported with standard errors, unless otherwise noted.
RESULTS
Metabolic rate
Consistent with previous studies, there was a significant increase in metabolic power with speed and with a ~22% body wt trunk load at each speed (Fig. 2A; P < 0.001). For both unloaded and loaded conditions, metabolic power increased linearly with speed over the range measured. The ratio of loaded to unloaded metabolic power was not significantly different between speeds and averaged 1.17 ± 0.02 (Fig. 2B). The load carried by the birds yielded a loaded to unloaded weight ratio of 1.22 ± 0.02; thus the increase in metabolic energy rate at each speed represented 77% of the increase in weight.
Fig. 2.
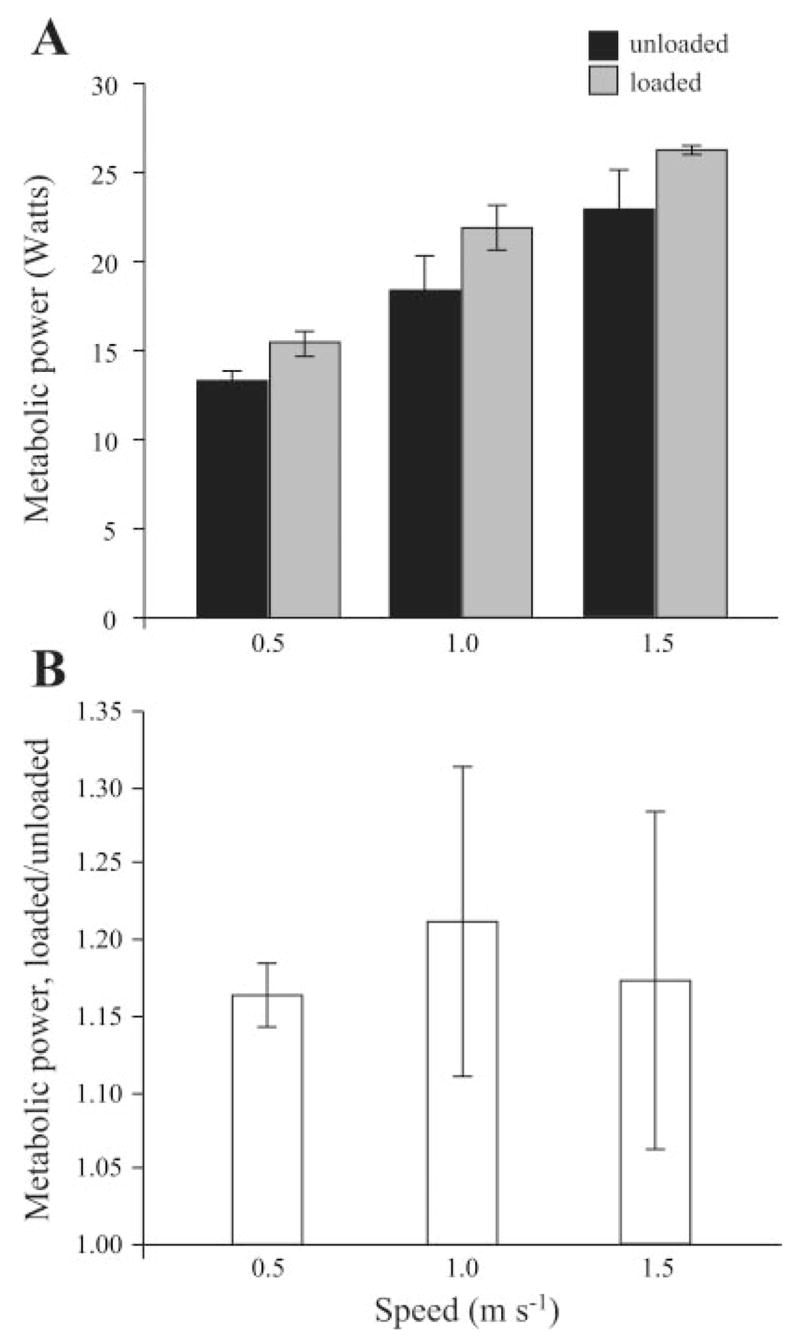
A: metabolic power increased significantly with both speed and load (P < 0.001). The load carried averaged 22% of body mass, representing a fractional weight increase of 1.22. B, the fractional increase in metabolic power (loaded/unloaded) was not significantly different between speeds and averaged 1.17 across speeds. Error bars represent ±1 SE.
Kinematics
Load carrying resulted in little or no significant difference in kinematics at any speed. Stride time, stance time, and swing time were very consistent and nearly identical between loaded and unloaded conditions (Fig. 3). Although there were changes due to speed, joint kinematics at the hip, knee, and ankle were largely unaffected by load carrying at any given speed. Average joint angles for one speed, 1.5 m/s, are shown in Fig. 4 and are consistent with those observed at the other speeds. The only significant deviation from the stance phase pattern observed during unloaded walking and running occurred at the knee during the last 35% of stance (Fig. 4B), when the knee underwent less extension in loaded trials. This difference was only seen at the two fastest speeds (1.5 and 3.0 m/s).
Fig. 3.
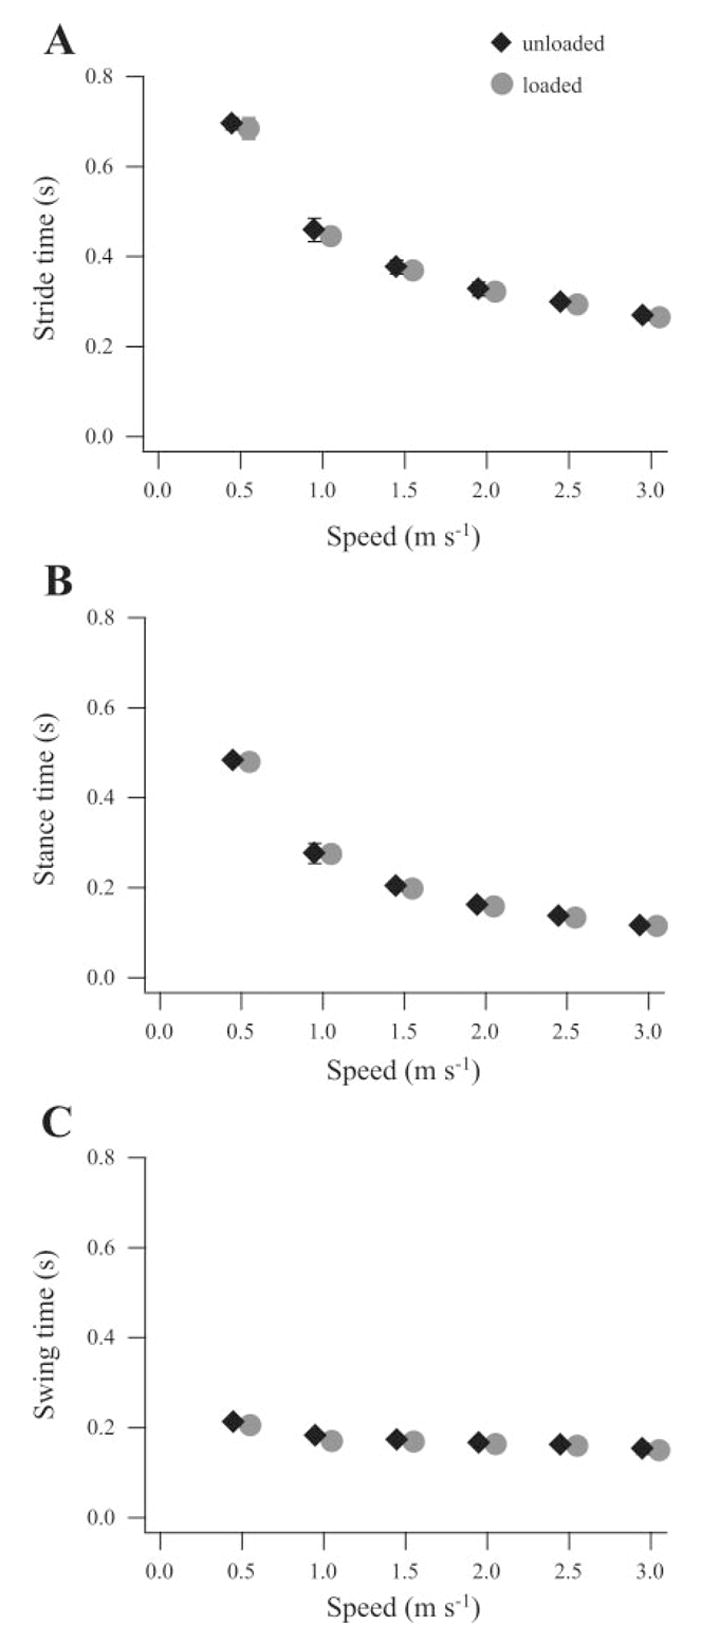
Stride times (A), stance times (B), and swing times (C) measured across a wide range of speeds did not differ significantly during loaded vs. unloaded conditions. All variables were measured at the same speeds. Graphed data points are offset slightly on the x-axis for clarity. Error bars represent ±1 SE.
Fig. 4.

Average joint angle patterns for 1 complete stride at 1.5 m/s are plotted for loaded vs. unloaded conditions. No significant differences in joint angular motion due to loading were observed at the hip or the ankle at any recorded speed. The knee showed a slight but significantly greater flexion during the last 35% of stance at 1.5 and 3.0 m/s (not shown). Shaded area represents stance phase. Dashed lines represent ±1 SE.
Muscle strain and shortening velocity
Load carrying predominately resulted in increased active stretch of the ILPO during stance at all speeds (Fig. 5). The ILPO consistently underwent an active stretch at the beginning of stance followed by a shortening phase and subsequent short, brief stretch at the end of stance. The initial stretch occurred as the knee flexed, whereas subsequent muscle shortening occurred during (and likely contributed to) hip extension. The final stretch of the muscle occurred as both the knee and the hip flexed at the end of stance. Because this last stretch likely occurs when force in the muscle is low, we chose to focus our analysis on the dominant stretch-shortening cycle of the muscle that occurs over the majority of stance (Fig. 7, inset). During load carrying the ILPO tended to be relatively shorter (mean difference: 3.4 ± 1.1%) at the onset of foot contact at all speeds, although this difference was not significant (P = 0.157). Both speed and load had a significant effect on the magnitude of stretch in the ILPO (P = 0.007 and P = 0.010, respectively); however, only speed had a significant effect on shortening magnitude (P = 0.02; see Fig. 7A). No effect (P = 0.18) of load carrying was observed with respect to the amount of ILPO shortening at all speeds.
Fig. 5.
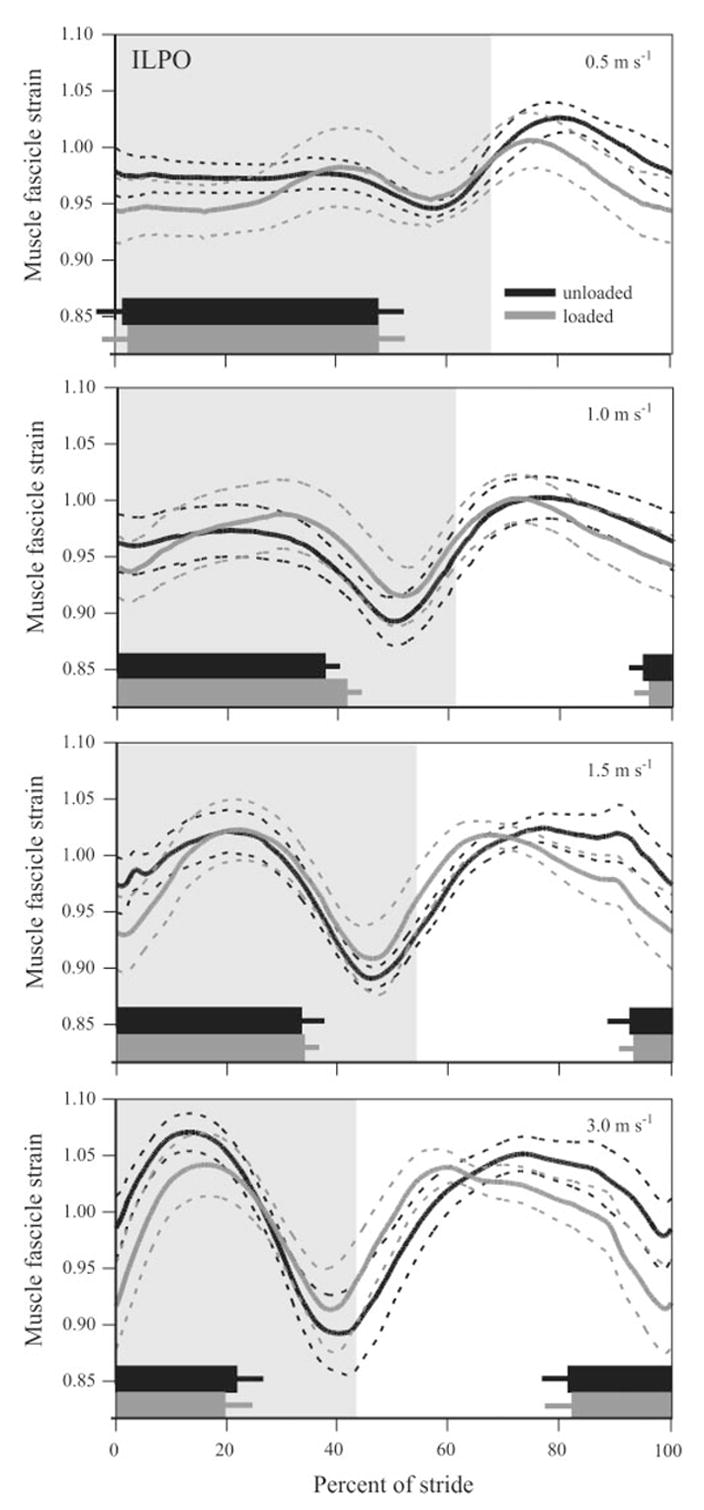
Mean in vivo muscle fascicle strain patterns recorded from the ILPO across all animals (n = 4) plotted vs. percent of stride for all speed and load conditions. Relative timing of EMG onset and duration during unloaded (black) and loaded (gray) conditions are shown as thick bars at each speed. The ILPO is active before foot down with EMG onset occurring during the swing phase, except at 0.5 m/s, in which the error bars extend beyond the y-axis. Shaded areas indicate stance phase. Dashed lines and error bars represent ±1 SE. Note: thickness of the EMG bars does not indicate relative intensity.
Fig. 7.
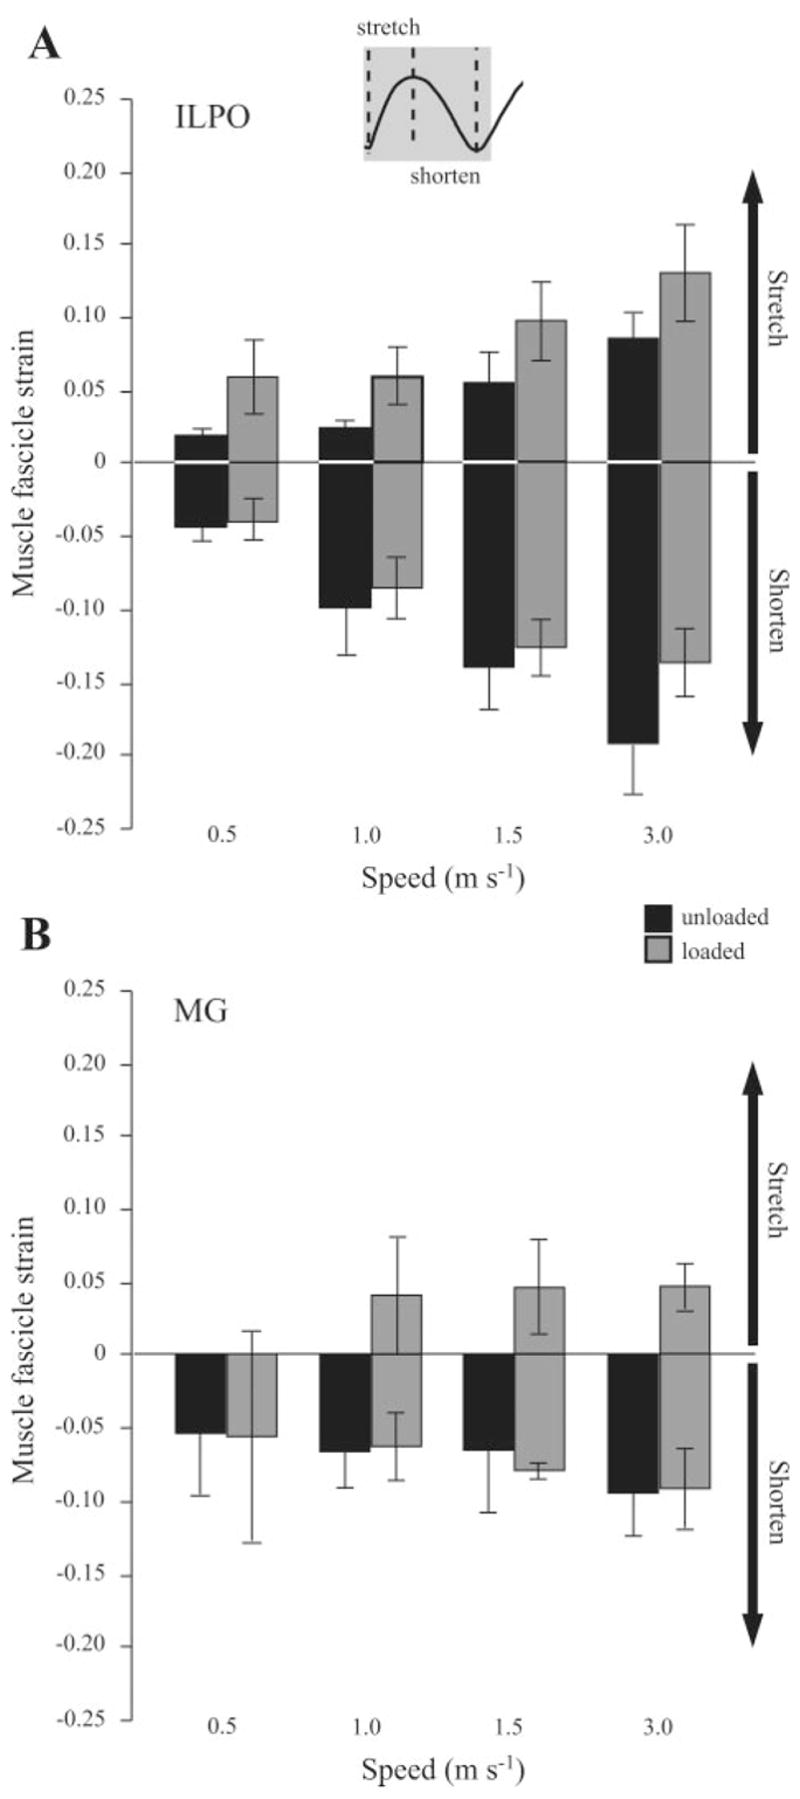
Mean fascicle strains measured for the ILPO and MG under all conditions. A schematic (inset, top center) denotes the periods during limb support when lengthening (positive) and shortening (negative) strains were quantified from the recorded in vivo strain patterns. A: for the ILPO, both speed and load had a significant effect on fascicle stretch, whereas only speed had a significant effect on shortening. B: for the MG, only loading had a significant effect, increasing fascicle stretch at the three fastest speeds. No significant effect on shortening strain was apparent, and no differences due to speed were observed.
In general, the MG underwent relatively less strain during stance than the ILPO (Figs. 6 and 7) but showed the same nonsignificant trend of contracting at relatively shorter length (mean difference 4.7 ± 0.8%) at the onset of foot contact during loaded conditions. Notably, the MG began showing an initial phase of stretch at 1.0 m/s during loaded trials (Figs. 6 and 7B), which is typically considered to be the transition speed between walking and running in these animals (25). The magnitude of this stretch was relatively small (~5%) and was not related to an observable shift in joint kinematics at either the ankle or the knee. Other than for beginning its contraction at a shorter length, this initial stretch due to load was the only significant difference in muscle fascicle strain found in the MG at the three higher speeds (Fig. 7B, P < 0.001).
Fig. 6.
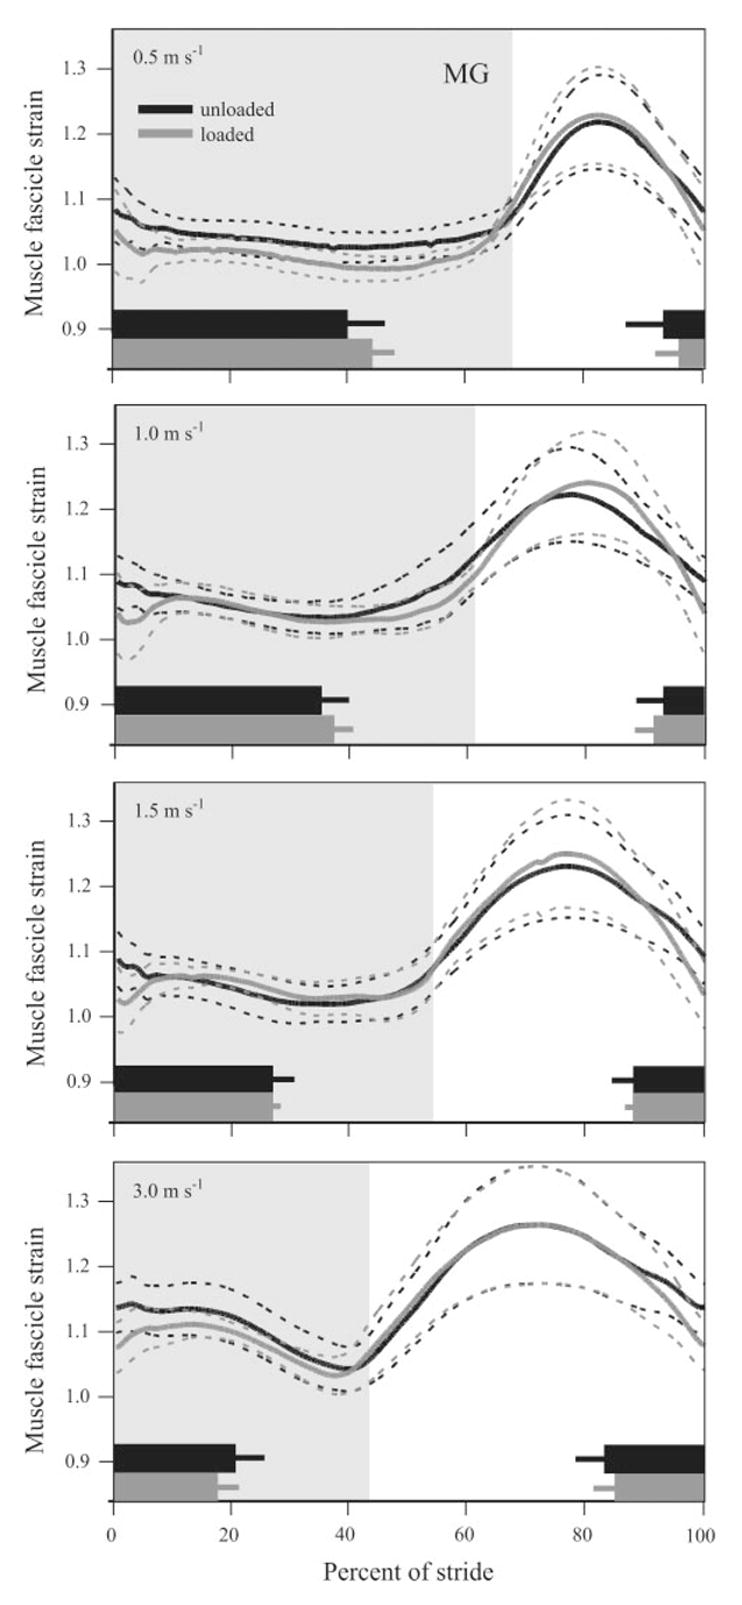
Mean in vivo muscle fascicle strain patterns recorded from the MG under all conditions, plotted as in Fig. 5.
Mean muscle fascicle strain rate was determined during the primary stretch and shortening periods for which strain was measured. By definition, positive values represent stretching velocities and negative values represent shortening velocities of the muscle (Fig. 8). In the ILPO, both the velocity of stretching and shortening increased significantly with speed (P = 0.013 and P < 0.001, respectively) but were unaffected by load (P = 0.213 and P < 0.187, respectively). At the highest speed, the shortening strain rate tended to be less during loaded trials; however, this difference was not significant (P = 0.09 at 3.0 m/s). Consistent with the lower strains observed in the MG, strain rates were also relatively lower in this muscle than in the ILPO (Fig. 8). Because there was no initial stretch in MG in the unloaded condition, loading had a significant effect on lengthening velocity (P < 0.001); however, shortening strain rate was not significantly affected by load (P = 0.214). As with the ILPO, fascicle shortening rate increased significantly with speed in the MG (P = 0.005).
Fig. 8.
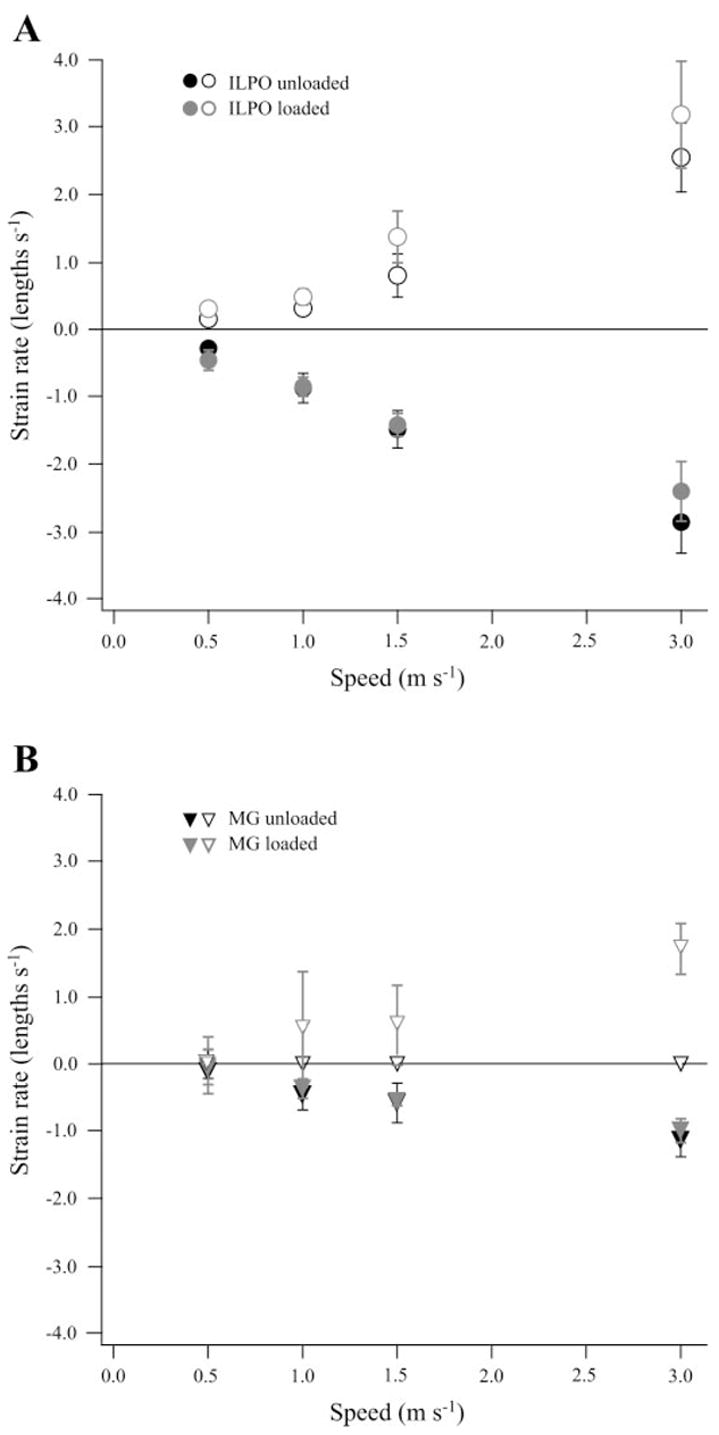
A: in the ILPO, lengthening (open symbols) and shortening strain rate (filled symbols) were not significantly different between unloaded (black) vs. loaded (gray) conditions at any speed. B: in the MG, only lengthening strain rate increased significantly with load; however, this largely reflects the fact that there was no lengthening during unloaded locomotion. Strain rate increased significantly with speed in the ILPO under both conditions and in the MG when animals were loaded.
EMG activity
Running speed and load carrying had a significant effect on relative EMG intensity (mean spike amplitude); however, only speed had an effect on EMG duration and timing. In the ILPO, both speed (P < 0.001) and load (P = 0.019) caused a significant increase in EMG intensity (Fig. 9A). The relative increases in intensity between loaded and unloaded conditions were not significantly different across speeds, averaging 17%. The MG showed a similar trend, with EMG intensity increasing significantly with both speed and load (Fig. 9B; P < 0.001 for both). Relative increases in EMG intensity due to load were again not significantly different across speeds, but were higher than those found in the ILPO, with a mean increase of 27% across speeds. EMG duration was not effected by load but decreased significantly with speed in both muscles (P < 0.001, Figs. 5 and 6). The timing of EMG onset was also unaffected by load carrying; however, the time of activation before foot contact increased significantly with speed in both muscles (P < 0.05).
Fig. 9.
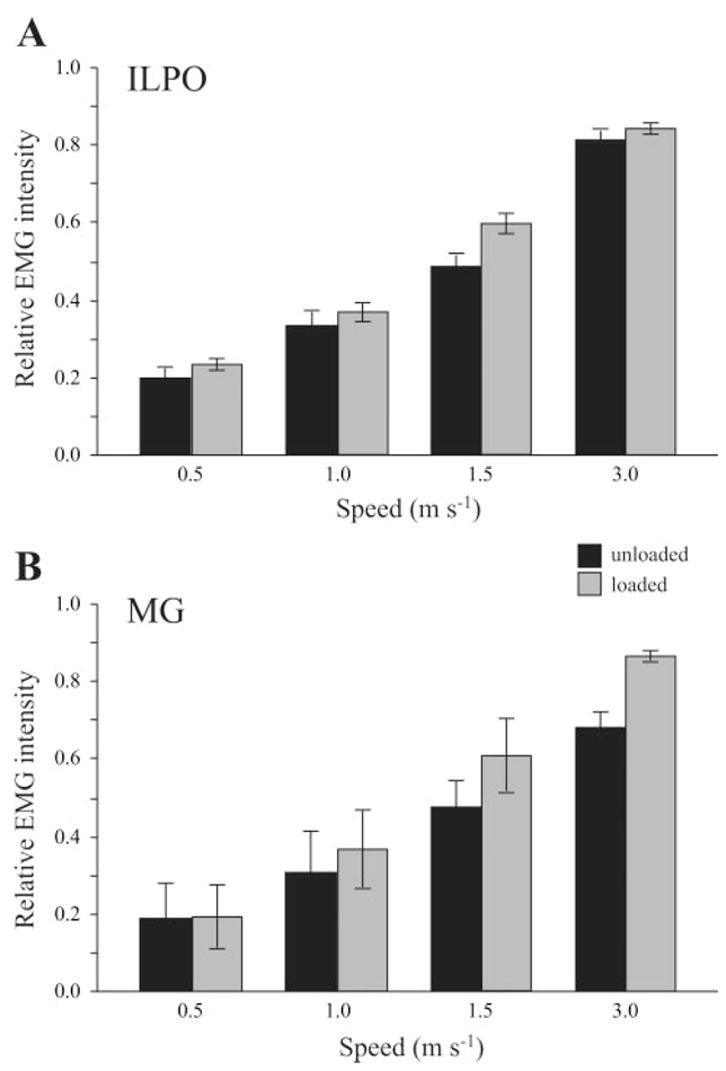
In both the ILPO (A) and the MG (B), relative EMG intensity (mean spike amplitude; see text for details) increased significantly with speed and load. Error bars represent ±1 SE.
DISCUSSION
A main goal of our study was to test whether the contractile patterns of two major hindlimb extensors of guinea fowl are altered by load-carrying exercise. We hypothesized that a decrease in muscle fascicle strain rate (shortening velocity) or enhanced stretch activation of the muscles, both of which might reduce the muscle’s cost of generating force, would produce a reduction in locomotor energy cost relative to the load carried. We proposed that changes in kinematics, such as an increase in time of foot contact at a given speed, may enable this reduction in fascicle shortening rate, thereby allowing the muscles to more economically generate the forces required for weight support.
Our results show that, when guinea fowl were loaded with ~22% of their body weight, their limb kinematics did not change at any given speed. Although no significant changes in shortening velocity of the ILPO and MG were observed, active fascicle stretch during early stance increased in both muscles at nearly all speeds during loaded conditions. Increased active stretching enhances force production (40) and, as a result, likely increases a muscle’s economy for generating force (6, 45). For the two muscles we examined, the increase in force required to carry the additional load was also clearly achieved through an increase in muscle recruitment, as indicated by an increase in EMG intensity. In the ILPO, the increase in EMG intensity was less than proportional to the increase in weight; supporting our interpretation that force enhancement via stretch may facilitate the ILPO’s force production. In the MG, the increase in EMG intensity was greater than proportional to the load. The collective results from EMG analysis and metabolic energetics suggest that, on average, increases in leg muscle recruitment during stance are proportional to increases in trunk-supported weight.
Kinematics
On the basis of previous work (15, 30, 36, 42, 46), our null hypothesis was that kinematics would not be significantly changed during load carrying. However, on the basis of the observations that some animals and humans alter their kinematic patterns to some degree when carrying a load (9, 13, 32, 38, 48), we proposed that muscle function might also be altered under these conditions. In this study, we found no significant changes in time of contact and only small changes in joint angle kinematics due to an ~22% body load at any speed. This differs slightly from recent observations of Marsh et al. (38) in a similar load-carrying study of guinea fowl, who found a small 4% increase in time of contact. In the present study, we also observed a slight decrease in knee extension during stance; however, this was only significant at the two fastest speeds measured (Fig. 4). Thus our kinematic results support the null hypothesis of our study. It should be pointed out that all of the animals in our study underwent a relatively long training period and were well accustomed to running with the added load at the time of data collection. It is possible that greater differences in kinematics would be observed when the animals carried the load for the first time.
Muscle strain and strain rate
One of the primary goals of our study was to determine whether muscle contractile strain pattern was influenced by load carrying. Specifically, would changes in contractile strain pattern reduce a muscle’s cost for generating force? Two possibilities were examined: lower strain rate and increased stretch at onset of muscle activation. Consistent with the results for time of foot contact, we found no significant changes in fascicle shortening rate due to load (Fig. 7). The reduction in knee extension during loaded running at higher speeds was associated with a trend toward reduced fascicle shortening in the ILPO (Fig, 6), which was significant at the highest speed. However, the duration of muscle shortening decreased during this time as well, resulting in mean shortening velocities that were not significantly different between loaded and unloaded conditions. Importantly, however, we observed a significant increase in the degree of active fascicle stretch early in limb support during knee and ankle flexion. The magnitude of fascicle stretch increased under loaded conditions at all speeds in the ILPO and all except at the slowest speed in the MG (Fig. 7). Active stretch of whole muscles and isolated muscle fibers generate more force per unit muscle (1, 17, 23, 31, 33), with the amount of force enhancement being shown to be rate dependent. Thus both the increased magnitude (Fig. 6) and rate (Fig. 7) of stretch of the ILPO suggest that the muscle produces more force per active volume of recruited fibers during loaded vs. unloaded exercise conditions. The magnitude of force enhancement due to stretch remains uncertain but is likely to range up to 1.75 times a muscle’s isometric force (3, 7, 16, 23). In addition to our hypothesis that active stretching at the beginning of stance may serve to improve a muscle’s force output, Marsh (37) suggested that it may also play a role in providing stability. Thus, despite finding no change in limb kinematics, our hypothesis that this would correspond to no changes in muscle contractile pattern is unsupported. Given the complex interplay of muscle-tendon force transmission and length change, perhaps this is not surprising.
The fascicle strain patterns of both the ILPO (Fig. 4) and the MG (Fig. 5) for normal and load-carriage conditions indicate that the two muscles contract with limited length change (isometric) during the stance phase of the stride at slower speeds, or with increasingly stretch-shortening behavior at faster speeds. This behavior is consistent with the function of these muscles serving mainly as struts to stabilize the limb for more economical weight support and to facilitate springlike behavior of the limb as a whole (6, 10, 14, 37). For both muscles, net shortening strain of the fascicles was <10% and much of this shortening occurred late in stance when muscle and ground forces are declining, suggesting that the amount of work performed by these muscles is relatively small. Interestingly, the MG shows less net shortening than the lateral gastrocnemius (14) over a range of speeds of locomotion, suggesting that the lateral gastrocnemius performs most of the muscle work at the ankle joint. However, the isometric or stretch-shortening behavior of the MG is consistent with significant elastic strain energy storage in the Achilles tendon shared by these two muscles, and this is borne out by the flexion-extension behavior of the ankle joint itself (Fig. 3).
Muscle recruitment and metabolic cost
Because the ILPO and MG are actively recruited to support weight during stance, we predicted that the relative increase in EMG intensity of these muscles would be proportional to the relative increase in weight carried by the animal. This prediction assumes that the contractile pattern in these muscles is the same for both unloaded and loaded conditions; however, this was not the case. In the ILPO, the average increase in EMG intensity was 17% for a 22% load (Fig. 10), consistent with force enhancement due to increased active stretching of the muscle in early stance. By comparison, the average EMG intensity in the MG increased by 27%, in addition to undergoing greater active stretch during load carrying. This suggests a disproportionately greater increase in force production than required to support the additional load against gravity. One possible explanation for this is an increased need for braking and propulsive ground forces during loaded exercise. Adding a load to the body increases the mass that must be accelerated as well as supported against gravity, increasing the work that must be done. Recent modeling (19, 35) and experimental studies (11, 12, 29) of humans suggest that this cost is between 30 and 45% of the total cost of locomotion and the work is primarily done by ankle extensors (27, 43). It is also important to note that the relationship between EMG intensity and muscle force production is complex and likely nonlinear, given the recruitment of progressively larger fibers (faster motor units) at faster speeds and greater loads. Finally, there is little evidence to date that different limb muscles share equally in supporting additional loads that animals may carry. Consequently, differences in recruitment level and force output by different muscles may be expected to vary. Nevertheless, despite these caveats, our results based on our recordings of the ILPO and MG clearly indicate that the increased force requirement of load carrying is met mainly by increased muscle recruitment, which together matched the ~22% body wt load that the animals carried.
Fig. 10.
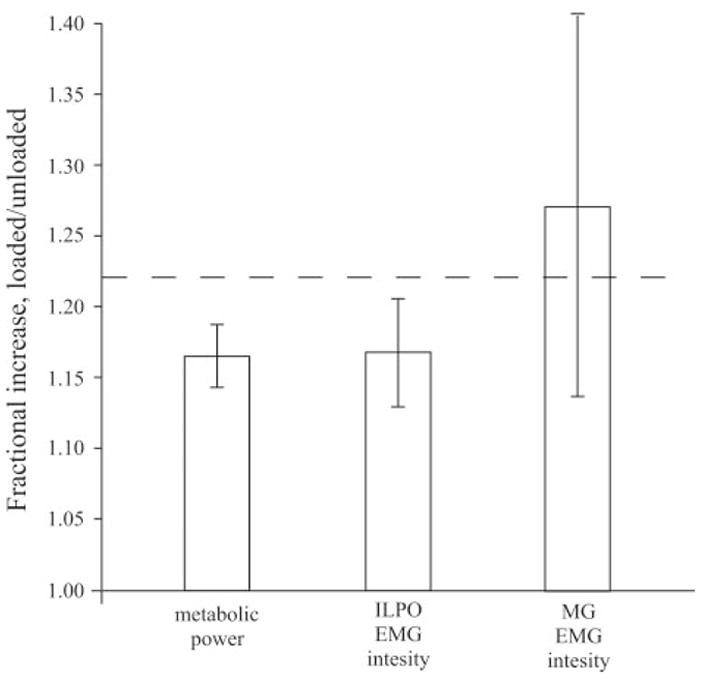
Fractional increases in metabolic power and EMG intensity in both muscles averaged across 0.5, 1.0, and 1.5 m/s were not significantly different. Dashed line represents the fractional increase in mass due to load (1.22). EMG intensity for 3.0 m/s was not included because oxygen consumption data were not available at this speed.
We also expected that increases in muscle recruitment for greater force production would be associated with increases in the recruited volume of active muscle and thus should be reflected in changes in metabolic cost. Averaged across speeds, the relative increase in metabolic power was 17%, which corresponded to 77% of the relative increase in trunk-supported weight (Fig. 10). This is nearly identical to the increase in EMG intensity in the ILPO (Fig. 10). The fractional increase in blood flow to the ILPO during trunk loading (~18%) is also nearly identical to the increase in EMG intensity (22). Given its large size (26) and disproportionately high blood flow during exercise (21, 22, 39), the activity of this muscle likely has a large influence on the overall metabolic cost of locomotion in guinea fowl. However, the fractional increase in blood flow to the MG during trunk loaded running (22) is far less (~6%) than the increase in EMG intensity that we observe here (27%). Several factors, such as the degree of active stretching and subsequent shortening, differences in fiber type, and possible regional differences in recruitment levels within the two muscles at different levels of exercise intensity, are likely to influence EMG intensity and blood flow in different ways. To date, the relationships among EMG activity, blood flow and whole animal metabolic cost have yet to be explored in detail. Consequently, our differing results for these two muscles indicates that EMG intensity alone is not a reliable predictor of metabolic cost.
Recent studies of metabolic cost distribution between stance and swing phases suggest that swing phase accounts for ~25% of the total cost of locomotion (18, 28, 38, 39, 41). Therefore, given an average increase in EMG intensity of stance phase muscles that is directly proportional to the increase in load (22% for each) we predicted that metabolic cost would increase by 75% of the increase in load, or by 16.5%. Our observation of a 17% increase in metabolic cost is consistent with this prediction. Thus, even though overall patterns of kinematics and energetics suggest little or no change in the contractile patterns of the muscles during loading, our results show that this is clearly not the case for the guinea fowl ILPO and MG. It is also evident that muscles in the leg do not all respond to loading in a uniform manner and likely serve multiple functions in addition to weight support. Additional work is needed to test the generality of our results for other limb muscles and other animals. Nevertheless, the results for the two hindlimb muscles studied here show that care must be taken when making simplifying assumptions regarding muscle function in relation to load-carrying exercise.
Acknowledgments
The authors thank Pedro Ramirez for excellent care of the animals throughout the experiment. We thank Monica Daley for sharing advice and expertise on statistical analysis and muscle function in guinea fowl. Finally, we thank all of the members of our laboratory group and three anonymous reviewers for helpful comments on earlier drafts of this manuscript.
This study was funded by National Institute of Arthritis and Musculoskeletal and Skin Diseases Grant AR-04769 (to A. A. Biewener).
References
- 1.Abbott BC, Aubert XM. The force exerted by active striated muscle during and after change of length. J Physiol. 1952;117:77–86. [PMC free article] [PubMed] [Google Scholar]
- 2.Alexander MR, Vernon A. Mechanics of hopping by kangaroos (Macropodidae) J Zool Lond. 1975;177:265–303. [Google Scholar]
- 3.Avis FJ, Toussaint HM, Huijing PA, van Ingen Schenau GJ. Positive work as a function of eccentric load in maximal leg extension movements. Eur J Appl Physiol. 1986;55:562–568. doi: 10.1007/BF00421653. [DOI] [PubMed] [Google Scholar]
- 4.Biewener AA, Farley CT, Roberts TJ, Temaner M. Muscle mechanical advantage of human walking and running: implications for energy cost. J Appl Physiol. 2004;97:2266–2274. doi: 10.1152/japplphysiol.00003.2004. [DOI] [PubMed] [Google Scholar]
- 5.Biewener AA, Corning WR. Dynamics of mallard (Anas platyrhynchos) gastrocnemius function during swimming versus terrestrial locomotion. J Exp Biol. 2001;204:1745–1756. doi: 10.1242/jeb.204.10.1745. [DOI] [PubMed] [Google Scholar]
- 6.Biewener AA, Roberts TJ. Muscle and tendon contributions to force, work, and elastic energy savings: a comparative perspective. Exerc Sport Sci Rev. 2000;28:99–107. [PubMed] [Google Scholar]
- 7.Biewener AA, Blickhan R, Perry AK, Heglund NC, Taylor CR. Muscle force during locomotion in kangaroo rats: force platform and tendon buckle measurements compared. J Exp Biol. 1988;137:191–205. doi: 10.1242/jeb.137.1.191. [DOI] [PubMed] [Google Scholar]
- 8.Blaxter K. Energy Metabolism in Animals and Man. Cambridge, UK: Cambridge University Press; 1989. [Google Scholar]
- 9.Bourdin M, Belli A, Arsac LM, Bosco C, Lacour JR. Effect of vertical loading on energy cost and kinematics of running in trained male subjects. J Appl Physiol. 1995;79:2078–2085. doi: 10.1152/jappl.1995.79.6.2078. [DOI] [PubMed] [Google Scholar]
- 10.Carr JA, Ellerby D, Hoogendyk TA, Rubenson J, Marsh RL. Differential strain in an architecturally complex muscle (Abstract) Comp Biochem Physiol. 2005;141A(S3):S154. [Google Scholar]
- 11.Chang YH, Kram R. Metabolic cost of generating horizontal forces in running. J Appl Physiol. 1999;86:1657–1662. doi: 10.1152/jappl.1999.86.5.1657. [DOI] [PubMed] [Google Scholar]
- 12.Chang YH, Huang HWC, Hamerski CM, Kram R. The independent effects of gravity and inertia on running mechanics. J Exp Biol. 2000;203:229–238. doi: 10.1242/jeb.203.2.229. [DOI] [PubMed] [Google Scholar]
- 13.Cooke CB, McDonagh MJN, Nevill AM, Davies CTM. Effects of load on oxygen intake in trained boys and men during treadmill running. J Appl Physiol. 1991;71:1237–1244. doi: 10.1152/jappl.1991.71.4.1237. [DOI] [PubMed] [Google Scholar]
- 14.Daley MA, Biewener AA. Muscle force-length dynamics during level versus inclined locomotion: a comparison of in-vivo performance in two guinea fowl ankle extensors. J Exp Biol. 2003;206:2941–2958. doi: 10.1242/jeb.00503. [DOI] [PubMed] [Google Scholar]
- 15.Davies CTM. Metabolic cost of exercise and physical performance in children with some observations on external loading. Eur J Appl Physiol Occup Physiol. 1980;45:95–102. doi: 10.1007/BF00421316. [DOI] [PubMed] [Google Scholar]
- 16.De Graaf JB, Bobbert MF, Tetteroo WE, van Ingen Schenau GJ. Mechanical output about the ankle in countermovement jumps and jumps with extended knees. Hum Mov Sci. 1987;6:333–347. [Google Scholar]
- 17.De Ruiter CJ, Didden WJM, Jones DA, De Haan A. The force-velocity relationship of human adductor pollicis muscle during stretch and the effects of fatigue. J Physiol. 2000;526:671–681. doi: 10.1111/j.1469-7793.2000.00671.x. [DOI] [PMC free article] [PubMed] [Google Scholar]
- 18.Doke J, Donelan JM, Kuo AD. Mechanics and energetics of swinging the leg. J Exp Biol. 2005;208:439–445. doi: 10.1242/jeb.01408. [DOI] [PubMed] [Google Scholar]
- 19.Donelan JM, Kram R, Kuo AD. Mechanical work for step-to-step transitions is a major determinant of the metabolic cost of human walking. J Exp Biol. 2002;205:3717–3727. doi: 10.1242/jeb.205.23.3717. [DOI] [PubMed] [Google Scholar]
- 20.Ellerby DJ, Cleary M, Marsh RL, Buchanan CI. Measurement of oxygen consumption in guinea fowl Numida meleagris indicates that birds and mammals display a similar diversity of aerobic scopes during running. Physiol Biochem Zool. 2003;76:695–703. doi: 10.1086/376430. [DOI] [PubMed] [Google Scholar]
- 21.Ellerby DJ, Henry HT, Carr JA, Buchanan CI, Marsh RL. Blood flow in guinea fowl Numida meleagris as an indicator of energy expenditure by individual muscles during walking and running. J Physiol. 2005;564:631–648. doi: 10.1113/jphysiol.2005.082974. [DOI] [PMC free article] [PubMed] [Google Scholar]
- 22.Ellerby DJ, Marsh RL. The energetic cost of trunk and distal limb loading during walking and running in guinea fowl Numida meleagris: II. Muscle energy use as indicated by blood flow. J Exp Biol. 209:2064–2075. doi: 10.1242/jeb.02227. [DOI] [PubMed] [Google Scholar]
- 23.Ettema GJC, Huijing PA, de Haan A. The potentiating effects of prestretch on the contractile performance of rat gastrocnemius medialis muscle during subsequent shortening and isometric contractions. J Exp Biol. 1992;165:121–136. doi: 10.1242/jeb.165.1.121. [DOI] [PubMed] [Google Scholar]
- 24.Fedak MA, Rome L, Seeherman HJ. One-step N2-dilution technique for calibrating open-circuit V̇o2 measuring systems. J Appl Physiol. 1981;51:772–776. doi: 10.1152/jappl.1981.51.3.772. [DOI] [PubMed] [Google Scholar]
- 25.Gatesy SM. Guinea fowl hind limb function. II. Electromyographic analysis and motor pattern evolution. J Morphol. 1999;240:127–142. doi: 10.1002/(SICI)1097-4687(199905)240:2<127::AID-JMOR4>3.0.CO;2-Q. [DOI] [PubMed] [Google Scholar]
- 26.Gillis GB, Biewener AA. Hindlimb muscle function in relation to speed and gait: in vivo patterns of strain and activation in a hip and knee extensor of the rat (Rattus norvegicus) J Exp Biol. 2001;204:2717–2731. doi: 10.1242/jeb.204.15.2717. [DOI] [PubMed] [Google Scholar]
- 27.Gottschall JS, Kram R. Energetic cost and muscular activity required for propulsion during walking. J Appl Physiol. 2003;94:1766–1772. doi: 10.1152/japplphysiol.00670.2002. [DOI] [PubMed] [Google Scholar]
- 28.Gottschall JS, Kram R. Energetic cost and muscular activity required for leg swing during walking. J Appl Physiol. 2005;99:23–30. doi: 10.1152/japplphysiol.01190.2004. [DOI] [PubMed] [Google Scholar]
- 29.Grabowski A, Farley CT, Kram R. Independent metabolic costs of supporting body weight accelerating body mass during walking. J Appl Physiol. 2005;98:579–583. doi: 10.1152/japplphysiol.00734.2004. [DOI] [PubMed] [Google Scholar]
- 30.Griffin TM, Roberts TJ, Kram R. Metabolic cost of generating muscular force in human walking: insights from load-carrying and speed experiments. J Appl Physiol. 2003;95:172–183. doi: 10.1152/japplphysiol.00944.2002. [DOI] [PubMed] [Google Scholar]
- 31.Herzog W, Leonard TR. Force enhancement following stretching of skeletal muscle: a new mechanism. J Exp Biol. 2002;205:1275–1283. doi: 10.1242/jeb.205.9.1275. [DOI] [PubMed] [Google Scholar]
- 32.Hoyt DF, Wickler SJ, Cogger EA. Time of contact and step length: the effect of limb length, running speed, load carrying and incline. J Exp Biol. 2000;203:221–227. doi: 10.1242/jeb.203.2.221. [DOI] [PubMed] [Google Scholar]
- 33.Josephson RK. Dissecting muscle power output. J Exp Biol. 1999;202:3369–3375. doi: 10.1242/jeb.202.23.3369. [DOI] [PubMed] [Google Scholar]
- 34.Kram R, Taylor CR. Energetics of running: a new perspective. Nature. 1990;346:265–267. doi: 10.1038/346265a0. [DOI] [PubMed] [Google Scholar]
- 35.Kuo AD, Donelan M, Ruina A. Energetic consequences of walking like an inverted pendulum: step-to-step transitions. Exerc Sport Sci Rev. 2005;33:88–97. doi: 10.1097/00003677-200504000-00006. [DOI] [PubMed] [Google Scholar]
- 36.Maloiy GMO, Heglund NC, Prager LM, Cavagna GA, Taylor CR. Energetic cost of carrying loads: have African women discovered an economic way? Nature. 1986;319:668–669. doi: 10.1038/319668a0. [DOI] [PubMed] [Google Scholar]
- 37.Marsh RL. How muscles deal with real-world loads: the influence of length trajectory on muscle performance. J Exp Biol. 1999;202:3377–3385. doi: 10.1242/jeb.202.23.3377. [DOI] [PubMed] [Google Scholar]
- 38.Marsh RL, Ellerby DJ, Henry HT, Rubenson J. The energetic cost of trunk and distal limb loading during walking and running in guinea fowl Numida meleagris: I. Organismal metabolism and biomechanics. J Exp Biol. 2006;209:2050–2063. doi: 10.1242/jeb.02226. [DOI] [PubMed] [Google Scholar]
- 39.Marsh RL, Ellerby DJ, Carr JA, Henry HT, Buchanan CI. Partitioning the energetics of walking and running: swinging the limbs is expensive. Science. 2004;303:80–83. doi: 10.1126/science.1090704. [DOI] [PubMed] [Google Scholar]
- 40.McMahon TA. Muscles, Reflexes, and Locomotion. Princeton, NJ: Princeton University Press; 1984. pp. 3–21. [Google Scholar]
- 41.Modica JR, Kram R. Metabolic energy and muscular activity required for leg swing in running. J Appl Physiol. 2005;98:2126–2131. doi: 10.1152/japplphysiol.00511.2004. [DOI] [PubMed] [Google Scholar]
- 42.Myers MJ, Steudel K. Effects of limb mass and its distribution on the energetic cost of running. J Exp Biol. 1985;116:363–373. doi: 10.1242/jeb.116.1.363. [DOI] [PubMed] [Google Scholar]
- 43.Neptune RR, Kautz SA, Zajac F. Contributions of individual plantar flexors to support, forward progression and swing initiation during walking. J Biomech. 2001;34:1387–1398. doi: 10.1016/s0021-9290(01)00105-1. [DOI] [PubMed] [Google Scholar]
- 44.Roberts TJ, Kram R, Weyand PG, Taylor CR. Energetics of bipedal running. I. Metabolic cost of generating force. J Exp Biol. 1998;201:2745–2751. doi: 10.1242/jeb.201.19.2745. [DOI] [PubMed] [Google Scholar]
- 45.Roberts TJ, Marsh RL, Weyand PG, Taylor CR. Muscular force in running turkeys: the economy of minimizing work. Science. 275:1113–1115. doi: 10.1126/science.275.5303.1113. [DOI] [PubMed] [Google Scholar]
- 46.Taylor CR, Heglund NC, McMahon TA, Looney TR. Energetic cost of generating muscular force during running, a comparison of large and small animals. J Exp Biol. 1980;86:9–18. [Google Scholar]
- 47.Taylor RC. Relating mechanics and energetics during exercise. Adv Vet Sci Comp Med. 1994;38:181–215. [PubMed] [Google Scholar]
- 48.Thorstensson A. Effects of moderate external loading on the aerobic demand of submaximal running in men and 10-year-old boys. Eur J Appl Physiol Occup Physiol. 1986;55:569–574. doi: 10.1007/BF00423198. [DOI] [PubMed] [Google Scholar]
- 49.Woltring HS. A FORTRAN for generalized, cross-validatory spline smoothing and differentiation. Adv Engng Software. 1986;8:104–113. [Google Scholar]