

Abstract
Muscle and fat cells develop insulin resistance when cultured under hyperinsulinemic conditions for sustained periods. Recent data indicate that early insulin signaling defects do not fully account for the loss of insulin action. Given that cortical filamentous actin (F-actin) represents an essential aspect of insulin regulated glucose transport, we tested to see whether cortical F-actin structure was compromised during chronic insulin treatment. The acute effect of insulin on GLUT4 translocation and glucose uptake was diminished in 3T3-L1 adipocytes exposed to a physiological level of insulin (5 nM) for 12 h. This insulin-induced loss of insulin responsiveness was apparent under both low (5.5 mM) and high (25 mM) glucose concentrations. Microscopic and biochemical analyses revealed that the hyperinsulinemic state caused a marked loss of cortical F-actin. Since recent data link phosphatidylinositol 4,5-bisphosphate (PIP2) to actin cytoskeletal mechanics, we tested to see whether the insulin-resistant condition affected PIP2 and found a noticeable loss of this lipid from the plasma membrane. Using a PIP2 delivery system, we replenished plasma membrane PIP2 in cells following the sustained insulin treatment and observed a restoration in cortical F-actin and insulin responsiveness. These data reveal a novel molecular aspect of insulin-induced insulin resistance involving defects in PIP2/actin regulation.
A continuous component of insulin resistance is hyperinsulinemia (1, 2). This compensatory increase in insulin during the insulin-resistant state initially offsets the reduced ability of insulin to stimulate GLUT41 translocation and glucose uptake, which is essential for the maintenance of blood glucose homeostasis. However, in vivo (3, 4) and in vitro (5, 6) studies demonstrate that the hyperinsulinemic state has a negative effect on insulin action.
Under normal insulin responsiveness, insulin efficiently promotes the removal of excess circulatory glucose by regulating the subcellular trafficking of the glucose transporter GLUT4 in muscle and fat cells (7). Activation of GLUT4 translocation by insulin requires a phosphatidylinositol 3-kinase (PI3K) signal involving the upstream insulin receptor (IR) and insulin receptor substrate (IRS) activators and the downstream protein kinase B (Akt) and C (PKC) target enzymes (7). Although distal Akt/PKC signaling parameters remain to be determined, a recent study (8) has identified a substrate of Akt (AS160) as a likely connection between the PI3K pathway and the vesicle trafficking machinery in GLUT4 translocation. In addition to the developing understanding of the PI3K pathway, data implicate that regulation of glucose transport by insulin may also entail the activation of a secondary pathway leading to the activation of the small GTPase TC10 (7). Even though this pathway is only partially understood, investigation suggests a role of TC10 in the control of actin dynamics (9–12). An essential role for actin in insulin-regulated glucose transport is well documented (13–15). Importantly, it has been shown that insulin elicits filamentous actin (F-actin) formation (12, 13, 16). Thus, insulin signaling to polymerize cortical F-actin apparently represents a required pathway for optimal movement or fusion of GLUT4-containing vesicle membranes to the cell surface.
To date, extensive study has built a good understanding of how insulin itself can be involved in the staging of diabetes. For example, chronic exposure to pharmacological doses of insulin (≥100 nM) have been shown by several laboratories (17–19) to markedly attenuate expression levels and/or activity states of the IR, IRS-1, PI3K, Akt, and GLUT4 proteins in 3T3-L1 adipocytes and, thus, produce a defect in the ability of the cell to respond to subsequent acute insulin stimulation with an increase in GLUT4 translocation and glucose transport. On the other hand, similar defects in the ability of insulin to acutely regulate the glucose transport system can be induced by physiological doses of insulin (≤5 nM) that are not associated with disturbances in early insulin signaling (20, 21). Therefore, defects positioned more distal in the insulin signaling pathway may contribute to the insulin-mediated cellular insulin resistance. In the present study, we provide evidence that sustained exposure of 3T3-L1 adipocytes to a physiological dose of insulin results in a marked loss of cortical F-actin. Concomitant with the disruption of the actin meshwork beneath the cell surface membrane, the hyperinsulinemic state induced a loss of phosphatidylinositol 4,5-bisphospate (PIP2) from the plasma membrane. Reversal of the loss of this lipid via carrier delivery of PIP2 back into the plasma membrane of insulin-resistant cells restored cortical F-actin structure and the ability of insulin to stimulate the glucose transport system under hyperinsulinemic conditions.
EXPERIMENTAL PROCEDURES
Materials
Murine 3T3-L1 preadipocytes were purchased from American Type Culture Collection (Manassas, VA). Dulbecco’s modified Eagle’s medium (DMEM) was from Invitrogen. Fetal bovine serum and bovine calf serum were obtained from Hyclone Laboratories Inc. (Logan, UT). Phosphatidylinositol 4,5-bisphosphate and histone complex were obtained from Echelon (Salt Lake City, UT). Monoclonal mouse phosphatidylinositol 4,5-bisphosphate antibody was purchased from Assay Designs Inc. (Ann Arbor, MI). Rhodamine red-X-conjugated donkey anti-rabbit or goat anti-mouse antibodies were from Jackson Immunoresearch Inc. (West Grove, PA). Fluorescein isothiocyanate-conjugated phalloidin, insulin, latrunculin B, and all other chemicals were from Sigma.
Cell Culture and Treatments
Murine 3T3-L1 preadipocytes were cultured in DMEM containing 25 mM glucose and 10% bovine calf serum at 37 °C in an 8% CO2 atmosphere. Confluent cultures were induced to differentiate into adipocytes as described previously (22). All studies were performed on adipocytes, which were between 8 and 12 days following differentiation. Prior to induction of insulin resistance, adipocytes were treated with DMEM, 5.5 mM glucose medium containing 10% fetal bovine serum for 36 –48 h. Cells were then incubated in a serum-free low glucose (5.5 mM) or high glucose (25 mM) media with or without 5 nM insulin for a period of 12 h. During the last 1 h of incubation, the cells were either left untreated or treated with different concentrations of phosphatidylinositol 4,5-bisphosphate-histone complex or 20 μM latrunculin B. Acute insulin stimulation was achieved by treating the cells with 100 nM insulin during the last 30 min of incubation.
Plasma Membrane Sheet Assay
Preparation of plasma membrane sheets was performed as described previously (23). Following the isolation of plasma membrane sheets, the sheets were fixed for 10 min at 25°C in a solution containing 2% paraformaldehyde, 70 mM KCl, 30 mM HEPES, pH 7.5, 5 mM MgCl2, and 3 mM EGTA, and these fixed membranes were used for indirect immunofluorescence.
Immunofluorescence and Phalloidin Staining
Fixed plasma membrane sheets were blocked in 5% donkey serum for 60 min at 25 °C, incubated overnight at 4 °C with a 1:500 dilution of polyclonal rabbit GLUT4 antibody (kindly provided by Dr. Jeffrey Pessin) or for 60 min at 25 °C with a 1:50 dilution of mouse phosphatidylinositol 4,5-bisphosphate antibody followed by incubation with a 1:50 dilution of rhodamine red-X-conjugated anti-rabbit for 60 min or anti-mouse immunoglobulin G for 45 min, respectively, at 25 °C. For whole cell phalloidin staining, following specific treatments, adipocytes were fixed for 20 min at 25 °C in a solution containing 4% paraformaldehyde, 0.2% Triton X-100, phosphate-buffered saline. For labeling of actin after fixation, cells were incubated with 5 μg/ml of fluorescein isothiocyanate-conjugated phalloidin for 2 h at 25 °C.
Subcellular Fractionation
Plasma membrane fractions were obtained using a differential centrifugation method described previously (23). Briefly, 3T3-L1 adipocytes were washed and resuspended in HES buffer (20 mM HEPES, pH 7.4, 1 mM EDTA, and 255 mM sucrose containing 1 mM phenylmethylsulfonyl fluoride, 10 μg/ml pepstatin, 10 μg/ml aprotinin, and 5 μg/ml leupeptin). Cell lysates were prepared by shearing the cells through a 22-gauge needle 10 times. Lysates were then centrifuged at 19,000 × g for 20 min at 4 °C. The crude plasma membrane pellet was resuspended in HES buffer and layered onto a 1.12 M sucrose cushion for centrifugation at 100,000 × g for 60 min. The plasma membrane layer was removed from the sucrose cushion and centrifuged at 40,000 × g for 20 min. Pelleted plasma membrane was resuspended in a detergent-containing lysis buffer and assayed for soluble protein content.
Preparation of F- and G-actin Extracts
After overnight incubations, F- and G-actin fractions were obtained using an F-actin/G-actin assay kit (catalog number: BK 037, Cytoskeleton, Denver, CO). Briefly, cells were rinsed with phosphate-buffered saline at 25 °C and scraped and homogenized in a lysis and F-actin stabilization buffer (LAS1). F-actin was then separated from G-actin by centrifugation at 100,000 × g for 60 min at 37 °C. The F-actin-containing pellet was resuspended in double distilled H2O containing 2 μM cytochalasin D at a volume equivalent to the G-actin-containing supernatant volume. The resuspended F-actin pellet was kept on ice for 60 min with mixing by pipette every 15 min to dissociate F-actin. After dissociation, dissociated F-actin was centrifuged at 14,000 × g for 10 min at 4 °C. The F-actin and G-actin preparations were then assayed for protein.
Electrophoresis and Immunoblotting
Actin fractions were separated by 12% SDS-polyacrylamide gel and membrane fractions (GLUT4 analyses) were separated by 10% SDS-polyacrylamide gel. The resolved proteins were transferred to nitrocellulose membrane and immunoblotted with a rabbit polyclonal G-actin antibody (catalog number: AAN01, Cytoskeleton) or a GLUT4 antibody. All immunoblots were subjected to enhanced chemiluminescence detection (Amersham Biosciences).
Statistical Analysis
Values are presented as means ± S.E. Analysis of variance was used to determine differences among groups. Where differences were indicated, the Fisher’s Test was used to verify significant differences between groups. p < 0.05 was considered to be significant.
RESULTS
Insulin-stimulated GLUT4 Translocation Is Impaired by Chronic Insulin Treatment
The generation of insulin resistance by exposure of 3T3-L1 adipocytes to a medium containing a high concentration of glucose and insulin has been well documented (20, 21, 24). In our initial experiments, 3T3-L1 adipocytes preincubated in control medium (25 mM glucose) exhibited a marked response to an acute maximal dose of insulin (30′ Ins) as assessed by GLUT4 immunofluorescence of highly purified plasma membrane sheets (Fig. 1A, compare panels 1 and 3). On the other hand, the presence of a physiological dose of insulin (5 nM) for 12 h was associated with an elevation of plasma membrane GLUT4 in the basal-state and a clear loss in the acute maximal insulin-stimulated GLUT4 translocation (Fig. 1A, panels 2 and 4). To confirm the accumulation of GLUT4 in the plasma membrane sheets, we used differential centrifugation to isolate plasma membrane fractions. Fractions prepared from control 3T3-L1 adipocytes displayed a characteristic insulin-stimulated increase in GLUT4 compared with plasma membrane fractions prepared from untreated cells (Fig. 1B, compare lanes 1 and 2). Consistent with microscopic analyses, the immunoblots showed that chronic insulin treatment was associated with an elevation of the basal-state plasma membrane GLUT4 level and a loss in the insulin-stimulated increment above basal (Fig. 1B, compare lanes 1–4). Densitometry analysis of four separate experiments shows that sustained insulin exposure tended to increase (p = 0.08) the basal-state plasma membrane level of GLUT4 and attenuate insulin-stimulated GLUT4 translocation by 42% (p < 0.05).
Fig. 1. Chronic insulin treatment impairs subsequent acute insulin stimulated GLUT4 translocation.
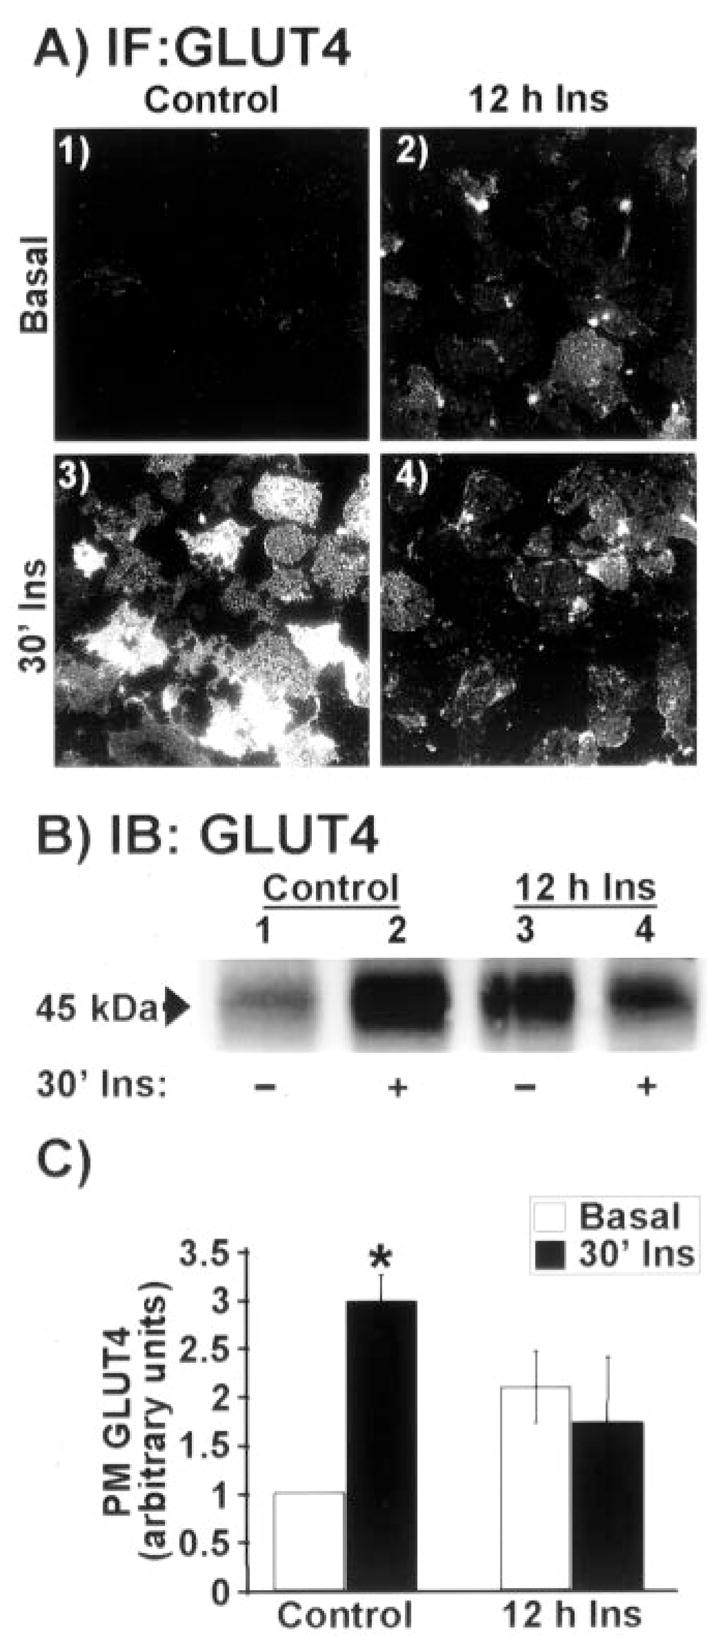
Adipocytes were treated for 12 h in the absence (Control) or presence of 5 nM insulin (12 h Ins). Following this incubation period, cells were washed and stimulated with 100 nM insulin for 30 min (30′ Ins) or left in the basal state (Basal). A, plasma membrane sheets were prepared and subjected to immunofluorescent GLUT4 labeling. All microscopic and camera settings were identical between groups, and representative images from five to eight independent experiments are shown. B, plasma membrane fractions were prepared, resolved on a 10% polyacrylamide gel, and subjected to Western blotting with GLUT4 antibody. C, densitometric quantification (± S.E., *, p < 0.05) of the three independent Western blotting analyses.
Prolonged Insulin Treatment Reduces Cell Surface PIP2 and Actin Levels
There are several possible mechanisms that could account for the decreased insulin-stimulated GLUT4 translocation by hyperinsulinemia. However, consistent with previous work (20, 21), known proximal insulin signal transduction events including IR autophosphorylation, IRS-1 and Cbl tyrosine phosphorylation, and Akt phosphorylation were not significantly different between 3T3-L1 adipocytes maintained in control medium with or without 5 nM insulin (data not shown). Because the proximal insulin signaling cascades appeared to be fully functional, we next examined the effect of insulin on cortical F-actin. Chronic insulin led to a marked reduction in cortical F-actin as assessed with phalloidin staining of fixed whole cells (Fig. 2A, panels 1 and 2). Red fluorescent co-staining of nucleic acids with propidium iodide was employed to verify the presence of cells (Fig. 2A, panels 1–3). Actin staining was verified in cells with latrunculin B (Lat B, an actin monomer binding toxin) treatment (Fig. 2A, panel 3). In addition, F-actin to globular actin (G-actin) ratio determination by Western immunoblot analysis confirmed that cells incubated overnight in 5 nM insulin undergo a marked reduction in F-actin and an increase in G-actin, consistent with an induced depolymerization of cortical F-actin (Fig. 2B). Since recent data link PIP2 to actin cytoskeletal regulation (25), we next tested to see whether this insulin-resistant condition affected PIP2. The level of plasma membrane PIP2 was markedly reduced by 5 nM insulin treatment as assessed by anti-PIP2 immunofluorescent labeling of plasma membrane sheets (Fig. 2C, panels 1 and 2). The immunoreactivity of the anti-PIP2 antibody was confirmed in cells in which PIP2 levels were reduced by LiCl treatment (Fig. 2C, panel 3).
Fig. 2. Cellular cortical F-actin and plasma membrane PIP2 levels are diminished in cells treated with insulin for 12 h.
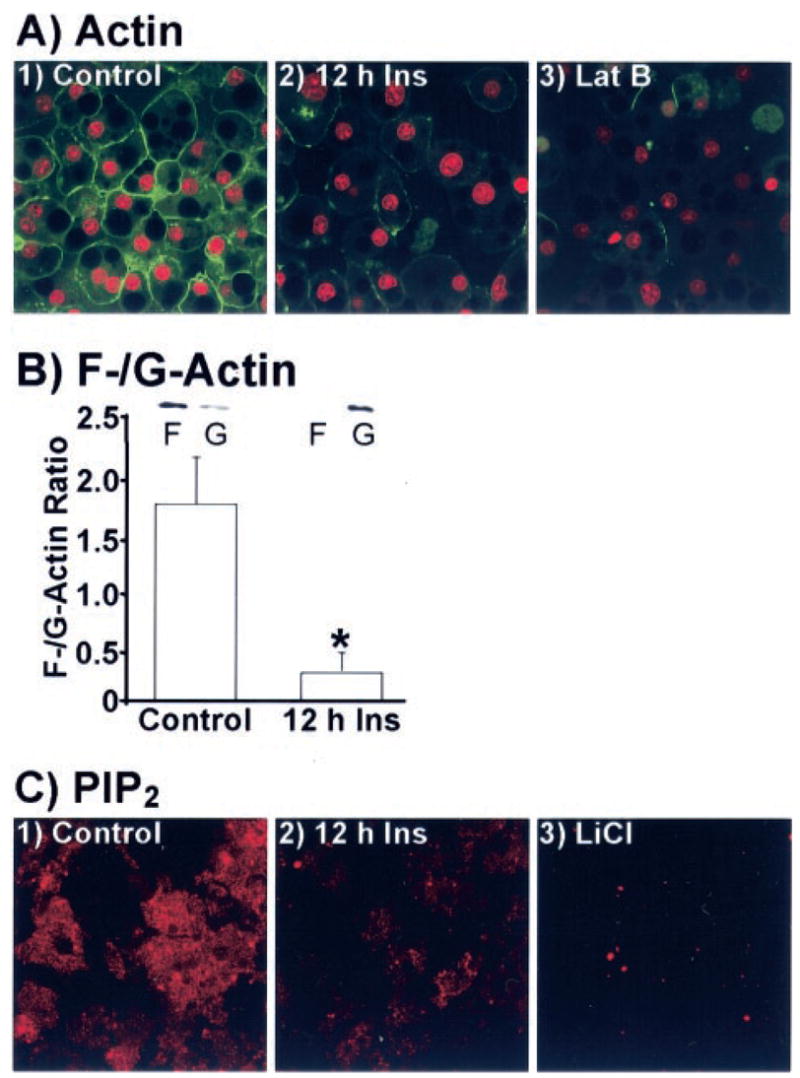
Adipocytes were treated as describe in the legend to Fig. 1. A, nucleic acids and actin in whole cells were co-stained with propidium iodide (red) and phalloidin (green), respectively. A subset of cells co-labeled the same way presented in panel 3 were treated with latrunculin B. Representative images from four independent experiments are shown. B, F-and G-actin fractions were prepared, resolved on a 12% polyacrylamide gel, and subjected to Western blotting with actin antibody. Densitometric quantification (± S.E., *, p < 0.05) derived from three independent experiments are shown. C, membrane sheets were labeled for PIP2. Sheets, derived from cells treated with 10 mM LiCl, are presented in panel 3. Representative images from five independent experiments are shown.
The Loss of PIP2, Actin, and Insulin Sensitivity Is Restored with PIP2 Replenishment
Carrier delivery of PIP2 into insulin-resistant adipocytes led to a dose-dependent replenishment of PIP2 (Fig. 3A, panels 1, 3, 5, 7, and 9) and cortical F-actin (Fig. 3A, panels 2, 4, 6, 8, and 10). Complete restoration of both PIP2 and cortical F-actin was apparent with a PIP2 add-back concentration of 1.25 μM. Thus, we used this concentration to directly test whether the impairment in insulin action occurred as a result of the chronic insulin-induced losses of PIP2 and cortical F-actin. A characteristic increase in insulin-stimulated GLUT4 translocation as assessed by the sheet assay was observed in cells incubated with carrier alone (Fig. 3B, panels 1 and 4). Carrier alone did not change the negative consequence of overnight insulin treatment on acute insulin-stimulated GLUT4 translocation (Fig. 3B, panels 2 and 5). Remarkably, acute insulin-stimulated GLUT4 translocation in adipocytes rendered insulin-resistant was concomitantly restored by 1.25 μM PIP2 replenishment (Fig. 3B, panels 3 and 6). In concert with our findings presented in Fig. 1, we also observed a slight increase in the basal-state plasma membrane level of GLUT4 under hyperinsulinemic conditions (Fig. 3B, compare panels 1 and 2). Interestingly, we consistently observed that this increase in transporter was reduced by PIP2 replenishment (Fig. 3B, compare panels 1–3). Parallel examination of 2-deoxyglucose uptake showed a concomitant loss of insulin-stimulated glucose transport in cells preincubated in the presence of insulin compared with cells that were not (Fig. 3C). In line with previously published work (20, 21, 26), the hyperinsulinemic condition was not associated with a statistically significant increase in basal glucose transport. Consistent with PIP2 correction of insulin action, the reduced insulin-stimulated glucose transport was restored with PIP2 replenishment (Fig. 3C).
FIG. 3. Diminished cortical F-actin and insulin-stimulated GLUT4 translocation in cells treated with chronic insulin are corrected by PIP2 replenishment.
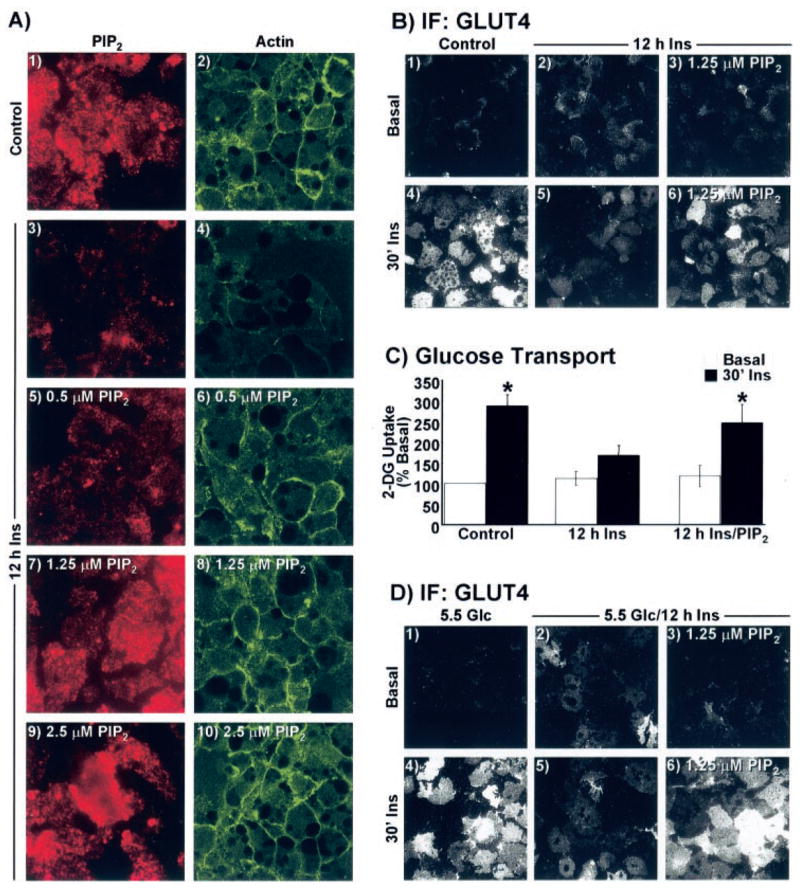
A–C, cells were treated overnight in the absence (Control) or presence of 5 nM insulin for 12 h. A, during the last 60 min of the 12-h period, the medium was replaced with the same medium enriched with either histone H1 (panels 1–4) or indicated concentrations of PIP2/histone H1 (panels 5–10). Plasma membrane sheets (panels 1, 3, 5, 7, and 9) or whole cells (panels 2, 4, 6, 8, and 10) were labeled for PIP2 (red) and actin (green), respectively. B, histone H1 (panels 1, 2, 4, and 5) or 1.25 μM PIP2 (panels 3 and 6) add-back incubations were performed as described for A, sheets were prepared, and GLUT4 immunofluorescence was assessed. C, 2-[3H]Deoxyglucose (2-DG) uptake was determined as described under “Experimental Procedures.” D, cells cultured in 5.5 mM glucose were treated overnight in the absence (5.5 Glc) or presence of 5 nM insulin (5.5 Glc/12 h Ins) for 12 h. Add-back treatment parameters and GLUT4 detection was performed exactly as described for A and B. All microscopic and camera settings were identical between groups and representative images from three independent experiments are shown.
Given that our control medium contained 25 mM glucose and the combination of high glucose with insulin has been suggested to be the cause of the insulin resistant state (20, 21), we also examined the effect of hyperinsulinemia on cells incubated in a low glucose medium (5.5 mM Glc). Insulin acutely increased GLUT4 translocation in cells cultured in low glucose medium (Fig. 3D, panels 1 and 4), and the extent of plasma membrane-associated GLUT4 was qualitatively equivalent with that induced acutely by insulin in cells cultured in high glucose media (Fig. 3B, panels 1 and 4), as reported previously (21). Cells cultured in low glucose in the presence of 5 nM insulin for 12 h displayed an increase in the basal state plasma membrane level of GLUT4 and a marked reduction in the ability of insulin to acutely stimulate GLUT4 translocation (Fig. 3D, panels 2 and 5). The effect of chronic insulin on insulin sensitivity in cells cultured in low glucose was strikingly similar to that in cells cultured in high glucose medium and further analyses also revealed a chronic insulin-induced loss of plasma membrane PIP2 in these cells (data not shown). Accordingly, acute insulin-stimulated GLUT4 translocation in adipocytes cultured in low glucose medium rendered insulin-resistant by chronic insulin was concomitantly restored by 1.25 μM PIP2 replenishment (Fig. 3D, panels 3 and 6). As observed in cells cultured in high glucose, the chronic insulin-induced augmentation of plasma membrane GLUT4 was reduced upon PIP2 add-back (Fig. 3D, panel 3). Taken together, these data suggest that the PIP2-dependent insulin-resistant state was independent of glucose load.
DISCUSSION
We present evidence that plasma membrane phosphoinositide-regulated cortical F-actin structure is perturbed in cells made insulin resistant by hyperinsulinemia. Consistent with previous studies that induce insulin resistance via overnight treatment of cells with a physiological dose of insulin (20, 21), the impaired ability of insulin to acutely regulate the glucose transport process did not correlate with reduced protein levels or activation of several known insulin signaling intermediates. In contrast, the associated loss of PIP2/actin during the insulin-induced state of insulin resistance was particularly striking, and correction of that via PIP2 replenishment restored insulin sensitivity. Thus, these data define a novel diabetic-state alteration and reveal a counteractive tactic to normalize insulin sensitivity.
Evidence indicates that sustained insulin exposure in the presence of high glucose induces insulin resistance via promoting increased glucose flux into the hexosamine biosynthetic pathway with accumulation of UDP-N-acetylglucosamine, which serves as an obligatory precursor for the synthesis of O-linked glycosyl side chains of proteins and lipids (20). Given that chronic insulin treatment was equally effective in diminishing insulin sensitivity in cells incubated in the presence of low or high glucose, our data do not support this possibility. Nonetheless, it remains possible that a sufficient rise in cellular glucose in cells maintained in low glucose could enter the hexosamine biosynthesis pathway and contribute, at least in part, to this PIP2/actin-based defect. This model can be tested by examining the effect of glucosamine on PIP2/actin organization, and we are in the process of doing so.
Previous work has clearly shown that treatment of 3T3-L1 adipocytes to high concentrations of insulin (≥100 nM) leads to disconnect in insulin signaling (17–19, 26). However, early insulin signaling has been documented to remain intact in 3T3-L1 adipocytes made insulin-resistant by lower insulin concentrations between 0.5 and 5.0 nM (20, 21). In agreement, we did not observe any reduction in the content or activity of the IR, IRS-1, Cbl, PI3K, or Akt proteins. What we did find is a marked loss of PIP2/actin, and we think that this may represent an early insulin-induced desensitization of a pertinent aspect of the signaling pathway by which insulin stimulates glucose transport. In support of this insulin-induced PIP2/actin abnormality, an analogous loss of actin-based membrane ruffling has been observed in 3T3-L1 adipocytes treated with insulin (10 nM) for 10 h (26). Certainly, prolonged stimulation of PI3K would diminish the amount of PIP2, and increased PI3K-generated phosphatidylinositol 3,4,5-trisphosphate may result in phospholipase C recruitment to the plasma membrane (27). This, in turn, would be expected to further reduce the cell surface level of PIP2. Additional studies will be necessary to address these possibilities.
The basal-state plasma membrane level of GLUT4 in cells chronically treated with insulin was increased, but the basal uptake was not changed as reported previously under these experimental conditions (20). Therefore, this chronic insulin-induced cell surface-localized pool of GLUT4 protein apparently is not functionally active. Either these transporters are not completely integrated into the plasma membrane and/or a putative insulin signal to activate these transporters may be desensitized by the hyperinsulinemic conditions. Further study will have to examine these possibilities. Of particular interest is that this increased plasma membrane GLUT4 appeared to be lowered by PIP2 add-back. Given that PIP2 replenishment concomitantly restored cortical F-actin levels, it is possible that cortical F-actin may provide a barrier meshwork, as has been reported in chromaffin cells (28, 29). However, a study by Kanzaki et al. (30) suggests that cortical F-actin may not function as a barrier to GLUT4 vesicles in 3T3-L1 adipocytes. In any case, we are exploring methods to better understand this potential barrier role of cortical F-actin in GLUT4 trafficking.
In summary, PIP2-regulated cortical F-actin is targeted by hyperinsulinemia, and remarkably, correction of this disturbance restores insulin responsiveness. Studies currently under way in our laboratory also show that cytoskeletal mechanics in other insulin responsive cells (e.g. L6 myotubes) are negatively targeted by hyperinsulinemia. Our results, together with other published data, favor the hypothesis that hyperinsulinemia leads to membrane and cytoskeletal architecture abnormalities, which adversely affect the glucose transport process.
Acknowledgments
We are grateful to Dr. Ping Liu for technical assistance throughout the work.
Footnotes
This work was supported in part by National Center for Complementary and Alternative Medicine Grant R01-AT001846 (to J. S. E.), American Diabetes Foundation Career Development Award 60779 (to J. S. E.), and by two American Heart Association Midwest Affiliate Predoctoral Fellowships (to G. C. and A. B. S.).
The abbreviations used are: GLUT4, insulin-responsive glucose transporter; PI3K, phosphatidylinositol 3-kinase; F-actin, filamentous actin; G-actin, globular actin; DMEM, Dulbecco’s modified Eagle’s medium; IR, insulin receptor; IRS, insulin receptor substrate; PKC, protein kinase C; PIP2, phosphatidylinositol 4,5-bisphosphate.
References
- 1.DeFronzo RA, Ferrannini E. Diabetes Care. 1991;14:173–194. doi: 10.2337/diacare.14.3.173. [DOI] [PubMed] [Google Scholar]
- 2.Reaven GM. Diabetes. 1988;37:1595–1607. doi: 10.2337/diab.37.12.1595. [DOI] [PubMed] [Google Scholar]
- 3.Del Prato S, Leonetti F, Simonson DC, Sheehan P, Matsuda M, DeFronzo RA. Diabetologia. 1994;37:1025–1035. doi: 10.1007/BF00400466. [DOI] [PubMed] [Google Scholar]
- 4.Rizza RA, Mandarino LJ, Genest J, Baker BA, Gerich JE. Diabetologia. 1985;28:70–75. doi: 10.1007/BF00279918. [DOI] [PubMed] [Google Scholar]
- 5.Garvey WT, Olefsky JM, Marshall S. Diabetes. 1986;35:258–267. doi: 10.2337/diab.35.3.258. [DOI] [PubMed] [Google Scholar]
- 6.Henry RR, Ciaraldi TP, Mudaliar S, Abrams L, Nikoulina SE. Diabetes. 1996;45:400–407. doi: 10.2337/diab.45.4.400. [DOI] [PubMed] [Google Scholar]
- 7.Elmendorf JS. J Membr Biol. 2002;190:167–174. doi: 10.1007/s00232-002-1035-3. [DOI] [PubMed] [Google Scholar]
- 8.Sano H, Kane S, Sano E, Miinea CP, Asara JM, Lane WS, Garner CW, Lienhard GE. J Biol Chem. 2003;278:14599–14602. doi: 10.1074/jbc.C300063200. [DOI] [PubMed] [Google Scholar]
- 9.Chunqiu Hou J, Pessin JE. Mol Biol Cell. 2003;14:3578–3591. doi: 10.1091/mbc.E03-01-0012. [DOI] [PMC free article] [PubMed] [Google Scholar]
- 10.Inoue M, Chang L, Hwang J, Chiang SH, Saltiel AR. Nature. 2003;422:629–633. doi: 10.1038/nature01533. [DOI] [PubMed] [Google Scholar]
- 11.Jiang ZY, Chawla A, Bose A, Way M, Czech MP. J Biol Chem. 2002;277:509–515. doi: 10.1074/jbc.M108280200. [DOI] [PubMed] [Google Scholar]
- 12.Kanzaki M, Watson RT, Hou JC, Stamnes M, Saltiel AR, Pessin JE. Mol Biol Cell. 2002;13:2334–2346. doi: 10.1091/mbc.01-10-0490. [DOI] [PMC free article] [PubMed] [Google Scholar]
- 13.Omata W, Shibata H, Li L, Takata K, Kojima I. Biochem J. 2000;346:321–328. [PMC free article] [PubMed] [Google Scholar]
- 14.Wang Q, Bilan PJ, Tsakiridis T, Hinek A, Klip A. Biochem J. 1998;331:917–928. doi: 10.1042/bj3310917. [DOI] [PMC free article] [PubMed] [Google Scholar]
- 15.Tsakiridis T, Bergman A, Somwar R, Taha C, Aktories K, Cruz TF, Klip A, Downey GP. J Biol Chem. 1998;273:28322–28331. doi: 10.1074/jbc.273.43.28322. [DOI] [PubMed] [Google Scholar]
- 16.Bose A, Cherniack AD, Langille SE, Nicoloro SM, Buxton JM, Park JG, Chawla A, Czech MP. Mol Cell Biol. 2001;21:5262–5275. doi: 10.1128/MCB.21.15.5262-5275.2001. [DOI] [PMC free article] [PubMed] [Google Scholar]
- 17.Flores-Riveros JR, McLenithan JC, Ezaki O, Lane MD. Proc Natl Acad Sci U S A. 1993;90:512–516. doi: 10.1073/pnas.90.2.512. [DOI] [PMC free article] [PubMed] [Google Scholar]
- 18.Ricort JM, Tanti JF, Van Obberghen E, Le Marchand-Brustel Y. Diabetologia. 1995;38:1148–1156. doi: 10.1007/BF00422363. [DOI] [PubMed] [Google Scholar]
- 19.Pryor PR, Liu SC, Clark AE, Yang J, Holman GD, Tosh D. Biochem J. 2000;348:83–91. [PMC free article] [PubMed] [Google Scholar]
- 20.Ross SA, Chen X, Hope HR, Sun S, McMahon EG, Broschat K, Gulve EA. Biochem Biophys Res Commun. 2000;273:1033–1041. doi: 10.1006/bbrc.2000.3082. [DOI] [PubMed] [Google Scholar]
- 21.Nelson BA, Robinson KA, Buse MG. Diabetes. 2000;49:981–991. doi: 10.2337/diabetes.49.6.981. [DOI] [PubMed] [Google Scholar]
- 22.Kralik SF, Liu P, Leffler BJ, Elmendorf JS. Endocrinology. 2002;143:37–46. doi: 10.1210/endo.143.1.8606. [DOI] [PubMed] [Google Scholar]
- 23.Chen G, Liu P, Thurmond DC, Elmendorf JS. FEBS Lett. 2003;534:54–60. doi: 10.1016/s0014-5793(02)03774-2. [DOI] [PubMed] [Google Scholar]
- 24.Garvey WT, Olefsky JM, Matthaei S, Marshall S. J Biol Chem. 1987;262:189–197. [PubMed] [Google Scholar]
- 25.Yin HL, Janmey PA. Annu Rev Physiol. 2003;65:761–789. doi: 10.1146/annurev.physiol.65.092101.142517. [DOI] [PubMed] [Google Scholar]
- 26.Janez A, Worrall DS, Olefsky JM. Endocrinology. 2000;141:4657–4663. doi: 10.1210/endo.141.12.7801. [DOI] [PubMed] [Google Scholar]
- 27.Rebecchi MJ, Pentyala SN. Physiol Rev. 2000;80:1291–1335. doi: 10.1152/physrev.2000.80.4.1291. [DOI] [PubMed] [Google Scholar]
- 28.Aschenbrenner L, Naccache SN, Hasson T. Mol Biol Cell. 2004;15:2253–2263. doi: 10.1091/mbc.E04-01-0002. [DOI] [PMC free article] [PubMed] [Google Scholar]
- 29.Trifaro JM, Lejen T, Rose SD, Pene TD, Barkar ND, Seward EP. Neurochem Res. 2002;27:1371–1385. doi: 10.1023/a:1021627800918. [DOI] [PubMed] [Google Scholar]
- 30.Kanzaki M, Pessin JE. J Biol Chem. 2001;276:42436–42444. doi: 10.1074/jbc.M108297200. [DOI] [PubMed] [Google Scholar]