Abstract
The mammalian anx7 gene codes for a Ca2+-activated GTPase, which supports Ca2+/GTP-dependent secretion events and Ca2+ channel activities in vitro and in vivo. To test whether anx7 might be involved in Ca2+ signaling in secreting pancreatic β cells, we knocked out the anx7 gene in the mouse and tested the insulin-secretory properties of the β cells. The nullizygous anx7 (−/−) phenotype is lethal at embryonic day 10 because of cerebral hemorrhage. However, the heterozygous anx7 (+/−) mouse, although expressing only low levels of ANX7 protein, is viable and fertile. The anx7 (+/−) phenotype is associated with a substantial defect in insulin secretion, although the insulin content of the islets, is 8- to 10-fold higher in the mutants than in the normal littermate control. We infer from electrophysiological studies that both glucose-stimulated secretion and voltage-dependent Ca2+ channel functions are normal. However, electrooptical recordings indicate that the (+/−) mutation has caused a change in the ability of inositol 1,4,5-trisphosphate (IP3)-generating agonists to release intracellular calcium. The principle molecular consequence of lower anx7 expression is a profound reduction in IP3 receptor expression and function in pancreatic islets. The profound increase in islets, β cell number, and size may be a means of compensating for less efficient insulin secretion by individual defective pancreatic β cells. This is a direct demonstration of a connection between glucose-activated insulin secretion and Ca2+ signaling through IP3-sensitive Ca2+ stores.
Annexinopathies are a newly described class of human diseases in which changes in the level of expression of specific annexins have pathological consequences (1). ANX7 (also called annexin VII or synexin), the most evolutionarily conserved member of the annexin gene family, has not hitherto been associated with specific disease (2–4). However, the anx7 gene defines a Ca2+/GTP-dependent membrane fusion and ion channel protein (4), which may be involved in regulating exocytotic secretion in β cells (5, 6), chromaffin cells (3, 4), and other neurendocrine cells. Early work on the annexin VII gene (anx7) has shown that it is expressed in small amounts in nearly every cell and is found throughout phylogeny as a single copy gene in organisms as diverse as humans (7), mice (8, 9), Xenopus (10), and Dictyostelium (11–13). ANX7 is also a Ca2+-conditional GTPase, both in vitro and in vivo (4). The Ca2+-GTPase activity is further activated by protein kinase C and by the tetradecapeptide toxin mastoparan (14). Immunolocalization studies at the ultrastructural level have shown that ANX7 protein is principally localized to secretory vesicles and plasma membrane, as well as to nuclei (15).
These data are therefore consistent with a possible role for this protein in Ca2+ and GTP control of secretion. However, in spite of these interesting properties, it has been difficult to unambiguously establish the true function of ANX7, and much of the in vivo interpretation has therefore necessarily been circumstantial. One obvious solution to this problem has been to use targeted homologous recombination technology to prepare a knockout mouse for the anx7 gene. Here we describe the generation and characterization of such animals. The null (−/−) mouse is indeed lethal, whereas the heterozygous (+/−) mouse displays defects in IP3 receptor expression, Ca2+ signaling, and insulin secretion in cells from pancreatic islets.
Materials and Methods
Construction of anx7 Targeting Vector.
A 129/sv mouse genomic library (Stratagene) was screened with mouse anx7 cDNA as a probe. A 9-kb genomic fragment was used to generate the targeting vector. The vector, pPNT, contained PGKneo and PGKtk cassettes, separated and flanked by a number of unique cloning sites. This vector was digested with XhoI and the 2.0-kb XhoI fragment of anx7 gene (starting from intron 5 and ending at the start of intron 6) was inserted into the XhoI site of pPNT and the 3.1-kb XbaI fragment of anx7 gene (beginning at the start of the intron 7 and ending just downstream of exon 8) was inserted into the XbaI site. This generates the replacement type targeting vector termed KSBX.pPNT, because exon 6 is deleted from the genomic fragment and replaced with a neomycin cassette driven by the phosphoglycerate kinase gene promotor.
Transfection and Selection of Embryonic Stem (ES) Cells.
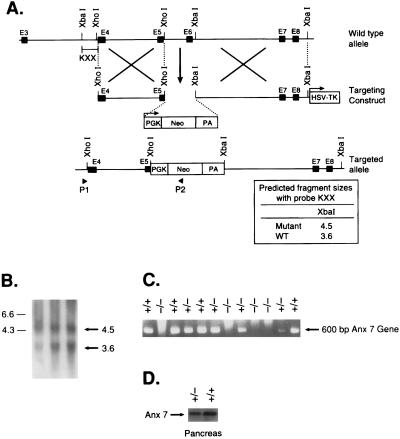
A NotI linearized targeting vector (25 μg) was electroporated into 3 × 10⁶ ES cells. The genetically altered ES cells containing the targeted allele were selected with G418 (GIBCO) at 350 μg/ml and Gancyclovir (Bristol Myers) at 0.2 μM. To screen for homologous recombinant ES clones, we used genomic DNA prepared from cell lysates of the dual resistant clones (selected against neomycin and gancyclovir) as templates for PCR amplifications with an anx7-specific flanking primer and a phosphoglycerate kinase-neo-specific primer (5′-CGGATCGATCCCCTCAGAAGAAC-3′). To verify the results of our PCR screening, DNA from PCR-positive ES clones was digested with XbaI and hybridized with a genomic DNA probe, KXX, which is external to the 5′-flank introduced into the targeting vector. The probe detected the predicted 3.6-kb wild-type and 4.5-kb mutant fragments representing the normal and altered alleles of anx7, respectively. Individual targeted clones were further expanded for microinjection and generation by standard procedures.
Anatomical and Histological Studies.
Thirty F2 hybrids from anx7(+/−) and anx7(+/+) mice were killed, and their pancreas tissue was embedded in paraffin, cut into 5-μm sections, and stained with hematoxylin and eosin. Pancreas tissue was fixed in a mixture of 2% glutaraldehyde and 4% paraformaldehyde and embedded in either Araldite or LR White for electron microscopy. Embryos were taken at different days, fixed, and embedded in paraffin. Except where noted, all studies were performed on male animals.
Isolation of Pancreatic Islets of Langerhans and Insulin Secretion Studies.
Pancreatic islets from anx7(+/+) and anx7(+/−) mice were isolated by collagenase digestion as previously described (16). Static incubation studies were performed in a 24-well plate (Costar). Five islets per well were preincubated at 37°C in 1 ml of Krebs bicarbonate solution equilibrated with 95% O2/5% CO2, enriched with 0.5% BSA and 5.6 mM glucose for 60 min. The solution was then replaced with fresh buffer, and the islets were incubated for 60 min in either 5.6 mM or 22.0 mM glucose at different Ca2+ concentrations (0.75, 1.0, 1.25, 2.0, 2.5, 3.75, and 5.0 mM). The insulin content of the supernatant was measured by RIA by using 125I-rat insulin and guinea pig anti-porcine insulin antibody for detection (17). Data are presented as the fraction of total insulin after subtracting basal values in 5.6 mM glucose from values in 22 mM glucose.
Membrane Potential Measurements.
For measurements of β cell membrane potential, individual islets of Langerhans were microdissected from heterozygotes or normal littermates, pinned into the microchamber, and perfused with modified Krebs solution without BSA (18). Individual cells were impaled with high resistance (≈150 MΩ) microelectrodes. β cells were identified by the characteristic bursting electrical activity observed in 11 mM glucose. Glucose concentrations of 5.6, 11, 16.7, and 22 mM were tested.
Intracellular Calcium Measurements from the β Cell.
Intracellular calcium concentration was measured by using the microfluorimetric technique with Indo-1 as the calcium indicator, as described previously. Mouse islets were isolated by collagenase digestion as described above and dispersed into single cells (19). Calcium concentration was measured from single β cells or small cell clusters. The dye within the cells was excited with 355 nm UV light, and the intensity of the emitted fluorescence was monitored at 410 and 485 nm by using two photomultiplier tubes. The output of each photomultiplier was sampled (1/s) by a computer, and the ratio of fluorescence intensity at 410 nm to fluorescence intensity at 485 nm was calculated. These ratio values were converted to calcium concentrations by using an in vitro calibration curve, as described previously.
Results
Characterization of the Knockout Vector and Production of Chimeric Mice.
Cloning was effected on the anx7 genomic locus from a mouse 129SV/CPJ genomic library. A 9-kb genomic anx7 DNA fragment was used to construct a gene-targeting vector in which anx7 sequences encompassing exon 6 were replaced with the neo gene (16) (Fig. 1A). This vector contained 2.0-kb Xho1 genomic DNA fragment 5′ to exon 6 and 3.1-kb Xba1 fragment 3′ to exon 9. The construct was selected to inactivate the cassette exon in the higher isoform of anx7. The targeting vector was introduced into embryonic stem cells by electroporation, and cell clones, resistant to G418 and ganciclovir, were isolated and propagated. Of 250 resistant clones, 3 were positive for the targeted allele as determined by the presence of a diagnostic 4.5-kb XbaI fragment. The expected structure of the targeting allele was confirmed by restriction enzyme mapping (Fig. 1B). The targeted ES cell clones were microinjected into blastocysts to generate chimeric mice that transmitted the disrupted allele through the germ line. Heterozygous mice grew normally and showed no obvious anatomical or behavioral defects. Heterozygous mice were crossed to generate the anx7(−/−) mice. PCR analysis showed the absence of anx7 transcripts in anx7(−/−) mutants (Fig. 1C). Additionally, we examined the levels of ANX7 protein in pancreatic tissues from anx7(+/+) and anx7(+/−) animals. As shown by Western blot analysis in Fig. 1D, ANX7 levels in pancreas tissue from male anx7(+/−) mice were reduced by 60–70% from levels in wild-type littermate controls. Equivalent results were obtained from samples of cardiac tissue from the same animals (data not shown).
Figure 1.
Gene targeting strategy. (A) Restriction map of the mouse anx7 gene, the targeting vector, and the predicted structure of the locus after recombination. The top line represents the structure and partial restriction map from exon 3 to 9 of the wild-type allele of anx7. Exons are shown as black boxes. The middle line is the targeting plasmid in which a 900-bp XhoI and XbaI fragment is replaced with a 1.8-kb phosphoglycerate kinase (PGK)-neo-PA cassette and linearized at the unique NotI site. The dashed lines show the relationship of the two anx7 fragments in KSBX-pPNT to the genomic locus. The boxes represent the neo and HSV-tk genes, as labeled. The horizontal arrows show the phosphoglycerate kinase-1 promoters and their direction of transcription. The lowest line is the predicted structure of the targeted allele. The line marked KXX represents the 500-bp XhoI–XbaI fragment used for detection of homologous recombinants. The expected sizes of XbaI fragments that will hybridize to this probe is shown at lower right. (B) Southern blot analysis. Genomic DNA was digested with XbaI, blotted, and hybridized with KXX probe. The 3.6-kb fragment is derived from the wild-type allele, and the 4.5-kb fragment seen in lanes 1–3, representing 10–30 μg of genomic DNA from ES cells, is diagnostic of homologous recombination. (C) PCR analysis of genomic DNA from yolk sac of anx7(+/+), anx7(+/−), and anx7(−/−) embryos. The DNA (2 μl) was subjected to PCR analysis by using antisense oligonucleotide from the inserted neo cassette and sense oligonucleotide from genomic sequence outside the 2.0-kb 5′-flanking sequence in the targeting vector. (D) Immunoblot of anx7 extracted from pancreas of anx7(+/−) and control (+/+) mice. Pancreas from anx7(+/−) mice was harvested, frozen on dry ice, and then homogenized in boiling SDS buffer. Aliquots containing identical amounts of protein were separated by SDS/PAGE and transblotted to nitrocellulose, and ANX7 was visualized by Western blot analysis by using rabbit anti-human ANX7 primary antibody.
Lethal Phenotype for Nullizygous anx7(−/−) Mice.
No anx7(−/−) mutants were found of 140 pups screened, implying that anx7-deficient mutants die in utero. Of the viable 120 embryos analyzed, 25% were anx7(−/−) at E10, but by E11 none of them survived. Of 40 embryos analyzed at embryonic day E10, we came across 8 cases of intracranial hemorrhage (into the brain vesicles) with no other developmental abnormalities. The hemorrhages consisted of both mature maternal erythrocytes and fetal nucleated erythroid precursors (data not shown). This finding indicated that the lethal anx7(−/−) condition is initiated at E10 by loss of cardiovascular integrity. Inasmuch as normal fetal and maternal circulations are separately maintained, the data suggest a role for the anx7 gene in embryonic vascular development.
Islet of Langerhans Hyperplasia and β Cell Hypertrophy.
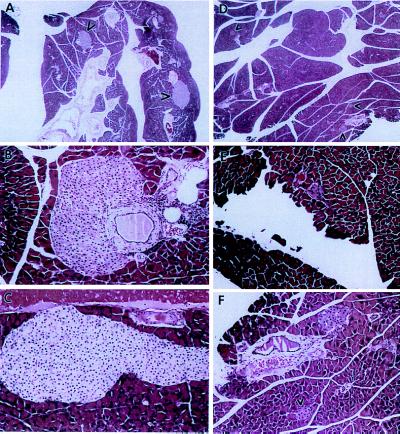
Tissues from anx7(+/−) male and female mice at 100 days of age (≈3 months) were closely scrutinized for pathological changes. The most remarkable changes were noted in male and female pancreas tissue (see Fig. 2, A–E). Low power (×50) views of mutant pancreas (Fig. 2A) show quite large islets of Langerhans, whereas similar low power views of control pancreas (Fig. 2D) show conventionally sized islets (see arrowheads). Higher power (×200) views of giant mutant islets (Fig. 2 B and C) show islets emerging from ductal epithelia. In Fig. 2B, evidence of mild inflammatory invasion of the duct is seen. In high power (×200) views of control islets (see Fig. 2 E and F), the relatively modest size is evident. The data in Fig. 2 are typical of many more images and do not seem to vary according to gender.
Figure 2.
Islet hyperplasia in anx7(+/−) mice. A composite picture comparing hematoxylin- and eosin-stained pancreatic tissue and islet of Langerhans from anx7(+/−) (A–C) and control anx7(+/+) (D–F) mice. (A and D are enlarged ×50.) Arrows show islets. (B, C, E, and F are enlarged ×200.) Data are representatives of five control and mutant animals each. Islet of Langerhans from anx7(+/−)mice are hyperplastic.
To evaluate the age of onset of islet hyperplasia, we compared islet sizes of anx7(+/+) and anx7(+/−) genotype animals from E14 and postpartum animals at 2 days, 6 days, 4 weeks, and 6 weeks after birth. We found that the islets were the same size in both anx7(+/+) and anx7(+/−) genotypes starting at E14 and only started to increase in size at 6 weeks after birth (data not shown).
Ultrastructural Analysis of β Cells in anx7(+/−) Islets.
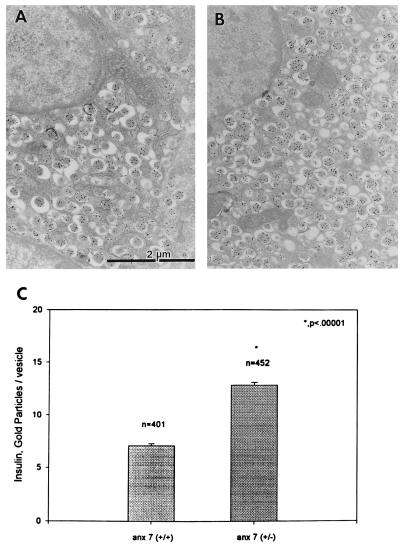
By electron microscopic analysis, the majority of cells in the hyperplastic mutant islets are typical β cells with classical insulin granules. These conclusions were confirmed by immunogold analysis of insulin localization in control (Fig. 3A) and mutant islets (Fig. 3B). Quantitatively, the insulin-containing secretory vesicles in mutant β cells contained ≈2-fold more insulin than vesicles in β cells from normal littermate controls (Fig. 3C). These structural observations were validated by chemical determinations of insulin content of isolated islets. On a per islet basis, levels of total insulin in anx7(+/−) islets were 8- to 10-fold greater (1600–2000 ng insulin/islet) than normal littermate controls (200 ng insulin/islet) (data not shown). Each data point was derived from between 24 and 35 pools of 3–5 islets, each from 4–6 mice. In addition, average diameters of the anx7(+/−) β cells were ≈75% greater than the diameters of the (+/+) control β cells (data not shown). For example, in random cross-sections of islet tissue containing multiple β cell nuclei, the average area per nuclei was 144 μm2 for (+/−) mutant, compared with 83 μm2 for (+/+) normal littermate controls. Sections containing up to ≈60 total nuclei were evaluated and found to be in this range. Thus, the increment in insulin content/islet is caused by several compounding factors, including islet size, β cell size, and vesicular insulin content.
Figure 3.
Electron microscopy–immunogold labeling of insulin in control (A) and mutant (B) β cells. Pancreas tissues taken from mice were processed for electron microscopy and labeled with antibodies to insulin as described in Materials and Methods (C) Statistical analysis of A and B.
Influence of the anx7(+/−) Mutation on Ca2+-Activated Insulin Secretion.
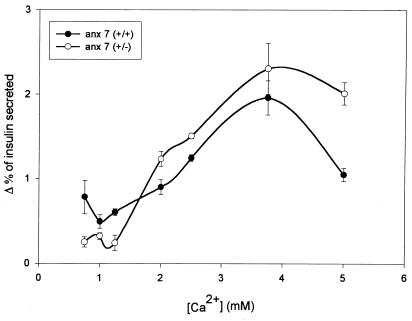
Islet hyperplasia and β cell hypertrophy have often been seen as compensations for disorders of insulin secretion or action. Insulin tolerance tests of anx7(+/−) mice revealed only modest differences (data not shown), and for that reason we turned our attention to Ca2+-dependent insulin secretion from isolated mutant islets of Langerhans. As shown in Fig. 4, the normal littermate control islets behave in the classical biphasic manner. A substantial rate of secretion of ≈0.75%/h is observed at physiological Ca2+ levels ≈1–1.4 mM free Ca2+ (20), rising to a peak of ≈2.5%/h between 3 and 4 mM Ca2+, and declining precipitously by 5 mM Ca2+. By contrast, the anx7(+/−) mutants secrete at a rate of ≈0.25%/h at physiological Ca2+ concentrations. This represents a reduction in insulin secretion rate of ≈67%. Furthermore, the expected reduction in insulin secretion at 5 mM Ca2+ is significantly attenuated. Thus, in addition to the loss of secretory potency under physiological calcium concentrations, we noted a shift to higher values of the entire shape of the secretory dependency curve, with a true crossover in the neighborhood of 2.5 mM Ca2+.
Figure 4.
Calcium-dependent secretion of insulin from control and mutant β cells. Hextuplicate sets of five collagenase-dissociated islets were distributed into reaction vessels and challenged with different Ca2+ concentrations as shown. Data are presented as the fraction of total insulin after subtracting basal values from values in 22 mM glucose. Baseline levels of secretion changed very little across the Ca2+ titration range. Time point is 60 min.
Glucose-dependent Electrophysiological Properties of anx7(+/−) β Cells in Intact Islets of Langerhans.
A critical question at this juncture is whether the defect in Ca2+-dependent insulin secretion in anx7(+/−) β cells might be due to coincident defects in metabolic or other ionic control mechanisms. To test this hypothesis directly, we examined the changes in β cell electrical activity induced by glucose. No profound qualitative differences are noted between responses to glucose from mutant and control β cells (data not shown). To interpret these results, we recall that the glucose-dependent bursting pattern depends on metabolism of glucose to raise ATP levels, thereby shutting down the KATP channel and depolarizing the cell. The resulting depolarization activates voltage-gated Ca2+ and K+ channels, producing action potentials and allowing Ca2+ entry. We can therefore conclude that glucose metabolism, KATP channels, and voltage-gated channels are functionally intact in the anx7(+/−) mouse β cell. Although the sequential processes that give rise to cycles of depolarization and hyperpolarization are not known, these results demonstrate that these processes are also functioning normally in the anx7(+/−) β cell.
Attenuated Cytosolic Ca2+ Transients in anx7(+/−) β Cells.
Because voltage-dependent cation channels in the plasma membrane thus appear to be functioning normally in the mutant β cells, we turned our attention to the function of intracellular Ca2+ stores. As shown in Fig. 5A, control β cells respond to 100 μM carbachol with a prompt and classical biphasic elevation of [Ca2+]i from ≈130 nM to ≈220 nM. This is because of release of calcium from IP3-sensitive stores in the endoplasmic reticulum (ER). This is followed by a drop in [Ca2+]i to ≈170 nM. In the absence of further interventions, the [Ca2+]i would have stabilized in this region, presumably sustained by Ca2+ entry through store-operated calcium channels. However, on addition of 100 μM loperamide (21), an activator of open but inactivated store-operated calcium channels, the [Ca2+]i rises and is sustained at the near maximal levels observed transiently after addition of carbachol. These data are representative of cells from 12 different normal littermate control animals studied at different times during a 12-month period. Thus, the anx7(+/+) β cells behave exactly as predicted for a normally reactive system.
Figure 5.
(A and B) Influence of carbachol (Cch) and loperamide (Lop) on cytosolic calcium transients in control and mutant β cells. β cells from wild-type control mice (A) and mutant anx7(+/−) mice (B) were cultured from collagenase-treated islet tissue. After 3 days in culture, cells were loaded with indo-1, and intracellular Ca2+ concentrations were measured. Carbachol and loperamide were applied as indicated. The glucose concentration used was 5.6 mM. (C and D) influence of thapsigargin on calcium transients in control and mutant β cells. β cells were isolated from wild-type and mutant pancreatic tissue, as described in A and in refs. 22 and 23. Thapsigargin (Thapsi), carbachol, and loperamide were applied as shown. K.O., knockout.
By contrast, as shown in Fig. 5B, the anx7(+/−) β cells respond quite differently. Whereas resting [Ca2+]i levels are found to be normal, the response to carbachol is substantially attenuated. The first phase response changes from a resting Ca2+ level of ≈110 nM to only ≈140 nM. Furthermore, even this attenuated carbachol response appears to be slightly delayed. In the example shown, some evidence of an even later attenuated response by a gap-junction–coupled adjacent β cell is noted in the trace just before the addition of loperamide. Many β cells occur as clusters, and such multiple signals occasionally occur in our hands. Finally, loperamide, an activator of store-operated Ca2+ channels (21), is added, and virtually no response is noted. This experiment was repeated on 10 β cells from different male and female anx7(+/−) animals, with essentially identical results in terms of suppressed responses.
An alternative approach to evaluating the state of Ca2+ stores in β cells is to block the uptake of Ca2+ by the ER with the specific ATPase inhibitor thapsigargin, and to measure the rate and extent of the ensuing “leak” of Ca2+ into the cytosol. As shown in Fig. 5C for wild-type anx7(+/+) β cells, thapsigargin promotes a prompt elevation of cytosolic [Ca2+]. A subsequent pulse of loperamide had no further effect, consistent with the concept that merely draining the general Ca2+ stores is not sufficient to activate the specific store-operated calcium channels. By contrast, as shown in Fig. 5D, thapsigargin treatment of anx7(+/−) β cells provokes a much slower “leak” of Ca2+ from the ER into the cytosol. When added on top of this thapsigargin treatment, carbachol seems to have only a slight effect, if any, and the addition of loperamide is similarly ineffective. These data thus appear to suggest that the general Ca2+ store in the ER of anx7(+/−) β cells is itself compromised.
Immunogold Labeling of IP3 Receptors in Pancreatic Islets of Langerhans.
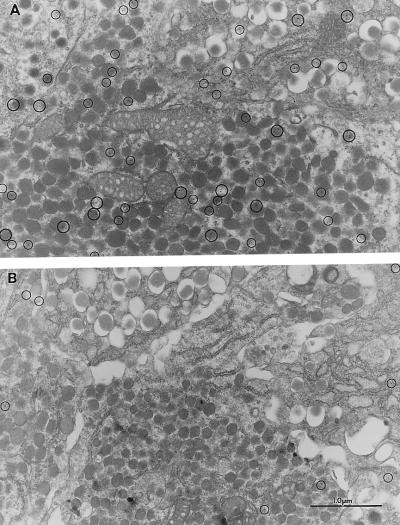
To test the hypothesis that deficits in IP3 receptor expression might underlie the defects in IP3-dependent Ca2+ signaling, we used an electron microscopy–immunogold method to detect and quantitate IP3 receptors. As shown in Fig. 6, IP3 receptors are distributed in islets not only in the ER but also in association with secretory granule membranes. Such a distribution has been widely reported by other investigators and so is not surprising (22–24). Furthermore, the IP3 receptor distribution is characteristic of not only β cells but also α cells and δ cells in islets. In anx7(+/−) mutant islets, the IP3 receptors are similarly distributed. However, they are ≈10-fold reduced in the mutant islets. The average density in control islets is 2.15 ± 0.58 (n = 4, SEM) particles/μm2, whereas the average density in mutant islets is 0.21 ± .02 (n = 4, SEM) particles/μm2. Thus, the principle molecular consequence of lower ANX7 expression is a profound decrease in IP3 receptor expression.
Figure 6.
Electron microscopy–Immunogold labeling of IP3 receptor in control (Upper) and mutant (Lower) β cells. Pancreas tissues taken from mice were processed for electron microscopy and labeled with antibodies to IP3 receptor. The anti-IP3 receptor antibody (Calbiochem) is active against isoforms I, II, and III.
Discussion
In retrospect, it is not surprising that the phenotype of the homozygous (−/−) knockout for the anx7 gene in the mouse should turn out to be lethal. The gene is found throughout phylogeny, at least as far back as Dictyostelium. Furthermore, many ANX7 properties, including calcium channel activity, Ca2+-activated secretion events, and Ca2+-conditional GTPase activity, have pointed to potentially important functions in Ca2+ signal transduction. One prominent, long-term speculation has been possible involvement of the protein in Ca2+-dependent exocytotic secretion events. However, until the present knockout experiments were performed, it has been virtually impossible to raise or lower ANX7 levels in cells, and thereby to specifically test this hypothesis (25). The present data show that in pancreatic β cells from heterozygous (+/−) anx7 mice, lowering the level of ANX7 expression has the consequence of causing defects in Ca2+ signal transduction and in insulin secretion. Furthermore, the mechanism of the defect is reduced expression of IP3 receptors. It has long been known that activation of IP3 receptors causes calcium release from intracellular stores in the pancreatic β cell (26, 27). Although IP3 receptor-mediated calcium release is clearly involved in muscarinic potentiation of insulin secretion, the role of these receptors in glucose-induced secretion remains controversial. Thus, glucose has been shown to stimulate IP3 production in the β cell (28), but some metabolites of glucose have been shown to antagonize activation of the receptor by IP3 (29). Our results thus provide a direct demonstration that Ca2+ signaling through IP3 receptors is indeed essential for glucose-activated insulin secretion. However, the exact relationship between IP3 receptor function and insulin secretion remains to be fully understood.
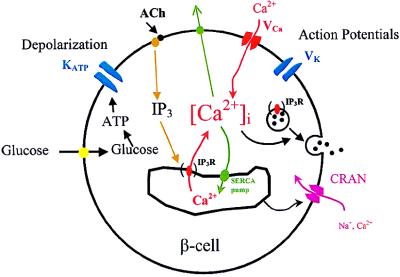
Fig. 7 shows a model of stimulus–secretion coupling in the pancreatic β cell and the effects of the anx7(+/−) mutation. Glucose metabolism leads to ATP production and closure of the KATP channel. The resulting depolarization activates voltage-gated Ca2+ and K+ channels, causing action potential firing and Ca2+ entry. These processes appear to be operating normally in the ANX(+/−) mutant mice. However, reduction in the expression of IP3 receptors on the ER membrane leads to defective IP3 and thapsigargin-induced Ca2+ release from the ER. Preliminary data indicate that activation of store-operated channels in β cells is also defective in the (+/−) mouse. One possibility is that this defect originates from the defect in Ca2+ release from the store itself. However, it has recently been suggested that IP3 receptors themselves may act as store-operated channels in some instances (30). If this is the case in the β cell, then defects in store-operated calcium entry in the (+/−) mutant may be directly related to underexpression of IP3 receptors, as observed in this study.
Figure 7.
Stimulus-secretion coupling in the pancreatic β cell. Glucose metabolism leads to membrane depolarization and Ca2+ influx. The Ca2+ that enters the cell through voltage-gated Ca2+ channels, along with Ca2+ released from the ER, stimulates insulin secretion. Defective processes in the anx7(+/−) mutant are shown in parentheses. IP3 R, IP3 receptor; ACh, acetylcholine; SERCA, smooth endoplasmic reticulum calcium.
Our interpretation of these histological and biochemical phenomena is that the mutant mouse may be compensating for individual defective β cells by making more secreting cells and loading each secretory granule with more insulin. The mechanisms by which compensatory changes occur are obviously fascinating subjects for future study, promising insights to basic control processes hitherto yet unknown. Islet hyperplasia and β cell hypertrophy are known to occur physiologically, as in pregnancy or pathophysiologically, as in non-insulin-dependent diabetes mellitus, or on the basis of mutation as in persistent hyperinsulinemia of infancy or Beckwith–Weidemann syndrome in humans (31). However, none of these mechanisms appears at present to be related to the genesis of the anx7(+/−) phenotype. The novel mechanism described here by which the anx7 gene controls the secretory process in β cells points to the existence of hitherto unknown cellular and molecular tools for control of Ca2+ signaling and insulin secretion.
Acknowledgments
We thank Drs. Ofer Eidelman, Linda Fossom, MerryLee Poth, Allan Daniel, Mark Levine, Charles Zimliki, Jr., Alison Cotterell, and Eric Lee for helpful discussions and other support. Technical support from Ms. Ling Li is gratefully acknowledged. Support for this work is acknowledged from the Cystic Fibrosis Foundation and the Juvenile Diabetes Foundation International.
Abbreviations
- IP3
inositol 1,4,5-trisphosphate
- E
embryonic day
- ER
endoplasmic reticulum
- ES cells
embryonic stem cells
References
- 1.Rand J H. N Engl J Med. 1999;340:1035–1036. doi: 10.1056/NEJM199904013401310. [DOI] [PubMed] [Google Scholar]
- 2.Creutz C E, Pazoles C J, Pollard H B. J Biol Chem. 1978;253:2858–2866. [PubMed] [Google Scholar]
- 3.Raynal P, Pollard H B. Biochim Biophys Acta Biomembranes. 1994;1197:63–93. doi: 10.1016/0304-4157(94)90019-1. [DOI] [PubMed] [Google Scholar]
- 4.Caohuy H, Srivastava M, Pollard H B. Proc Natl Acad SciUSA. 1996;93:10797–10802. doi: 10.1073/pnas.93.20.10797. [DOI] [PMC free article] [PubMed] [Google Scholar]
- 5.Sussman K E, Pollard H B, Leitner J W, Nesher R, Adler J, Cerasi E. Trans Assoc Am Physicians. 1982;95:299–309. [PubMed] [Google Scholar]
- 6.Sussman K E, Pollard H B, Leitner J W, Nesher R, Adler J, Cerasi E. Biochem J. 1983;214:225–230. doi: 10.1042/bj2140225. [DOI] [PMC free article] [PubMed] [Google Scholar]
- 7.Shirvan A, Srivastava M, Wang M A, Cultraro C, Magendzo K, McBride O W, Pollard H B, Burns A L. Biochemistry. 1994;33:6888–6901. doi: 10.1021/bi00188a019. [DOI] [PubMed] [Google Scholar]
- 8.Zhang-Keck Z-Y, Burns A L, Pollard H B. Biochem J. 1993;289:735–741. doi: 10.1042/bj2890735. [DOI] [PMC free article] [PubMed] [Google Scholar]
- 9.Zhang-Keck Z-Y, Srivastava M, Kozak C A, Caohuy H, Shirvan A, Burns A L, Pollard H B. Biochem J. 1994;301:835–845. doi: 10.1042/bj3010835. [DOI] [PMC free article] [PubMed] [Google Scholar]
- 10.Srivastava M, Zhang-Keck Z-Y, Caohuy H, McPhie P, Pollard H B. Biochem J. 1996;316:729–736. doi: 10.1042/bj3160729. [DOI] [PMC free article] [PubMed] [Google Scholar]
- 11.Greenwood M, Tsang A. Biochim Biophys Acta. 1991;1088:429–432. doi: 10.1016/0167-4781(91)90137-b. [DOI] [PubMed] [Google Scholar]
- 12.Doring V, Schleicher M, Noegel A A. J Biol Chem. 1991;266:17509–17515. [PubMed] [Google Scholar]
- 13.Gierke V. J Biol Chem. 1991;226:1697–1700. [PubMed] [Google Scholar]
- 14.Caohuy H, Srivastava M, Pollard H B. In: Secretory Systems and Toxins. Lazarovici P, editor. Vol. 2. New York: Harwood; 1998. pp. 439–449. [Google Scholar]
- 15.Kuijpers G A J, Lee G, Pollard H B. Cell Tissue Res. 1992;269:323–330. doi: 10.1007/BF00319624. [DOI] [PubMed] [Google Scholar]
- 16.Boschero A C, Malaisse W J. Am J Physiol (Endocrinol Metab Gastrointest Physiol 5) 1979;236:E139–E146. [Google Scholar]
- 17.Scott A M, Atwater I, Rojas E. Diabetalogia. 1981;21:470–475. doi: 10.1007/BF00257788. [DOI] [PubMed] [Google Scholar]
- 18.Atwater I, Ribalet B, Rojas E. J Physiol. 1978;278:117–139. doi: 10.1113/jphysiol.1978.sp012296. [DOI] [PMC free article] [PubMed] [Google Scholar]
- 19.Rojas E, Carroll P B, Ricordi C, Boschero A C, Stojilvic S S, Atwater I. Endocrinology. 1994;134:1771–1781. doi: 10.1210/endo.134.4.8137742. [DOI] [PubMed] [Google Scholar]
- 20.Wilson J D, Foster D W, Kronenberg H M, Larsen P R, editors. Williams Textbook of Endocrinology. 9th Ed. Philadelphia: Saunders; 1998. , inner cover reference values. [Google Scholar]
- 21.Harper J L, Shin Y, Daly J W. Proc Natl Acad Sci USA. 1997;94:14912–14917. doi: 10.1073/pnas.94.26.14912. [DOI] [PMC free article] [PubMed] [Google Scholar]
- 22.Ravazzola M, Haltan P A, Orci L. Proc Natl Acad Sci USA. 1996;93:2745–2748. doi: 10.1073/pnas.93.7.2745. [DOI] [PMC free article] [PubMed] [Google Scholar]
- 23.Blondel O, Bell G I, Moody M, Miller R J, Gibbons S J. J Biol Chem. 1999;269:27167–27170. [PubMed] [Google Scholar]
- 24.Blondel O, Moody M, Depaoli A M, Sharp A H, Ross C A, Swift H, Bell G I. Proc Natl Acad Sci USA. 1994;91:7777–7781. doi: 10.1073/pnas.91.16.7777. [DOI] [PMC free article] [PubMed] [Google Scholar]
- 25.Raynal P, Pollard H B, Srivastava M. Biochem J. 1997;322:365–371. doi: 10.1042/bj3220365. [DOI] [PMC free article] [PubMed] [Google Scholar]
- 26.Wollheim C B, Biden T J, Lew P D, Schlegel W. J Cardiovasc Pharmacol. 1986;8:S65–S70. doi: 10.1097/00005344-198600088-00014. [DOI] [PubMed] [Google Scholar]
- 27.Wolf B A, Comens P G, Ackermann K E, Sherman W R, McDaniel M L. Biochem J. 1985;227:965–969. doi: 10.1042/bj2270965. [DOI] [PMC free article] [PubMed] [Google Scholar]
- 28.Zawalich W S, Zawalich K C. Diabetes. 1988;37:1294–1300. doi: 10.2337/diab.37.9.1294. [DOI] [PubMed] [Google Scholar]
- 29.Wolf B A, Colca J R, Comens P G, Turk J, McDaniel M L. J Biol Chem. 1986;261:16284–16287. [PubMed] [Google Scholar]
- 30.Putney J W. Cell Calcium. 1997;21:257–261. doi: 10.1016/s0143-4160(97)90050-6. [DOI] [PubMed] [Google Scholar]
- 31.Thomas P M, Cote G J, Wohlik N. Science. 1995;268:426–429. doi: 10.1126/science.7716548. [DOI] [PubMed] [Google Scholar]


