

Abstract
Cavβ subunits support voltage gating of Cav1.2 calcium channels and play important role in excitation-contraction coupling. The common central membrane-associated guanylate kinase (MAGUK) region of Cavβ binds to the α-interaction domain (AID) and the IQ motif of the pore-forming α1C subunit, but these two interactions do not explain why the cardiac Cavβ2 subunit splice variants differentially modulate inactivation of Ca2+ currents (ICa). Previously we described β2Δg, a functionally active splice variant of human Cavβ2 lacking MAGUK. By deletion analysis of β2Δg, we have now identified a 41-amino acid C-terminal essential determinant (β2CED) that stimulates ICa in the absence of Cavβ subunits and conveys a +20-mV shift in the peak of the ICa-voltage relationship. The β2CED is targeted by α1C to the plasma membrane, forms a complex with α1C but does not bind to AID. Electrophysiology and binding studies point to the calmodulin-interacting LA/IQ region in the α1C subunit C terminus as a functionally relevant β2CED binding site. The β2CED interacts with LA/IQ in a Ca2+- and calmodulin-independent manner and need LA, but not IQ, to activate the channel. Deletion/mutation analyses indicated that each of the three Cavβ2/α1C interactions is sufficient to support ICa. However, β2CED does not support Ca2+-dependent inactivation, suggesting that interactions of MAGUK with AID and IQ are crucial for Ca2+-induced inactivation. The β2CED is conserved only in Cavβ2 subunits. Thus, β2CED constitutes a previously unknown integrative part of the multifactorial mechanism of Cavβ2-subunit differential modulation of the Cav1.2 calcium channel that in β2Δg occurs without MAGUK.
Voltage-gated Cav1.2 calcium channels couple membrane depolarization to excitation in a wide variety of cells. The voltage gating, or membrane potential-dependent opening and closing of a channel, is associated with conformational changes in the pore-forming (α1) subunit (1). Cav1.2 channels require auxiliary α2δ and β (Cavβ) subunits to integrate the functional channel into the plasma membrane (PM)3 and facilitate voltage gating of the current (2). How Cavβ subunits mediate these functions and what are the Cavβ-specific determinants are important questions to be answered. Members of the Cavβ family are structurally divergent. Four different Cavβ subunit genes code for β1–β4 subunit variants, some of which are alternatively spliced. Cytosolic Cavβ subunits bind to the 18-amino acid α1-interaction domain (AID) of the cytoplasmic linker between internal repeats I and II of the pore-forming α1 subunit (Fig. 1), stimulate the Ca2+ channel current (ICa), and shift the current-voltage (I-V) curve to more negative voltages (3, 4). The AID is conserved between the Cav1 and Cav2 subfamilies of Ca + channels. It is located in close proximity to the transmembrane segment IS6 that is a part of the pore domain (5) implicated in voltage-dependent inactivation of the channel (6, 7). A common central region of Cavβ subunits has structural similarity with the membrane-associated guanylate kinase (MAGUK) motif (8). When co-expressed with the α1C subunit, the Cavβ MAGUK domain increased Ba2+ current (IBa) amplitude and shifted the steady-state activation (9). Confirming tight binding of the central Cavβ domain to the α1C subunit, diffraction studies revealed structural patterns that were implicated in interaction with the AID (10–12). However, variant-specific regulatory properties of Cavβ appear to be AID-independent. Although different Cavβ subunits have MAGUK, they modulate Ca2+ channels with individual characteristic variations. For example, the primary cardiac β2a subunit did not fully substitute the β1a subunit in skeletal muscle EC coupling although it restored activation of ICa and gating of Ca2+ transients (13). Unlike other Cavβ subunits, β2a endows the distinct cardiac phenotype by not supporting facilitation of the Ca2+ channel current by a depolarizing prepulse (14). This general picture was further detailed by FRET microscopy combined with patch clamp that demonstrated differential voltage-dependent rearrangement of Cavβ subunits vis à vis the α1C subunit N terminus (15). Unlike the Cavβ1a subunit, Cavβ2 exhibited no such mobility. These and other findings show that a number of Cavβ functions do not rely on AID as a main site of regulation and may involve other determinants (16, 17). Thus, identification of functional motifs that are unique for different Cavβ subunits may give an important insight into the functional specificity of the Cavβ-dependent modulation. One feasible approach is to explore the naturally occurring Cavβ splice variants (18). In line with this was the discovery of two new functionally active small splice variants of the human cardiac β2 subunit lacking the central domain (19). These β2f and β2Δg subunits share a 153-amino acid distal C-terminal region common to all known “large” Cavβ2 subunits (β2a–β2e) (20) suggesting that this region may have a role of an essential Cavβ2 determinant. Our attention to this region of the β2 subunit was stimulated by the finding that β2Δg supports ICa on co-expression with α1C and α2δ in Cavβ-free COS1 cells. Because large and small Cavβ2 splice variants convey sharply different inactivation kinetics, it seems apparent that, in addition to MAGUK, there is a C-terminal determinant (defined here as β2CED) that is common only to Cavβ2 subunits and thus may contribute to the Cavβ2-specific tuning of the channel modulation by large Cavβ2 subunits. In the case of the small Cavβ2 subunits, β2CED may play the key regulatory role. This intriguing possibility prompted us to locate β2CED and characterize the properties of β2CED-modulated Ca2+ channels that rely on β2CED-dependent, MAGUK-independent modulation.
FIGURE 1.

Transmembrane topology of the α1C subunit showing AID, LA, and IQ motifs and their amino acid sequences in the human α1C protein (below).
EXPERIMENTAL PROCEDURES
Molecular Biology, β2Δg Deletion Mutants—Cloning of β2g (AY675092), subcloning into the pcDNA3 vector, and the 5′-terminal fusion of ECFP have been described previously (19). To create ECFP-labeled β2Δg deletion mutants, the general strategy was to generate the deletion mutants by PCR and then replace the β2Δg open reading frame in 5′-ECFP-β2Δg-pcDNA3 with a deletion mutant at the 5′-XhoI/ApaI-3′ sites. The PCR were performed with β2Δg as template using the following primer pairs with 5′-XhoI linker (sense) and 3′-ApaI-TGA linker (antisense): 5′-cccgctcgagATGTATCTCTGGAGGAGGACC-3′ (sense) and 5′-gcgggcccTCAGTGGTCATGGGAATAATC-3′ (antisense) for β2Δg(1–82); 5′-gcctcgagGTGGACCACTATGCCTCAC-3′ (sense) and 5′-gggcgggcccTCAGTTGTGGTCCTGCTCTCGATC-3′ (antisense) for β2Δg(83–123); 5′-cggcggccgccaccATGGAGTGCAACAAGCAGCGCAGCCGTC-3′ (sense) and 5′-gggcgggcccTCATTGGCGGATGTAAACATG-3′ (antisense) for β2Δg(124–164). To create the deletion mutant 5′-ECFP-β2Δg(83–164)-pcDNA3, 5′-ECFP-β2Δg-pcDNA3 was cut by XhoI, filled-in to a blunt end, cleaved by PmlI, and then the 6.2-kb fragment was self-ligated. To generate the unlabeled β2Δg(124–165), a PCR product was amplified using the NotI linker/Kozak primer (sense) 5′-cggcggccgccaccATGGAGTGCAACAAGCAGCGCAGCCGTC-3′ and the ApaI primer/linker (antisense) 5′-gggcgggcccTCATTGGCGGATGTAAACATG-3′. The β2Δg(124–165) PCR product was subcloned into 5′-ECFP-β2Δg-pcDNA3 or β2Δg-pcDNA3 plasmid at the NotI/ApaI sites (replacing the β2Δg cassette). To create the mVenus-labeled deletion mutants, the 5′-BsrGI/ApaI-3′ inserts of the ECFP-labeled deletion mutants were subcloned into the mVenus-C1 vector (kindly provided by Dr. S. S. Vogel) cleaved at the same sites.
5′-ECFP-β2d-pcDNA3 was prepared by ligation of the 5′-PshAI/BsmBI-3′ fragment of β2b into the respective sites of plasmid 5′-ECFP-β2f-pcDNA3. The 5′-ECFP-β2dΔCED deletion construct in pcDNA3 was produced by substitution of 5′-ECFP-β2d-pcDNA3 at the BsmBI-AvrII sites with the respective fragment of β2Δg(83–123)-pcDNA3. The β2b cDNA was amplified by reverse transcriptase-PCR from human heart mRNA with the sense 5′-ATGCTTGACAGACGCCTTATAG-3′ and antisense 5′-GCTGTTAGTTATACAAGACTTC-3′ primers as described earlier (19).
FLAGN-β2d and FLAGN-β2dΔCED in pcDNA3 were produced by ligating the 5′-BsrGI (filled in with Klenow)/AvrII-3′ fragments of pECFPN-β2d and pECFPN-β2dΔCED, respectively, into a FLAG-2AB-pcDNA3 vector (gift of Dr. Kuanghueih Chen) at the EcoRV and AvrII sites. To prepare mVenusN-β2d and mVenusN-β2dΔCED in pcDNA3, the 5′-BsrGI/AvrII (filled in with Klenow)-3′ fragments of 5′-ECFP-β2d-pcDNA3 and 5′-ECFP-β2dΔCED-pcDNA3, respectively, were ligated into the mVenus-C1 vector at the BsrGI and EcoRI (filled in with Klenow) sites.
mVenusN-I-IIAID was constructed by PCR amplification of the 418–455 fragment of the α1C,77 I-II linker (nucleotides 1252–1365 of the pHLCC77 (z34815) open reading frame) in pcDNA3 followed by subcloning into the 5′-BspEI/EcoRI-3′ sites of the mVenus-C1 vector. The sense and antisense primers used were 5′-catatatccggaCGGGGAGATTTCCAGAAG-3′ and 5′-cggcatgaattctaGCCTTCGTCCTCATTC-3′, respectively. mVenusN-I-IIAIDM was created in the same way except that α1C,77AIDM was used as the template for PCR. BiotinN-I-IIAID in pcDNA6 was prepared with a Zero Blunt TOPO PCR cloning kit (Invitrogen) and a pcDNA™ 6 BioEase Gateway Biotinylation System (Invitrogen) according to the manufacturer's instructions using α1C77-pcDNA3 as template, 5′-caccATGCGGGAGATTTCCAG-3′ and 5′-ctaGCCTTCGTCCTCATTCTC-3′ as sense and antisense primers, respectively.
To prepare FLAGN-LA/IQ (amino acids 1571–1636 of α1C77) in pcDNA3 vector, PCR was performed with α1C77-pcDNA3 as template, 5′-gtattaaagcttAGGATCAAAACAGAAGGGAACCTAG-3′ and 5′-ctatatgggcccctaCTCTTTGCGCTTCTTGAACTTCC-3′ as sense and antisense primers, respectively; the PCR product was then subcloned into a FLAG-2AB-pcDNA3 vector at the HindIII/ApaI sites. FLAGN-α1C,77-pcDNA3 was created by replacement of the 5′-NdeI/HindIII-3′ fragment of α1C77-pcDNA3 with the respective fragment from FLAG-2AB-pcDNA3.
The AID mutant α1C,77AIDM (D433A,G436A,Y437A,W440A) was generated by a “two-step” PCR site-directed mutagenesis. Briefly, two PCR fragments were produced with α1C,77-pcDNA3 as template and pairs of outer sense and mutagenesis antisense primers, and mutagenesis sense and outer antisense primers, respectively. The mutagenesis antisense and sense primers contained the desired mutated sequence and had 18 bases complementary to each other. The two fragments were fused together by denaturing, annealing, and Taq polymerase extension, the fused DNA product was then amplified by PCR with the outer primer pair. The outer sense and antisense primers were designed from the vector region 5′-ctatagggagacccaagcttc-3′ and α1C,77 open reading frame 5′-CACTTCCTTCTGCAGAACCG-3′ (1550 → 1531), respectively; the mutagenesis antisense and sense primers were 5′-ATCCAGGgcGgCTTTGAGAgCCTCTTCTAGCTGCTGCTT-3′ and 5′-CTCAAAGcCgcCCTGGATgcGATCACTCAGGCCGAAGAC-3′, respectively. The final PCR product was cleaved with HindIII and ClaI and substituted for the 5′-HindIII/ClaI-3′ fragment in α1C,77-pcDNA3 resulting in α1C,77AIDM-pcDNA3. To produce mVenusN-α1C,77AIDM-pcDNA3, the 5′-NdeI/KpnI-3′ fragment of α1C,77AIDM-pcDNA3 was replaced with the 5′-NdeI/KpnI-3′ fragment of vector pmVenus-C1, which contains the mVenus cDNA and is in a continuous reading frame with α1C,77AIDM-pcDNA3.
77ΔLK-pcDNA3 coding for α1C,77ΔLK was prepared by a similar mutagenesis strategy using pHLCC77 plasmid (21) as a template. The mutagenesis primers were 5′-CAGGGCCTTGTGGGCAAGCCC-3′ (sense) and 5′-gcccacaaggccctgCAGGGCCGTCCTGACCAGGGC-3′ (antisense); the outer primers were 5′-CTGTGATGCATGGAATACATTTGACGCCTTGATTG-3′ (sense) and 5′-ctagaactagtggatcctctaGAGTCGACCTGCAG-3′ (antisense). The final PCR product was cleaved with NsiI and XbaI, and then incorporated at the 5′-NsiI and 3′-XbaI sites into pHLCC77. Subsequently, the 5′-PpuMI/XbaI-3′ fragment of the resulting plasmid was ligated at the respective sites in α1C77-pcDNA3. For α1C,77AIDM/ΔLK-pcDNA3, the 5′-PpuMI/XbaI-3′ fragment of α1C,77ΔLK-pCDNA3 was subcloned into α1C,77AIDM-pcDNA3. All cDNA constructs were verified by nucleotide sequencing.
Immunoprecipitation Analysis—Human embryonic kidney (HEK) 293 cells were used for the IP analysis because of high expression efficiency. To exclude endogenous Cav1.2 subunits from the analysis, we expressed only tagged subunits and used antibodies against the tags. For IP-Western blot analysis, ≈80% confluent early passage HEK293 cells in 100-mm culture dishes were transfected with selected plasmids (for details, see figure legends) using Effectene (Qiagen) according to the manufacturer's instructions. 72 h after transfection, cells were harvested and washed 3 times with phosphate-buffered saline. To improve the yield and stability of co-IP, cells were subjected to a standard cross-linking reaction (22, 23) by incubation with the cell-permeant thiol-cleavable reagent dithiobis(succinimidyl propionate) (1 mm) (Pierce) at room temperature for 30 min. Cross-linking was stopped by incubation of cells with 20 mm Tris-HCl (pH 7.5) for 15 min. Cells were lysed with a Cel-Lytic M lysis reagent (450 μl/plate, Sigma) containing a protease inhibitor mixture (Sigma, 1/100 dilution) supplemented with 1 mm phenylmethylsulfonyl fluoride. To ensure direct interaction, the microsomal fraction was used for co-IP experiments involving α1C. The 80-μl aliquots of total lysates were kept to verify the expression of each protein (see “input” on immunoblots). Co-IP was performed with the selected antibodies according to the manufacturer's instructions. Briefly, co-IP with anti-FLAG antibody (Ab) was performed with 40 μl/reaction of a monoclonal EZ View™ ANTI-FLAG® M2 affinity gel (Sigma) at 4 °C overnight, and the immunoprecipitates were eluted by incubation with 10 μg of 3× FLAG peptide (Sigma) in 100 μl of TBS solution (pH 7.4) at 4 °C for 1 h. The co-IP with anti-LC Ab was performed with 5 μl of a Living Colors Full-Length A.V. polyclonal Ab (Clontech) using Protein A-agarose (Sigma) as carrier (overnight at 4 °C), and the immunoprecipitates were eluted by boiling for 5 min at 95 °C. Dithiobis(succinimidyl propionate) was cleaved by incubation of the co-immunoprecipitate and input samples with 5% β-mercaptoethanol at 100 °C for 5 min or with 50 mm dithiothreitol at 37 °C for 30 min (only for α1C) before SDS-PAGE. SDS-PAGE and immunoblotting with the indicated antibodies were performed according to standard protocols. The following primary antibodies were used: anti-FLAG M2 monoclonal Ab (2 μg/ml, Sigma) for the FLAG-tagged proteins, Living Colors Full-Length A.V. monoclonal Ab (0.5 μg/ml, Clontech) for the fluorescent tagged proteins, and streptavidin-horseradish peroxidase (1/1000 dilution, Invitrogen) for the biotin-tagged proteins. Nitrocellulose membrane (Invitrogen) was used for immunoblot analysis of α1C co-IP experiments and polyvinylidene difluoride membrane (Invitrogen) was used for all other studies.
Electrophysiology—The Effectene kit (Qiagen) was used for transfection of COS1 cells as described previously (15) under conditions optimized for a total amount of 0.2 μgof DNA per 35-mm Petri dish. Constructs were expressed in a 1:1 molar ratio. COS1 cells were grown on poly-d-lysine-coated coverslips (MatTek) in Dulbecco's modified Eagle's medium supplemented with 10% fetal calf serum. Whole-cell patch clamp recordings were performed as described (24) at 20–22 °C using the Axopatch 200B amplifier (Axon Instruments) 48–72 h after transfection. The extracellular bath solution contained (in mm): 100 NaCl, 20 BaCl2 or CaCl2, 1 MgCl2, 10 glucose, 10 HEPES, adjusted to pH 7.4 with NaOH. Borosilicate glass pipettes (Kimax-51, Kimble Products) were fire-polished and showed a typical resistance of 3–6 megohms when filled with pipette solution containing (in mm): 110 CsCl, 5 MgATP, 10 1,2-bis(2-aminophenoxy)ethane-N,N,N′,N′-tetraacetic acid, 20 tetraethylammonium, 0.2 cAMP, and 20 HEPES, adjusted to pH 7.4 with CsOH (15). Voltage protocols were generated and data were digitized, recorded, and analyzed using pClamp 8.1 software (Axon Instruments). Test pulses were applied at 15-s intervals from the holding potential Vh =–90 mV. Currents were filtered at 1 kHz, sampled at 2.5–5 kHz, and corrected for leakage using an on-line P/4 subtraction protocol. At the end of experiments, channels were routinely tested for sensitivity of ICa to the inhibition by the dihydropyridine blocker PN200-110 (see examples). I-V curves were obtained by step depolarization to test potentials in the range of –60 to +90 mV (with 10-mV increments) applied from Vh. Steady-state inactivation curves were measured with conditioning pulses (1 s) applied from Vh =–90 mV up to –60 to +40 mV with 10-mV increments followed by a 100-ms test pulse. Peak current amplitudes were normalized to the maximal value. Averaged I-V curves were fit with the equation: I = Gmax (V – Erev)/(1 + exp[(V – V0.5,act)/kI-V]), where Gmax is maximum conductance, Erev is reversal potential, V0.5,act the voltage at 50% of the current (I) activation, and kI-V the slope factor. Steady-state inactivation curves were fitted by a Boltzmann function: I = a + b·(1 + exp[(V – V0.5,in)/ki]), where V is the conditioning pulse voltage; V0.5,in is the voltage at half-maximum of inactivation, ki is a slope factor, a and b are fractions of noninactivating and inactivating components of the current, respectively. To estimate the time constant τ of inactivation, currents were fitted with the Chebyshev method according to the standard exponential function,
 |
(Eq. 1) |
where Ii is the amplitude of the inactivating component of the current, τ is the time constant of inactivation, and I0 is the non-inactivating component of the current. Statistical values are given as mean ± S.E. Error bars in the figures are S.E., n, number of tested cells. Differences were considered significant if Student's t test showed p < 0.05.
Imaging—Cell images were recorded with a 14-bit Hamamatsu digital camera C9100-12 mounted on the Nikon epifluorescent microscope TE200 (60 × 1.2 N.A. objective) equipped with multiple filter sets (Chroma Technology, Rockingham, VT). Excitation light was delivered by a 175-watt Xenon lamp. Images were obtained and analyzed using C-Imaging software program (Compix, Sewickley, PA).
RESULTS
Selection of Appropriate Expression System—Electrophysiological studies of Ca2+ channels are traditionally based on the use of HEK293 cells. However, several independent careful evaluations have shown that these cells contain endogenous Ca2+ channel subunits and exhibit ICa at a level of 1–3 pA/pF (25, 26). Thus, HEK293 cells can be used safely for the functional analysis of recombinant Ca2+ channels only when the amplitude of the current is large enough to ignore the contribution of the endogenous channels. To avoid this problem, in this study we used COS1 cells because they lack endogenous Cav1.2 subunits (27): (a) Western blot analysis with anti-α1C Ab revealed no detectable endogenous α1C in non-transfected COS1 cells (Fig. 2A, lane 1), and (b) no Ca2+ channel activity was observed in COS1 cells expressing recombinant α1C and α2δ subunits (Fig. 2B) in contrast to cells that were co-transfected with β2d, β2Δg, or β2CED (see below). This experiment unambiguously shows that Cav1.2 calcium channels are silent in the absence of Cavβ and that activity of the Ca2+ channel demonstrated in HEK293 cells in the absence of exogenous Cavβ subunits may be due to endogenous channels. The absence of the functional Cavβ subunits in COS1 cells that follows from the data in Fig. 2B was further confirmed by co-IP analysis with recombinant FLAGN-α1C/α2δ that revealed a lack of detectable endogenous monkey β1, β2, β3, and β4 subunits in COS1 cells (28). Kinetics parameters and voltage dependence of activation and inactivation of ICa and IBa through the α1C,77/α2δ/β1a channel measured in COS1 cells were consistent with data obtained in other expression systems (15). An important advantage of COS1 cells is their relatively slow division rate that allows for better control over efficiency of expression and assembly of the Cav1.2 channel subunits of different size. However, HEK293 cells were more appropriate for co-IP-Western blot analysis of the recombinant tagged channel proteins in our study because they provide higher efficiency of expression, whereas endogenous subunits were undetectable with streptavidin and Abs to FLAG and Venus (ECFP) tags by Western blot analysis and fluorescence microscopy.
FIGURE 2.

Characterization of expression of Ca2+ channels in COS1 cells. A, endogenous α1C subunits are not detectable in COS1 cells by Western blotting. Lane 1, non-transfected COS1 cells. Lane 2, COS1 cells expressing the recombinant α1C,77/α2δ/β2d channel. Immunoblot analysis was carried out with antibody against α1C (Chemicon). The position of the α1C subunit is marked on the left side; molecular mass (in kDa) is shown on the right side. B, representative trace of ICa generated in response to Vt =+30-mV applied from Vh =–90 mV to COS1 cells transfected by EYFPN-α1C,77 andα2δ subunits in the absence of Cavβ subunits. No current was observed between 0 and +50 mV. C, superimposed traces of the maximal ICa through the EYFPN-α1C,77/α2δ channel with β2CED (trace 1) or ECFPN-β2CED (trace 2) recorded at Vt =+40 mV and normalized to the same amplitude. The α1C, α2δ, and β2CED subunits were co-expressed in a 1:1:1 molar ratio. No significant difference in the kinetics of the currents was observed.
Localization of β2CED by Deletion Analysis of the β2Δg Subunit—To locate β2CED, we constructed the following β2Δg fragments: 1–82, 83–164, 83–123, and 124–164 (Fig. 3, A–E, panels a). To ease IP and detection, β2Δg fragments were tagged at the N termini with the monomeric mVenus protein (29) or ECFP. As with other Cavβ subunits (e.g. β1a, β2a (15), β2f or β2Δg (19)), fusion of ECFP and mVenus to the N termini of the β2Δg fragments did not markedly change electrophysiological properties of the expressed channels (e.g. β2d(124–164) in Fig. 2C). The ECFPN-labeled β2Δg fragments were co-expressed with the α1C,77 and α2δ subunits in COS1 cells. The relative tendency of the ECFPN-β2Δg deletion mutants to accumulate in PM can be seen in close juxtaposition from distribution of ECFP fluorescence in the expressing cells (Fig. 3, A–E, panels b and c). Ability of the β2Δg deletion mutants to support ICa was assayed by patch clamp (Fig. 3, A–E, panels d). Binding to α1C was assayed by co-IP of the mVenusN-labeled β2Δg fragments with FLAGN-α1C,77/α2δ (Fig. 3F).
FIGURE 3.
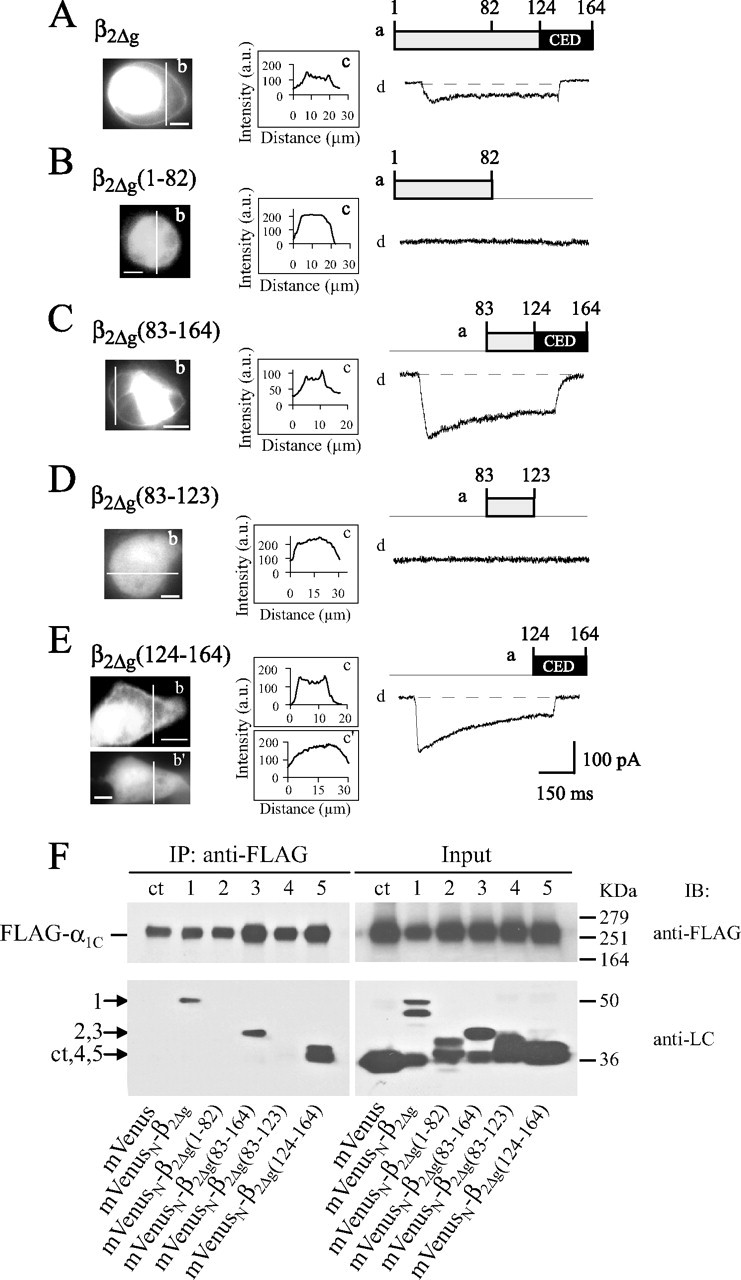
Localization of β2CED by deletion analysis of β2Δg. A, β2Δg. B, β2Δg(1–82). C, β2Δg(83–164). D, β2Δg(83–123). E, β2Δg(124–164). Shown on the panels are: a, scheme of the generated fragments (amino acid numbers are indicated in A); black box, β2CED. b, whole cell fluorescent images of COS1 cells expressing α1C,77 and α2δ with the ECFPN-β2Δg fragments (scale bars, 8 μm). In the experiment shown on E, panel b′, β2CED was expressed alone. c, intensity profiles of ECFP fluorescence along the scan lines presented on panels b and showing PM targeting of the β2Δg fragments. The fluorescence profile on panel c′ (E) corresponds to panel b′ (E) illustrating lack of membrane targeting by β2CED in the absence of α1C and α2δ. d, traces of the maximal ICa evoked by a stepwise depolarization from Vh =–90 mV to Vt =+50 (β2Δg) or +40 mV (all other constructs). F, Western blot analysis of co-IP of FLAGN-α1C,77 with mVenusN-labeled β2Δg (lane 1) and its mVenusN-labeled deletion mutants β2Δg(1–82) (lane 2), β2Δg(83–164) (lane 3), β2Δg(83–123) (lane 4), and β2Δg(124–164) (lane 5). mVenus (lane ct) is the control to confirm the absence of nonspecific binding between the tags. IP and immunoblotting (IB) were performed with the indicated antibodies as described under “Experimental Procedures.” The Input panel is the pre-IP immunoblot showing expression of each tagged protein. Arrows (left panel) mark the location of an mVenus-tagged fragment in each lane. Molecular mass standards (in kDa) are indicated on the right.
Confirming previous observations (19), when co-expressed with α1C,77 and α2δ subunits, β2Δg was appreciably accumulated in PM (Fig. 3A, panels b and c), stimulated inward ICa with an average maximal amplitude of 80 ± 15 pA (n = 45; Fig. 3A, panel d), and co-immunoprecipitated with α1C subunit (Fig. 3F, lane 1). Sequential deletion of the β2Δg subunit (Fig. 3, B–E) revealed that calcium channel activity is associated with the distal quarter of the β2Δg sequence. Only the β2Δg fragments containing the distal C-terminal regions 83–164 (Fig. 3C) and 124–164 (Fig. 3E) induced the current when co-expressed with α1C,77/α2δ (panels d) and directly interacted with α1C, as evident from the marked accumulation in PM (panels b and c) and Western blot analysis of co-IP with microsomal α1C (Fig. 3F, lanes 3 and 5). Taken together, results of this analysis show that the C-terminal sequence of 41 amino acids of the Cavβ2 subunit (β2CED) represents a previously unknown determinant that may have a role in calcium channel modulation. Amino acid alignment revealed (Fig. 4) that β2CED is conserved in Cavβ2 and shares only a subtle homology with the other Cavβ subunits.
FIGURE 4.

Homology alignment of β2CED with human CaVβ subunits. Conserved residues are shown in black boxes. Blast analysis revealed that β2CED is 100% conserved in the C termini of all known human CaVβ2 subunits (not shown), whereas only β1b2 (M92303) shows 43% of homology with β2CED. No substantial homology was seen with β1b1 (M92302), β3 (X76555), β4 (U95020), β1a (not shown), or other human proteins as revealed by a general blast analysis. Thus, β2CED is unique for Cavβ2 subunits.
Electrophysiological Properties of the β2CED-supported Channel—In COS1 cells expressing EYFPN-α1C,77 and α2δ subunits, the average maximal amplitude of ICa decreased from 647 ± 34 pA (n = 48) with β2d to 120 ± 25 pA (n = 48) with β2CED. Fig. 5A shows a family of representative traces of ICa evoked by a stepwise depolarization in the range of –20 to +60 mV applied from Vh =–90 mV. The currents were almost completely inhibited by the specific L-type calcium channel blocker (+)PN200-110 (Fig. 5B, traces a). An interesting feature of these currents is the presence of a large slow component of inactivation that is unusual for the Ca2+-conducting Cav1.2 channels. Analysis of the steady-state inactivation curve (Fig. 5C) showed that at the end of a 1-s conditioning pulse 14.5 ± 1.7% (n = 12) of the peak ICa remained non-inactivated. Analysis of ∼50 expressing cells revealed that ICa evoked by Vt between –20 and 0 mV are better fitted with two exponentials and showed a prominent fast component of inactivation (see Table 1). The latter property can be better appreciated from the exemplar ICa traces (recorded at –20 and –10 mV) in Fig. 5B that have larger amplitude than the representative currents in Fig. 5A. However, at Vt ≥ 10 mV, the decay of ICa was better fitted by a single exponential. The large sustained current (I0, Table 1) is characteristic for all shown voltages and may be indicative of the inhibited slow inactivation (6, 24).
FIGURE 5.
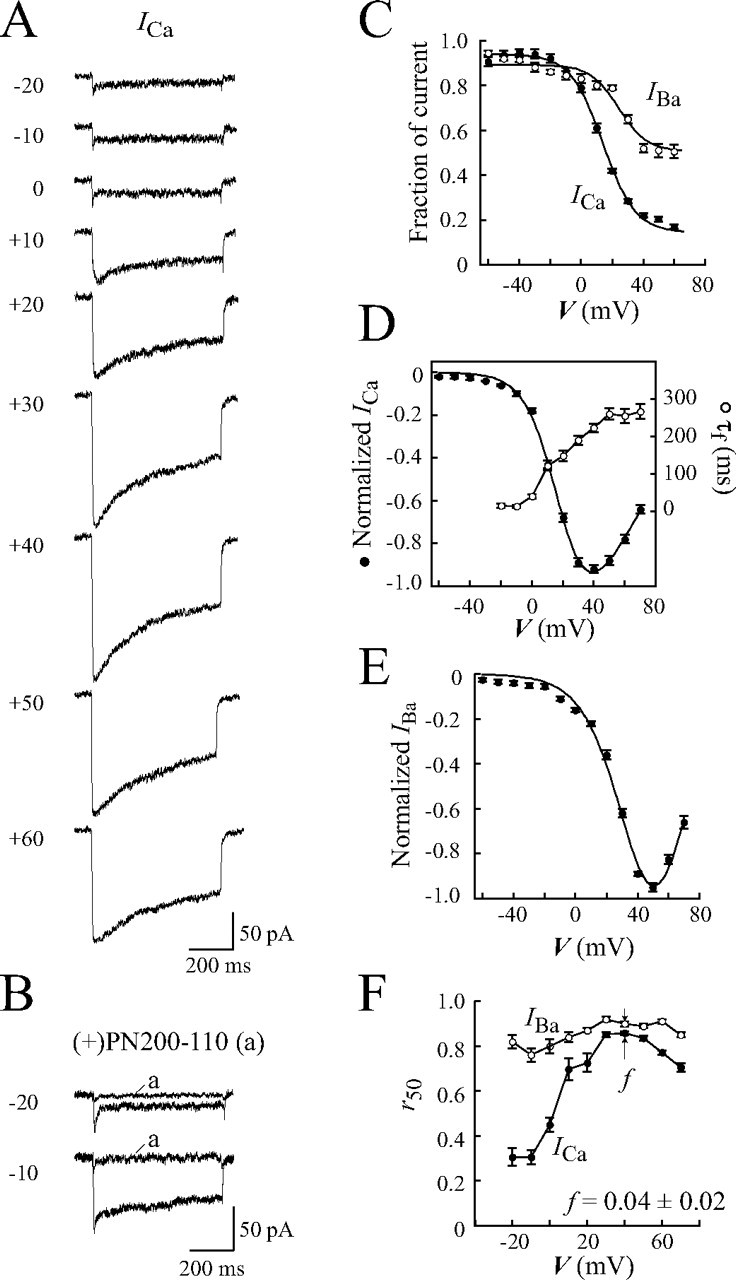
Electrophysiological properties of the β2CED-modulated calcium channel. A, representative traces of ICa evoked by the indicated test pulses applied for 600 ms from Vh =–90 mV. β2CED was co-expressed in COS1 cells with EYFPN-α1C,77 and α2δ subunits. B, exemplar recordings of ICa before and after (traces a) application of 4 μm (+)PN200–110. Values of Vt are shown on the left. C, steady-state inactivation curves for ICa (n = 12) and IBa (n = 24). D, the normalized I-V curve (filled circles) and voltage dependence of τf (open circles) for ICa. See text for V0.5,act statistics (n = 48). E, the normalized I-V relationship for IBa (n = 31). F, dependence of r50 on test pulse voltage for ICa (filled circles, n = 48) and IBa (open circles, n = 31). Factor f is the difference between the r50 values of ICa and IBa at the maximum of I-V curves (+40 mV). Smooth lines in C–E represent fits of the average data (see “Experimental Procedures”).
TABLE 1.
Comparison of kinetics parameters of inactivation of ICa through the Cav 1.2 channel modulated by β2d and β2CED
|
V |
β2d (n = 48) |
β2CED (n = 48) |
||||||||
|---|---|---|---|---|---|---|---|---|---|---|
| I0 | If | τf | Isa | τs | Io | If | τf | Isb | τs | |
| mV | ms | ms | ms | ms | ||||||
| -20 | 0.50 ± 0.03 | 0.32 ± 0.02 | 15 ± 5 | 0.27 ± 0.03 | 118 ± 30 | |||||
| -10 | 0.49 ± 0.13 | 0.52 ± 0.10 | 284 ± 10c | 0.47 ± 0.03 | 0.39 ± 0.03 | 13 ± 3 | 0.25 ± 0.04 | 142 ± 39 | ||
| 0 | 0.59 ± 0.04 | 0.42 ± 0.04 | 132 ± 20c | 0.57 ± 0.03 | 0.35 ± 0.04 | 40 ± 6 | 0.05 ± 0.02 | 180 ± 26 | ||
| 10 | 0.46 ± 0.03 | 0.43 ± 0.02 | 86 ± 13 | 0.10 ± 0.02 | 310 ± 75 | 0.47 ± 0.03 | 0.49 ± 0.04 | 122 ± 12 | ||
| 20 | 0.34 ± 0.03 | 0.47 ± 0.02 | 59 ± 6c | 0.19 ± 0.02 | 388 ± 63 | 0.43 ± 0.02 | 0.57 ± 0.03 | 148 ± 14 | ||
| 30 | 0.33 ± 0.02 | 0.55 ± 0.02 | 96 ± 6c | 0.12 ± 0.02 | 485 ± 62 | 0.36 ± 0.01 | 0.64 ± 0.03 | 189 ± 12 | ||
| 40 | 0.31 ± 0.02 | 0.67 ± 0.02 | 119 ± 7c | 0.37 ± 0.01 | 0.63 ± 0.03 | 223 ± 12 | ||||
| 50 | 0.31 ± 0.02 | 0.69 ± 0.02 | 172 ± 16c | 0.37 ± 0.02 | 0.63 ± 0.03 | 260 ± 15 | ||||
| 60 | 0.35 ± 0.02 | 0.64 ± 0.02 | 217 ± 33 | 0.35 ± 0.03 | 0.65 ± 0.03 | 255 ± 19 | ||||
| 70 | 0.43 ± 0.03 | 0.55 ± 0.03 | 238 ± 21 | 0.59 ± 0.05 | 0.41 ± 0.05 | 267 ± 20 | ||||
The slow component of the β2d-modulated channel was identified only in ICa of high amplitude around the peak current.
Relative size of the slow component of ICa through the β2CED-modulated channel decreased with an increase of Vt from -20 to 0 mV.
p < 0.01 compared to τf for β2CED (unpaired t test).
Co-plotting of I-V and τ-V curves (Fig. 5D) showed that when β2d in the channel (Table 1) was replaced with β2CED, inactivation of ICa became slower on stronger depolarization and did not depend on the size of the current. The corresponding lack of U-shaped τ-V dependence is evidence that β2CED does not support CDI (30). To further characterize modulation of inactivation of the Cav1.2 channel by β2CED, we tested the effect of replacement of Ca2+ for Ba2+ in the bath medium on kinetics of the current decay. When Ba2+ is the charge carrier, Cav1.2 channels inactivate by a voltage-dependent mechanism (2). The I-V relationship for IBa (V0.5,act = 41.3 ± 4.3, n = 31, Fig. 5E) was shifted to more positive potentials as compared with ICa (V0.5,act = 19.8 ± 1.8, n = 48, Fig. 5D). A ∼10-mV positive shift of the steady-state inactivation curve was also observed on replacement of Ca2+ (V0.5,in = 13.9 ± 1.1) for Ba2+ (V0.5,in = 24.2 ± 3.3) in the bath medium (Fig. 5C), whereas the voltage dependence of availability of the β2CED-modulated channel was increased to 50.6 ± 2.9% (n = 24) with Ba2+ as the charge carrier. These data suggest that the inactivating fraction of channels is reduced in Ba2+ because of increased voltage dependence of availability of the β2CED channel.
Having revealed these unusual inactivation properties of the β2CED channel, we tested for CDI by calculating the f factor (31), which is the difference between the r50 values, or fractions of ICa and IBa remaining at the end of a 50-ms depolarization. The 50-ms window was selected to accurately account for the relatively fast decay of ICa in the range of –20 to +10 mV (Fig. 5A). Confirming the result of the τ-V analysis (Fig. 5D), no U-shaped dependence of r50 on Vt was observed for ICa, whereas those for IBa was almost flat (Fig. 5F). A sharp difference between r50 values for IBa and ICa at lower voltages reflects a switch from an apparent biexponential voltage-dependent inactivation at –20 to 0 mV to a predominantly single-component mechanism at Vt ≥ 10 mV (see above). One could argue that this result may be due to a specific level of intracellular Ca2+ buffering in our experiment. However, CDI in Cav1.2 calcium channels exhibits low sensitivity to intracellular Ca2+ buffers (32, 33). The possibility that β2CED evokes CDI only in the narrow voltage range of –20 to 0 mV is doubtful because Ca2+ currents at these potentials are relatively small, and contribution of the voltage-dependent inactivation is probably greater. Making no further assumptions about the nature of this property, we compared inactivation of ICa and IBa near the maximum of I-V curves (Fig. 5, D and E), where CDI should be the most prominent (30). The difference f between r50 values at +30 to +50 mV was close to zero (f = 0.04 ± 0.02 at +40 mV, Fig. 5F). This result is consistent with the lack of CDI and explains the slow kinetics of ICa decay in the β2CED channel by the lack of the negative feedback regulation of inactivation by the permeating Ca2+ ions.
Overlaying of ICa and IBa traces, scaled to the same amplitude, is a common approach to estimate the contribution of CDI and voltage-dependent mechanisms in inactivation of the channel. In Fig. 6 we compared inactivation properties of β2CED- and β2d-modulated channels by superimposing ICa and IBa traces near the maximum of I-V curves. At Vt between +20 and +40 mV, where the currents are larger, the β2d-modulated ICa inactivated notably faster than IBa (Fig. 6A) due to CDI. In contrast, we observed a matching decay of ICa and IBa for the β2CED-modulated channel (Fig. 6B) confirming the lack of CDI. We next compared decays of ICa and IBa sampled near the maximum of I-V curves. Because of CDI, the β2d-modulated ICa inactivated appreciably faster than with β2CED (Fig. 6C). However, IBa through both β2CED- and β2d-modulated channels recorded at the same test voltages showed a very similar decay (Fig. 6D) indicating striking similarity of the voltage-dependent inactivation of the channels. Thus, the Ca2+/Ba2+ test confirmed lack of CDI in the β2CED-modulated channel. Lack of CDI is an unusual property that was not previously observed in Cav1.2 channels with native pore-forming α1C subunits.
FIGURE 6.

Comparison of inactivation of the β2CED- and β2d-modulated calcium channels with Ca2+ and Ba2+ as the charge carrier. A and B, comparison of ICa and IBa recorded from COS1 cells expressing α1C,77/α2δ and β2d (A) or β2CED (B). Current traces were normalized to the maximum amplitude of the respective ICa. One can see that ICa inactivated much faster than IBa in the case of β2d, but not β2CED, thus confirming that β2CED does not support CDI. C and D, comparison of IBa (C) and ICa (D) through the α1C,77/α2δ channels modulated by β2CED or β2d. The traces were normalized to the maximum amplitude of ICa through the α1C,77/α2δ/β2CED (C) and α1C,77/α2δ/β2d (D) channels. Unlike CDI, voltage-dependent inactivation of the channel supported by β2CED was not markedly changed. Currents were recorded at Vt =+20, +30, and +40 mV applied from Vh = –90 mV.
Effect of β2CED Deletion from β2d on the Cav1.2 Calcium Channel—To better understand the functional impact of β2CED on Cavβ2 subunit modulation of Cav1.2 channels, the distal 41-amino acid sequence (identical to those of β2Δg(124–164)) was genetically deleted from β2d. Modulation of the Cav1.2 channel by the obtained deletion mutant β2dΔCED was compared with those of β2d (Fig. 7). Similar to other Cavβ subunits, β2d facilitated large ICa through the Cav1.2 channel. Distinct features of ICa through the β2d channel include: 1) a relatively large sustained component of the current that comprised ∼35% of the peak current at the end of a 600-ms depolarization pulse (Fig. 7A), and 2) a prominent shift of the maximum I-V curve from a typical value of +20 to +30 mV (15) to +40 mV (Fig. 7C, closed circles). As expected, β2d supported CDI and showed a U-shaped τ-V dependence of ICa peaked near the maximum of I-V curve (Fig. 7C, open circles).
FIGURE 7.
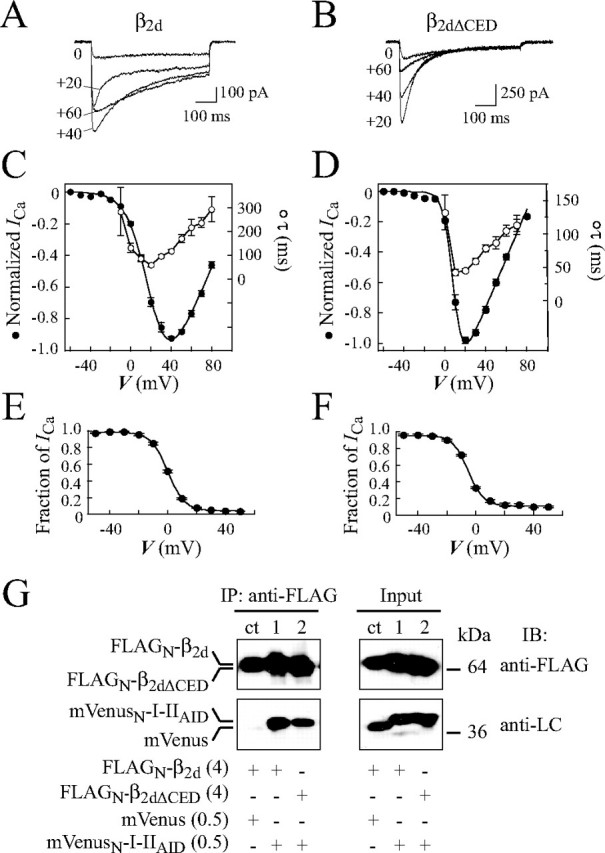
Effect of the β2CED deletion from β2d on inactivation properties of the channel and binding to AID. A–F, effect on ICa. COS1 cells were transfected with α1C,77, α2δ, and ECFPN-β2d (A, C, and E) or ECFPN-β2dΔCED (B, D, and F). A and B, exemplar traces of ICa evoked by the indicated test potentials applied for 600 ms from Vh =–90 mV. C and D, normalized I-V curves (filled circles) co-plotted with τ-V relations (open circles). Values of τ were obtained from single exponential fitting. β2d, V0.5,act = 20.7 ± 0.8 mV, n = 16 (C). β2dΔCED, V0.5,act = 8.5 ± 0.5 mV; n = 12 (D). E and F, steady-state inactivation curves. β2d, V0.5,in = 0.1 ± 0.2 mV, ki = 5.8 ± 0.1, n = 20 (E). β2dΔCED, V0.5,in =–5.3 ± 0.3 mV, ki = 5.3 ± 0.2, n = 13 (F). Smooth lines in panels C–F represent fits of the average data. G, deletion of β2CED from β2d does not interfere with binding to AID. FLAGN-β2d (lanes ct and 1) or FLAGN-β2dΔCED (lane 2) was co-expressed with mVenus (control, lane ct) or mVenusN-I-IIAID (lanes 1 and 2). Proteins were solubilized, immunoprecipitated with anti-FLAG Ab, and both the pre-IP (input) and IP fractions were resolved by SDS-PAGE (see “Experimental Procedures”). FLAGN-tagged β2d and β2dΔCED were identified on Western blot by anti-FLAG Ab (top panels). mVenus and mVenusN-I-IIAID were detected by anti-LC Ab (bottom panels). Molecular mass calibration in kDa is shown at the right. Amount of plasmid DNA (μg) per transfection reaction is given in parentheses. In the control assay, binding of mVenus to the tested Cavβ was not observed (lane ct).
The β2dΔCED-modulated channel generated large inward ICa (average maximal amplitude 466 ± 160 pA, n = 12) in response to depolarization in a characteristic range of membrane potentials (Fig. 7B). Similar to the β2d-modulated channel, decay of ICa at all tested potentials was better fitted by a single exponential. The τ-V relation had a distinct U-shape indicating that deletion of the β2CED from the β2d subunit did not compromise CDI (Fig. 7D). The maximal inactivation rate of ICa through the β2dΔCED-modulated channel was faster (τ = 43 ± 5 ms at +10 mV) than that modulated by β2d (τ = 59 ± 6 ms at +20 mV). The voltage dependence of activation (V0.5,act) and inactivation (V0.5,in) of the β2dΔCED-modulated channel were shifted by ∼12 (Fig. 7, C and D) and 5 mV (Fig. 7, E and F) to more negative voltages, respectively, suggesting that deletion of β2CED endows the channel a higher voltage sensitivity (for statistics, see figure legend). Taken together, these results and data in Fig. 5 point to a synergy between MAGUK and β2CED, but they may act independently as modulators of the Cav1.2 channel.
At present, the prevailing view suggests that AID is a constitutive binding site for all known Cavβ subunits. To further test whether deletion of β2CED from the β2d subunit interferes with binding to AID, we used the I-IIAID peptide (amino acids 418–455 of the α1C,77 subunit) that harbors AID (amino acids 428–445) in its central part and retains binding affinity to Cavβ subunits (34). To ease IP and detection, I-IIAID was tagged at the N terminus with the monomeric mVenus protein (29). The mVenusN-labeled I-IIAID was co-expressed with FLAGN-tagged β2d (Fig. 7G, lane 1) or β2dΔCED (lane 2) in HEK293 cells. Consistent with the results of electrophysiological experiments (Fig. 7, A–F), Western blot analysis of co-IP showed that deletion of CED from β2d did not compromise binding of β2dΔCED to I-IIAID as compared with β2d (Fig. 7G).
β2CED Supports Cav1.2 Channels in the Absence of AID—When mVenusN-β2CED and BiotinN-I-IIAID were co-expressed in HEK293 cells (Fig. 8A), β2CED was identified (lane 1) on Western blot by monoclonal anti-LC Ab in both the immunoprecipitated (top left panel) and input (top right panel) fractions. However, I-IIAID was detected on the blot by streptavidin only in the input fraction (bottom panel). Thus, co-IP analysis indicates that β2CED does not bind to AID. These data suggest that β2CED exerts its modulation of the Cav1.2 channel through interaction with a site(s) other than AID.
FIGURE 8.
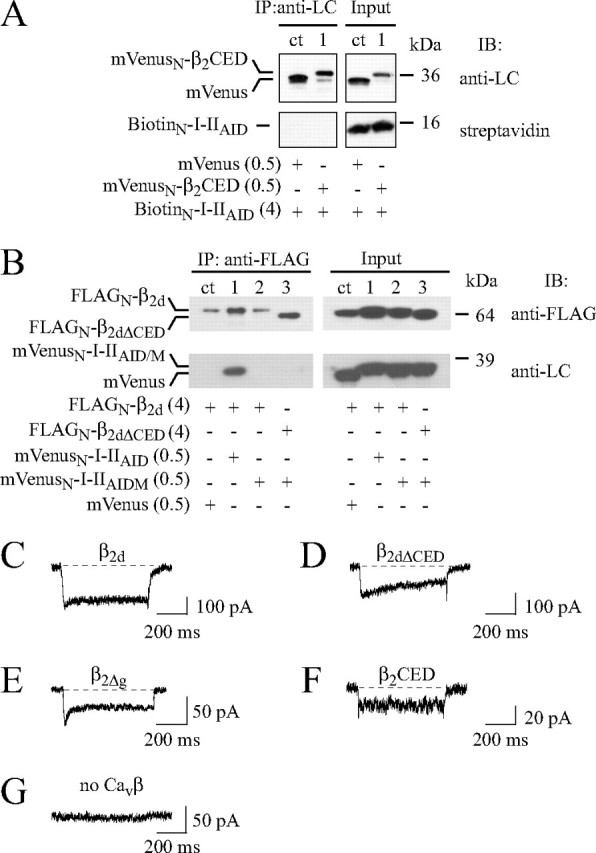
Evidence thatβ2CED does not target AID. A, β2CED does not bind to AID. mVenus (control, lane ct) or mVenusN-β2CED (lane 1) was co-expressed with BiotinN-I-IIAID in HEK293 cells. Proteins were immunoprecipitated (IP) with polyclonal anti-LC Ab and resolved by SDS-PAGE. mVenus (ct) andβ2CED (1) were identified on Western blot (IB) by monoclonal anti-LC Ab (top panels), whereas I-IIAID was identified by streptavidin (bottom panels). B, combined mutation D433A,G436A,Y437A,W440A of I-IIAID (I-IIAIDM; see “Experimental Procedures”) inhibited binding of β2d. Co-IP of mVenus (ct), mVenusN-I-IIAID (lane 1), or mVenusN-I-IIAIDM (lanes 2 and 3) with FLAGN-β2d (lanes ct, 1 and 2) or FLAGN-β2dΔCED (lane 3) was assayed as described in the legend to Fig. 7G. The amount of plasmid DNA (μg) per transfection reaction is shown in parentheses. C–G, modulation of the α1C,77AIDM channel current by β2d (C), β2dΔCED (D), β2Δg (E), β2CED (F), or no Cavβ (G) after co-expression with α2δ in COS1 cells. Shown are representative traces of maximal ICa recorded in response to a stepwise depolarization to +10 (E) or +30 mV (all other) applied for 600 ms from Vh =–90 mV.
To confirm this conclusion, we abolished binding of the β subunit MAGUK domain to α1C by the combined substitution with alanine at four key positions (Asp433, Gly436, Tyr437, and Trp440) of the α1C I-II linker (10, 12, 35). Co-IP assay (Fig. 8B) confirmed that binding of β2d to I-IIAID (lane 1) was abolished by the AID mutation independently on the presence (lane 2) or absence (lane 3) of β2CED. The AID mutation was then incorporated into the α1C,77 subunit, and the resulting mutant α1C,77AIDM was co-expressed in COS1 cells with α2δ and β2d (Fig. 8C), β2dΔCED (Fig. 8D), β2Δg (Fig. 8E), or β2CED (Fig. 8F). Electrophysiological experiments showed that, despite the inhibited binding between MAGUK and AID (Fig. 8B), β2d facilitated ICa through the mutated α1C,77AIDM channel that showed little, if any, inactivation (Fig. 8C). As it is shown in Fig. 2B, no current could be detected in COS1 cells expressing α1C/α2δ in the absence of Cavβ. The AID mutation did not inhibit conductance completely, but reduced the amplitude of the maximal ICa induced by β2d to 131 ± 25 pA (n = 5) suggesting that the channel activation outside of AID by the full-size Cavβ2 does occur, but is less effective than that with the participation of intact AID. The same conclusion was obtained with β2dΔCED, β2Δg, and β2CED. When β2d was substituted for β2dΔCED (Fig. 8D), we observed a functionally active channel that exhibited a slowly inactivating ICa with an average maximum amplitude of 150 ± 24 pA (n = 6). Similar to β2Δg (Fig. 8E), inactivation of a large fraction of ICa was inhibited by substitution of β2d for β2CED (Fig. 8F), whereas the average amplitude of the peak ICa through the α1C,77AIDM channel was smaller (40 ± 15 pA, n = 3). No appreciable modulation of the α1C,77AIDM channel (i.e. zero ICa) was observed in the absence of Cavβ (Fig. 8G). Thus, inhibition of the MAGUK domain binding to AID did not abolish the sensitivity of the channel to β2CED. These data confirm that essential regulatory properties of Cavβ are AID-independent (17) and show that β2CED can serve as a weak I-II linker-independent activator of the Cav1.2 channel even when AID is mutated causing large conformational changes in the I-II loop.
Analysis of β2CED Interaction with the LA/IQ Region of α1C—A meaningful characterization of the β2CED modulation of the channel requires identification of its functional target. A recent report (36) demonstrated that the N-terminal domain of MAGUK in Cavβ binds to the α1C subunit C-terminal region (amino acids 1571–1636 in α1C,77) that is involved in CaM-mediated CDI regulation and includes LA and IQ loci of interaction with apo-CaM and Ca2+/CaM, respectively (37) (Fig. 1). Because β2CED does not support CDI, we tested β2d (containing β2CED) and β2dΔCED (lacking β2CED) for binding to LA/IQ. Co-IP analysis showed (Fig. 9) that LA/IQ binds β2d and β2dΔCED independently on the presence of I-IIAID; moreover, β2d and β2dΔCED bound to LA/IQ do not form triple complexes with I-IIAID.
FIGURE 9.

Both β2d and β2dΔCED bind to the LA/IQ domain independently on AID. mVenusN-β2d (lanes 1 and 3) or mVenusN-β2dΔCED (lanes 2 and 4) were co-expressed with FLAGN-LA/IQ in the presence (lanes 3 and 4) or absence of mVenusN-I-IIAID. ct, control showing lack of interaction between mVenus and FLAGN-LA/IQ. Upper panels, identification of β2d, β2dΔCED, and I-IIAID on Western blot by monoclonal anti-LC Ab. Lower panels, identification of LA/IQ by anti-FLAG Ab. Amount of plasmid DNA (μg) per transfection reaction is shown in parentheses. IB, immunoblot.
We then tested β2CED for binding to LA/IQ. The FLAGN-tagged LA/IQ domain was co-expressed with mVenusN-β2CED (Fig. 10) in the presence (lanes 1 and 2) or absence of ECFPN-CaM (lanes 3 and 4). To assess for Ca2+ dependence of binding, cells were permeabilized for external Ca2+ before co-IP by incubating with ionophore ionomycin (5 μm) in the bath medium containing 2 mm EGTA (lanes 1 and 3) or 2 mm Ca2+ (lanes 2 and 4). Co-IP analysis confirmed that β2CED binds to LA/IQ independently on Ca2+ or co-expressed CaM.
FIGURE 10.

β2CED binds to LA/IQ domain independently on Ca2+ and CaM. FLAGN-LA/IQ was co-expressed with mVenus (control, lane ct) or mVenusN-β2CED (lanes 1–4) in the presence (lanes 1 and 2) or absence (lanes 3 and 4) of ECFPN-CaM. Before co-IP, cells were incubated for 5 min in 10 mm HEPES, 150 mm NaCl (pH 7.4), containing 5 μm of ionomycin and either 2 mm EGTA (lanes 1 and 3) or 2 mm CaCl2 (lanes 2 and 4). Proteins were co-IP with anti-FLAG Ab and resolved by SDS-PAGE. Upper panels, identification of CaM and β2CED on Western blot by monoclonal anti-LC Ab (lanes 1–4). Lower panels, identification of LA/IQ by anti-FLAG Ab. The amount of plasmid DNA (μg) per transfection reaction is shown in parentheses.
Is LA/IQ the only region necessary for β2CED action? To answer this question, we deleted LA/IQ from the α1C,77 subunit and co-expressed the resulting α1C,77ΔLK mutant with α2δ and β2d or β2CED (Fig. 11A). β2d modulated the channel via MAGUK/AID interaction and induced ICa with an average maximal amplitude ∼90 ± 25 pA (panel a, n = 3). Under the same conditions, with β2CED no appreciable ICa was observed on cell depolarization (panel b). This result suggests that the LA/IQ region is the only functional target of the α1C subunit where β2CED may exert its action. To test whether LA or IQ determinants of CDI are essential for modulation of the channel by β2CED, we examined the effect of β2CED on the α1C,77 mutants lacking IQ (Fig. 11B, α1C,77L) or LA (Fig. 11C, α1C,77K) determinants defined in Fig. 1. In the absence of Cavβ, none of the tested channels showed appreciable ICa in response to Vt = +20 mV applied from Vh =–90 mV for 600 ms (Fig. 11, B and C, panels a). Co-expression of β2CED induced ICa only with α1C,77L (average maximal amplitude ∼208 ± 28 pA, n = 5, see Fig. 11B, panel b) indicating that it is the LA determinant of CDI that is the functional target of β2CED modulation of the channel. Under the same conditions, β2d supported ICa through both α1C,77K (Fig. 11D, panel a; average maximal amplitude 231 ± 13 pA, n = 14) and α1C,77L channels (Fig. 11D, panel b; average maximal amplitude 389 ± 24 pA, n = 8). However, mutation of AID combined with the deletion of LA/IQ from the α1C subunit (α1C,77AIDM/ΔLK) completely inhibited modulation of the channel by β2d (Fig. 11E).
FIGURE 11.
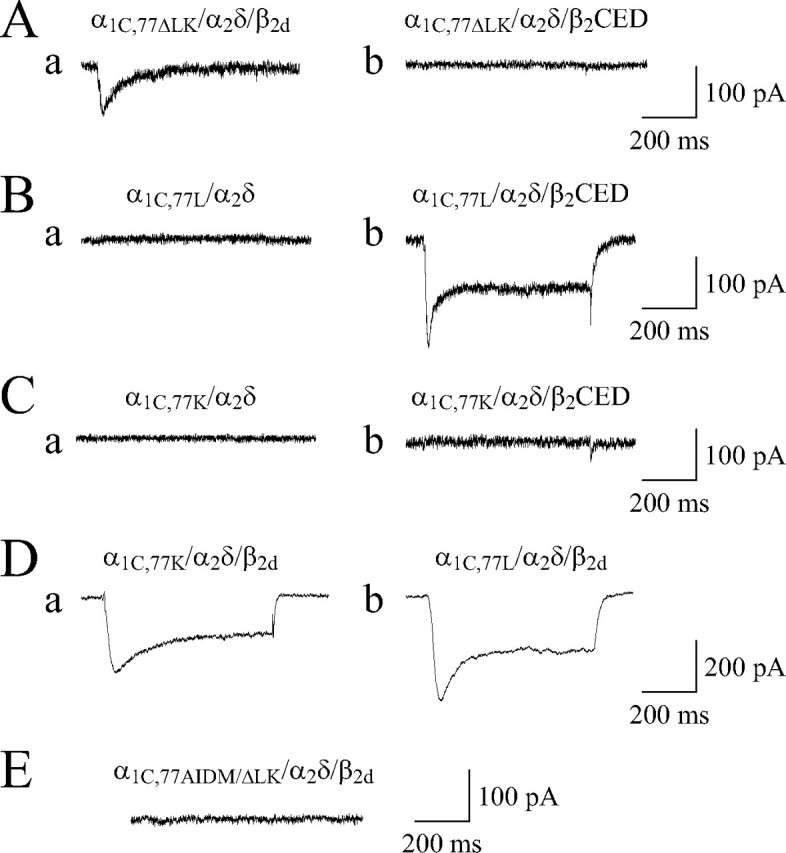
Functional assessment of the role of LA/IQ in modulation of the Cav1.2 calcium channel by β2CED. A, deletion of LA/IQ from α1C,77 abolished facilitation of the α1C,77ΔLK channel ICa gating by β2CED, but not by β2d. α1C,77ΔLK was co-expressed in COS1 cells with α2δ in the presence of mVenusN-β2d (panel a) or mVenusN-β2CED (panel b). B and C, β2CED supports gating of the IQ-mutated α1C,77L channel but not the LA-mutated α1C,77K channel. α1C,77L (B) or α1C,77K (C) was co-expressed in COS1 cells with α2δ in the absence (panels a) or presence (panels b) of mVenusN-β2CED. D, evidence that β2d supported ICa in the α1C,77K (panel a) and α1C,77L (panel b) channels. E, simultaneous mutation of AID and deletion of LA/IQ abolished modulation of the α1C,77AIDM/ΔLK/α2δ channel by β2d. Shown are representative traces of maximal ICa recorded in response to a stepwise depolarization to +30 (A and D) or +20 mV (B, C, and E) applied for 600 ms from Vh =–90 mV.
DISCUSSION
Our study revealed that modulation of Cav1.2 channels by large Cavβ2 subunits is mediated by inputs from multiple binding sites. There are at least three interactions between α1C and Cavβ2 subunits (Fig. 12, A–C) that induce activity of the channel not only jointly, but also when any two of the interactions are disrupted by mutations of α1C. The Cav1.2 channel modulation common to all large Cavβ subunits is supported by the binding of the central MAGUK domain to the AID site of the α1C subunit I-II linker (4) (Fig. 12A). This interaction stabilizes the functional conformation of AID (and, respectively, the I-II linker), as well as provides specific orientation of the rigid core of Cavβ important for multiple isoform-specific interactions leading to differential modulation of the channel (15, 17). However, disruption of this interaction by the mutation of AID (Fig. 8B) does not prevent activation of the channel by Cavβ that relies on two other α1C determinants located in the LA-IQ region (Figs. 5 and 8, C, D, and F). Deletion of these LA/IQ determinants partially inhibited activity of the channel in the presence of β2d as can be seen from the smaller ICa amplitude (Fig. 11A, panel a). A dynamic Ca2+-dependent interaction between the N-terminal SH3 region of MAGUK and the IQ domain of the α1C subunit (36) (Fig. 12B) appears to also be common to all large Cavβ subunits. This interaction alone is sufficient to support ICa (Fig. 8D).
FIGURE 12.
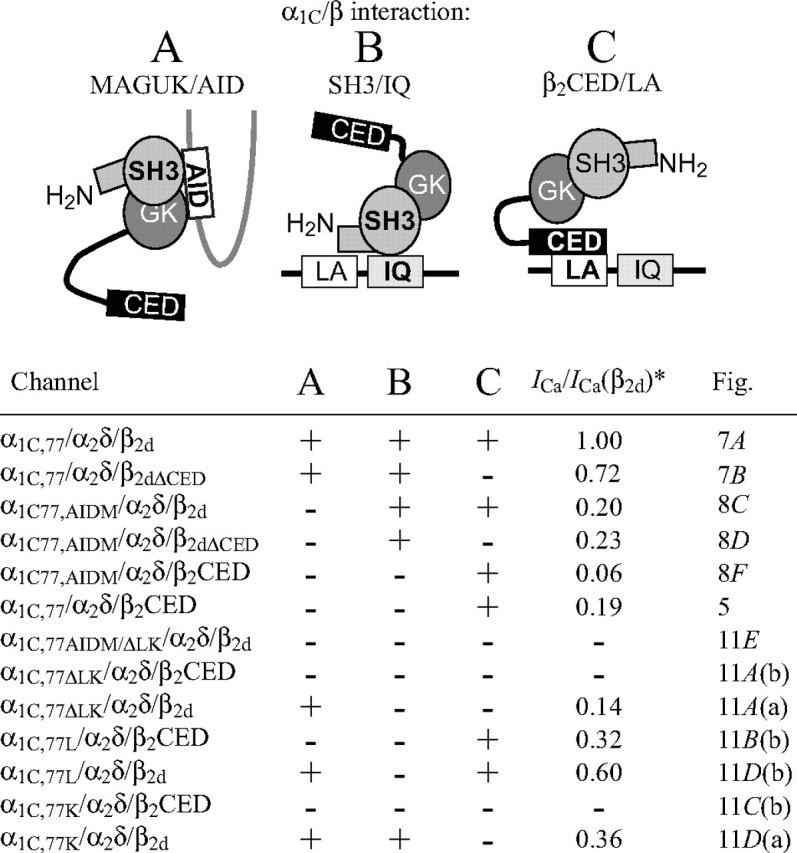
Simplified diagrams of the three CaVβ2/α1C interactions. A, MAGUK/AID (4, 10–12); B, SH3/LA/IQ (36); C, β2CED/LA. For clarity, potential interaction motifs are shown with sizes not to scale. Because the number of Cavβ per functional channel is not yet known, these schematic interactions are not unified into a single regulatory model. In the lower part, the mutated channels, implemented CaVβ2/α1C interactions, relative size of ICa (asterisk) (normalized to those through the α1C,77/α2δ/β2d channel) as well as references to the respective figure are listed.
In this study, we localized the third molecular determinant of the Cav1.2 channel modulation, β2CED (Fig. 12C), which is specific only to Cavβ2 (Fig. 4) and resides in the C termini of β2a, β2b, β2c, β2d, β2e, β2f, and β2Δg subunits. Thus, β2CED represents a functional element of the Cav1.2 modulation that is conserved in primary cardiac Cavβ2 subunits. In the case of full size Cavβ2 (β2a-β2e) (20), β2CED acts in synergy with other determinants, as seen from the ability of β2CED and β2dΔCED to support ICa with different properties (Figs. 5 and 7). However, β2CED may induce activity of the channel independently on MAGUK, i.e. either alone (Fig. 5) or in the context of “short” β2 subunits, as in the case of the naturally occurring β2Δg subunit (19) (Fig. 8E). Similar to other Cavβ subunits, β2CED activates the channels by binding to α1C (Fig. 3F) and targeting to PM (Fig. 3E), but does not support CDI (Fig. 5D). It appears that β2CED affects voltage gating of the channel. Indeed, similar to β2d (Fig. 7C), the β2CED-modulated channel has the maximum I-V curve at +40 mV (Fig. 5D), whereas deletion of β2CED from β2d shifted the voltage dependence of ICa by 20 mV to lower potentials (Fig. 7D). We find that β2CED binds to the LA/IQ region of the α1C subunit C-terminal tail in a Ca2+- and CaM-independent manner and needs the LA, but not IQ, motif to activate the channel (Fig. 10). This is the first observation of the Cavβ2 subunit regulation of the Cav1.2 calcium channel that does not rely on Cavβ/AID interaction.
Although β2CED did not bind to AID (Fig. 8A), mutation of AID interfered with the interaction of the channel with β2CED that was reflected in the smaller amplitude of ICa (cf. Figs. 5A and 8F). This result points to high sensitivity of all three α1C/ Cavβ2 interactions (Fig. 12) to the conformation of AID that is probably a key component of mutually dependent determinants of channel regulation (7, 24).
Another important conclusion from our study is that CDI does not depend solely on the α1C subunit. Indeed, co-expression of intact α1C and α2δ subunits with β2CED generates the channel lacking CDI (Figs. 5 and 6). It is known that CDI is mediated by interactions of CaM with two adjacent sites (LA and IQ) of the α1C subunit C terminus (for review, see Ref. 38). We found that CDI ultimately requires both MAGUK/AID and SH3/IQ interactions (Fig. 12, A and B). Thus the role of Cavβ, AID, and LA/IQ interactions in the ensemble of mutually coordinated determinants of CDI is essential.
The exact number of Cavβ subunits (of the same or different type) that bind to an individual α1C subunit is unknown. Results in Fig. 9 show that β2d is not involved in a simultaneous binding to LK and AID, although this subunit can be engaged in all three types of interactions shown in Fig. 12. Therefore, it is possible that there is more than one Cavβ2 subunit interacting with the same α1C. On the other hand, if Cavβ does dissociate from the AID of the functional channel (39), then it is possible that modulation of the channel may be mediated by a single Cavβ2 molecule alternating between AID and LA/IQ sites. An additional complexity (36) to this general picture may be brought about by the N-terminal palmitoylation site known to anchor the β2a subunit in PM (40).
Taken together, our results provide new insight into potential role(s) of β2CED in modulation of Cav1.2 channels. Cavβ2 is a major cardiac β subunit and its splice variation is an important correlate of the Cav1.2 calcium channel regulation (20, 41). One of the most puzzling questions raised by our study is why Cavβ2 contains more than one α1C interaction motif. One possible reason for this complexity may be associated with the role of β2CED in additional tuning of the voltage dependence of the current (20). Indeed, results of electrophysiological measurements (Fig. 7) show that deletion of β2CED from β2d significantly changed kinetics of inactivation of ICa and shifted the peak of the I-V curve by 20 mV toward more negative potentials. Another reason may be that differential, tissue-specific splicing of the Cavβ2 gene (18) may generate subsets of the Cav1.2 calcium channel modulated only through β2CED. These channels do not support CDI and generate small, but long-lasting Ca2+ currents. It is usually assumed that ICa is rapidly and fully inactivated, but our results raise the hypothesis that Ca2+ signaling in human cardiac cells expressing small Cavβ2 subunits (19) may involve Ca2+-insensitive Cav1.2 channels in addition to L-type channels regulated by CDI. One possibility is that Ca2+ channels that rely on β2CED-dependent, MAGUK-independent modulation in cardiac muscle cells may account for the prolongation of L-type ICa and therefore contribute to the balance that controls the shape of the action potential plateau. Whichever role of β2CED is predominant, it may be a new potential pharmacological target.
Acknowledgments
We thank Dr. S. S. Vogel (NIAAA, National Institutes of Health) for the gift of mVenus C1 plasmid, Dr. Kuanghueih Chen (NIA, National Institutes of Health) for the gift of pFLAG-2AB-pcDNA3, and Dr. Josephine Egan (NIA) for critically reading the manuscript.
This work was supported, in whole or in part, by the National Institutes of Health NIA Intramural Research Program. The costs of publication of this article were defrayed in part by the payment of page charges. This article must therefore be hereby marked “advertisement” in accordance with 18 U.S.C. Section 1734 solely to indicate this fact.
Footnotes
The abbreviations used are: PM, plasma membrane; Ab, antibody; AID, α1-interaction domain; anti-LC, anti-Living Color Ab to EGFP; β2CED, C-terminal essential determinant of the Cavβ2 subunit; CaM, calmodulin; CDI, Ca2+-dependent inactivation; ECFP, enhanced cyan fluorescent protein; EYFP, enhanced yellow fluorescent protein; IP, immunoprecipitation; MAGUK, membrane-associated guanylate kinase; Vh, holding potential; Vt, test potential; SH, Src homology domain; HEK, human embryonic kidney.
References
- 1.Jiang, Y., Lee, A., Chen, J., Cadene, M., Chait, B. T., and MacKinnon, R. (2002) Nature 417 523–526 [DOI] [PubMed] [Google Scholar]
- 2.Catterall, W. A. (2000) Annu. Rev. Cell Dev. Biol. 16 521–555 [DOI] [PubMed] [Google Scholar]
- 3.García, R., Carrillo, E., Rebolledo, S., García, M. C., and Sánchez, J. A. (2002) J. Physiol. (Lond.) 545 407–419 [DOI] [PMC free article] [PubMed] [Google Scholar]
- 4.Pragnell, M., De Waard, M., Mori, Y., Tanabe, T., Snutch, T. P., and Campbell, K. P. (1994) Nature 368 67–70 [DOI] [PubMed] [Google Scholar]
- 5.Doyle, D. A., Morais Cabral, J., Pfuetzner, R. A., Kuo, A., Gulbis, J. M., Cohen, S. L., Chait, B. T., and MacKinnon, R. (1998) Science 280 69–77 [DOI] [PubMed] [Google Scholar]
- 6.Shi, C., and Soldatov, N. M. (2002) J. Biol. Chem. 277 6813–6821 [DOI] [PubMed] [Google Scholar]
- 7.Stotz, S. C., Jarvis, S. E., and Zamponi, G. W. (2004) J. Physiol. (Lond.) 554 263–273 [DOI] [PMC free article] [PubMed] [Google Scholar]
- 8.Hanlon, M. R., Berrow, N. S., Dolphin, A. C., and Wallace, B. A. (1999) FEBS Lett. 445 366–370 [DOI] [PubMed] [Google Scholar]
- 9.Opatowsky, Y., Chomsky-Hecht, O., Kang, M.-G., Campbell, K. P., and Hirsch, J. A. (2003) J. Biol. Chem. 278 52323–52332 [DOI] [PubMed] [Google Scholar]
- 10.Chen, Y.-h., Li, M.-h., Zhang, Y., He, L.-l., Yamada, Y., Fitzmaurice, A., Shen, Y., Zhang, H., Tong, L., and Yang, J. (2004) Nature 429 675–680 [DOI] [PubMed] [Google Scholar]
- 11.Opatowsky, Y., Chen, C.-C., Campbell, K. P., and Hirsch, J. A. (2004) Neuron 42 387–399 [DOI] [PubMed] [Google Scholar]
- 12.Van Petegem, F., Clark, K. A., Chatelain, F. C., and Minor, D. L., Jr. (2004) Nature 429 671–675 [DOI] [PMC free article] [PubMed] [Google Scholar]
- 13.Beurg, M., Sukhareva, M., Ahern, C. A., Conklin, M. W., Perez-Reyes, E., Powers, P. A., Gregg, R. G., and Coronado, R. (1999) Biophys. J. 76 1744–1756 [DOI] [PMC free article] [PubMed] [Google Scholar]
- 14.Cens, T., Mangoni, M. E., Richard, S., Nargeot, J., and Charnet, P. (1996) Pflügers Arch. Eur. J. Physiol. 431 771–774 [PubMed] [Google Scholar]
- 15.Kobrinsky, E., Kepplinger, K. J. F., Yu, A., Harry, J. B., Kahr, H., Romanin, C., Abernethy, D. R., and Soldatov, N. M. (2004) Biophys. J. 87 844–857 [DOI] [PMC free article] [PubMed] [Google Scholar]
- 16.Dolphin, A. C. (2003) J. Bioenerg. Biomembr. 35 599–620 [DOI] [PubMed] [Google Scholar]
- 17.Maltez, J. M., Nunziato, D. A., Kim, J., and Pitt, G. S. (2005) Nat. Struct. Mol. Biol. 12 372–377 [DOI] [PubMed] [Google Scholar]
- 18.Foell, J. D., Balijepalli, R. C., Delisle, B. P., Yunker, A. M. R., Robia, S. L., Walker, J. W., McEnery, M. W., January, C. T., and Kamp, T. J. (2004) Physiol. Genomics 17 183–200 [DOI] [PubMed] [Google Scholar]
- 19.Harry, J. B., Kobrinsky, E., Abernethy, D. R., and Soldatov, N. M. (2004) J. Biol. Chem. 279 46367–46372 [DOI] [PubMed] [Google Scholar]
- 20.Colecraft, H. M., Alseikhan, B., Takahashi, S. X., Chaudhuri, D., Mittman, S., Yegnasubramanian, V., Alvania, R. S., Johns, D. C., Marban, E., and Yue, D. T. (2002) J. Physiol. (Lond.) 541 435–452 [DOI] [PMC free article] [PubMed] [Google Scholar]
- 21.Soldatov, N. M., Bouron, A., and Reuter, H. (1995) J. Biol. Chem. 270 10540–10543 [DOI] [PubMed] [Google Scholar]
- 22.Carlsson, J., Drevin, H., and Axén, R. (1978) Biochem. J. 173 723–737 [DOI] [PMC free article] [PubMed] [Google Scholar]
- 23.Xiang, C. C., Mezey, E., Chen, M., Key, S., Ma, L., and Brownstein, M. J. (2004) Nucleic Acids Res. 32 e185. [DOI] [PMC free article] [PubMed] [Google Scholar]
- 24.Kobrinsky, E., Tiwari, S., Maltsev, V. A., Harry, J. B., Lakatta, E., Abernethy, D. R., and Soldatov, N. M. (2005) J. Biol. Chem. 280 12474–12485 [DOI] [PubMed] [Google Scholar]
- 25.Berjukow, S., Döring, F., Froschmayr, M., Grabner, M., Glossmann, H., and Hering, S. (1996) Br. J. Pharmacol. 118 748–754 [DOI] [PMC free article] [PubMed] [Google Scholar]
- 26.Kurejova, M., Uhrik, B., Sulova, Z., Sedlakova, B., Krizanova, O., and Lacinova, L. (2007) Eur. J. Pharmacol. 567 10–18 [DOI] [PubMed] [Google Scholar]
- 27.Meir, A., Bell, D. C., Stephens, G. J., Page, K. M., and Dolphin, A. C. (2000) Biophys. J. 79 731–746 [DOI] [PMC free article] [PubMed] [Google Scholar]
- 28.Ravindran, A., Lao, Q. Z., Harry, J. B., Abrahimi, P., Kobrinsky, E., and Soldatov, N. M. (2008) Proc. Natl. Acad. Sci. U.S.A., in press [DOI] [PMC free article] [PubMed]
- 29.Koushik, S. V., Chen, H., Thaler, C., Puhl, H. L., III, and Vogel, S. S. (2006) Biophys. J. 91 L99–101 [DOI] [PMC free article] [PubMed] [Google Scholar]
- 30.Zhou, J., Olcese, R., Qin, N., Noceti, F., Birnbaumer, L., and Stefani, E. (1997) Proc. Natl. Acad. Sci. U. S. A. 94 2301–2305 [DOI] [PMC free article] [PubMed] [Google Scholar]
- 31.Peterson, B., Lee, J., Mulle, J., Wang, Y., de Leon, M., and Yue, D. (2000) Biophys. J. 78 1906–1920 [DOI] [PMC free article] [PubMed] [Google Scholar]
- 32.Cens, T., Restituito, S., Galas, S., and Charnet, P. (1999) J. Biol. Chem. 274 5483–5490 [DOI] [PubMed] [Google Scholar]
- 33.Liang, H., DeMaria, C. D., Erickson, M. G., Mori, M. X., Alseikhan, B. A., and Yue, D. T. (2003) Neuron 39 951–960 [DOI] [PubMed] [Google Scholar]
- 34.Takahashi, S. X., Miriyala, J., Tay, L. H., Yue, D. T., and Colecraft, H. M. (2005) J. Gen. Physiol. 126 365–377 [DOI] [PMC free article] [PubMed] [Google Scholar]
- 35.Seu, L., and Pitt, G. S. (2006) J. Gen. Physiol. 128 605–613 [DOI] [PMC free article] [PubMed] [Google Scholar]
- 36.Zhang, R., Dzhura, I., Grueter, C. E., Thiel, W., Colbran, R. J., and Anderson, M. E. (2005) FASEB J. 19 1573–1575 [DOI] [PubMed] [Google Scholar]
- 37.Romanin, C., Gamsjaeger, R., Kahr, H., Schaufler, D., Carlson, O., Abernethy, D. R., and Soldatov, N. M. (2000) FEBS Lett. 487 301–306 [DOI] [PubMed] [Google Scholar]
- 38.Morad, M., and Soldatov, N. (2005) Cell Calcium 38 223–231 [DOI] [PubMed] [Google Scholar]
- 39.Gerster, U., Neuhuber, B., Groschner, K., Striessnig, J., and Flucher, B. E. (1999) J. Physiol. (Lond.) 517 353–368 [DOI] [PMC free article] [PubMed] [Google Scholar]
- 40.Qin, N., Platano, D., Olcese, R., Costantin, J. L., Stefani, E., and Birnbaumer, L. (1998) Proc. Natl. Acad. Sci. U. S. A. 95 4690–4695 [DOI] [PMC free article] [PubMed] [Google Scholar]
- 41.Hullin, R., Khan, I. F. Y., Wirtz, S., Mohacsi, P., Varadi, G., Schwartz, A., and Herzig, S. (2003) J. Biol. Chem. 278 21623–21630 [DOI] [PubMed] [Google Scholar]