

Abstract
Smooth muscle contraction is regulated by the phosphorylation of myosin. It is well known that tonic smooth muscles can maintain force with low energy consumption (latch state); however, the molecular mechanism underlying this phenomenon is unresolved. Here we show that single-head phosphorylated smooth myosin (SHPMII) exhibits fast (∼24 s–1) and slow prolonged (∼1 s–1) actin interactions, whereas double-head phosphorylated myosin (DHPMII) predominantly exhibits the fast (∼29 s–1) interaction, suggesting that the phosphorylated head of SHPMII is mechanically as active as that of DHPMII. Both the fast and the slow actin interactions of SHPMII support the positive net mechanical displacement of actin. The actin translocating velocity of SHPMII was much slower than that of DHPMII, which is consistent with the slow actin interaction of SHPMII. We propose that the “latch state” can be explained by the motor characteristics of SHPMII that is present during the sustained phase of contraction.
Smooth muscle is distributed in a variety of tissues such as airways, vasculature, digestive tract, bladder, and uterus. Some smooth muscle cells, such as found in digestive tract, ileum, bladder, and uterus, are mainly relaxed and show phasic contractions upon stimulations. These smooth muscles (often referred to as “phasic smooth muscles”) contract and relax rapidly, and their phasic responses are advantageous to the physiological functions such as peristalsis. On the other hand, other smooth muscle cells, such as the smooth muscle cells in airways and vasculature, show sustained contractions, and thus they are often referred to as “tonic smooth muscles.” Tonic smooth muscles contract slowly, and very importantly, they can maintain force with very low energy consumption (1, 2). This state of tonic contraction is referred to as the “latch state,” and the tone of the contraction plays critical roles in the change in dimension of the hollow organs for regulating airflow, blood flow, organ perfusion, filtration rate of glomeruli, and so forth. Dysregulation of these smooth muscles causes a variety of pathophysiological states such as asthma and hypertension.
Contractions of both phasic and tonic smooth muscles are regulated by the phosphorylation of the regulatory light chain (RLC)3 of smooth muscle myosin (3–8), and the muscle shortening velocity is closely correlated with the extent of the phosphorylation. Upon agonist stimulations, both phasic and tonic smooth muscles show a transient increase in force that is closely correlated with the transient increment of myoplasmic Ca2+ concentration and the concomitant RLC phosphorylation. In a phasic contraction, the force returns quickly to the basal level because of the reduction of the myoplasmic Ca2+ concentration (thus the phosphorylation level of RLC) to the basal level. In a tonic contraction, however, although the level of myosin phosphorylation declines after the transient increment of the myoplasmic Ca2+ concentration, it does not completely return to the basal level, and the force is maintained with low ATP consumption (1, 2). Because smooth muscle myosin has two heads that interact with actin, it is possible that three different phosphorylation forms of smooth muscle myosin are present in situ, i.e. unphosphorylated (UPMII), phosphorylated at both heads (DHPMII), and phosphorylated at one head (SHPMII). Because phosphorylation and dephosphorylation of RLC of smooth muscle myosin occur randomly (9, 10) and because the total phosphorylation level of smooth muscle myosin during the latch state is just 20–30% (11), the fraction of SHPMII is predicted to be significant and greater than that of the DHPMII during the latch state. Therefore, it is important to know the motor characteristics of SHPMII for understanding the molecular mechanism of the latch state. In this study, we characterized the mechanical properties of SHPMII for the first time and found that the latch state is well explained by the motor property of SHPMII.
MATERIALS AND METHODS
Protein Preparation—Smooth muscle myosin was prepared from turkey gizzards as described (12). Heavy meromyosin (HMM) and S1 were prepared from the gizzard smooth muscle myosin as described (12). Actin was prepared from rabbit skeletal muscle (13). RLC (from chicken gizzard) with C-terminal hexahistidine tag or FLAG tag was expressed in BL21 (DE3) Escherichia coli and purified as described (14). C-terminally tagged RLC has been successfully used in in vivo experiments (15, 16).
Thiophosphorylation of the recombinant RLC and HMM were performed in buffer containing 150 mm KCl, 30 mm Tris-HCl, pH 7.5, 2 mm MgCl2, 0.2 mm CaCl2, 2 mm ATPγS, 5 mm dithiothreitol, 5 μg/ml myosin light chain kinase (MLCK), and 10 μg/ml calmodulin for 1 h at 25 °C. The phosphorylation was confirmed by alkali-urea gel electrophoresis (not shown).
Preparation of Single-head Phosphorylated (SHP) Myosin—The inherent RLC was removed from myosin or HMM as previously described (14). Phosphorylated RLC-FLAG and dephosphorylated RLC-hexahistidine (1.5 mol of excess over heavy chain each) were mixed with the RLC-deficient heavy chain. The mixture was then applied to a nickel-nitrilotriacetic acid column (Qiagen). Unphosphorylated, SHP, and DHP were eluted separately by imidazole HCl gradient as described (17), and the fraction containing SHP was further purified by FLAG affinity column.
In Vitro Motility Assay—The in vitro motility assay was performed as described previously (18). The movement speed of actin filaments was analyzed by collecting 100–150 data points obtained from 10–15 different actin filaments. The error bars indicate the standard deviations.
Single Molecule Assay—Myosin rod cofilaments were prepared as described previously (19) and raised from the glass surface to a level higher than the bead radius. To achieve this, pedestals (∼5–10 μm in width and ∼5 μm in height) were made on the glass surface by chemically etching the glass slides. A solution containing myosin rod cofilaments was applied to a flow chamber with pedestals on a glass slide surface, which was coated with bovine serum albumin (0.5 mg/ml; Sigma) to prevent nonspecific binding of avidin-coated beads. Unbound cofilaments were washed out with assay buffer. Partially (∼10%) biotinylated actin filaments were mixed with avidincoated beads and introduced to the chamber in the assay buffer. Actin filaments labeled with phalloidin-TRITC (Sigma), myosin rod cofilaments including TRITC-labeled rod, and beads were visualized under an epifluorescence microscope. An actin filament, with both ends attached to separate beads captured by dual optical traps, was then brought into contact with a myosin rod cofilament on the surface of a pedestal at an angle of 5–10 degrees between the actin filament and the cofilament. The displacement of one of the beads was determined using a quadrant photodetector with nanometer accuracy. The displacements were measured in an assay buffer containing 25 mm KCl, 5 mm MgCl2, 2 mm ATP, 20 mm HEPES-KOH, pH 7.6, at 20–25 °C. To reduce photobleaching, an oxygen scavenger system was added as described (19).
Computer Simulation—Fractions of UPMII, SHPMII, and DHPMII were estimated by computer simulation using STELLA v8.1.1 software (Isee Systems, Lebanon, NH). The rate constants of phosphorylation from UPMII to SHPMII and from SHPMII to DHPMII were assumed to be the same. Likewise, rate constants of dephosphorylation from DHPMII to SHPMII and from SHPMII to UPMII were assumed to be the same. The activities of MLCK and myosin light chain phosphatase (MLCP) were shown arbitrarily in Fig. 4A to show their relative rates of phosphorylation (kMLCK) and dephosphorylation (kMLCP). The rate of [UPMII] formation was simply described as kMLCP [SHPMII] – kMLCK [UPMII]. Likewise, the rates of [SHPMII] formation and [DHPMII] formation were described as kMLCK [UPMII] + kMLCP [DHPMII] – (kMLCK + kMLCP) [SHPMII] and kMLCK [SHPMII] – kMLCP [DHPMII], respectively. The initial values of [UPMII], [SHPMII], and [DHPMII] at time 0 were 100, 0, and 0, respectively. The simultaneous differential equation was solved by Runge-Kutta fourth approximation with calculation time interval of 0.3 s. Halving and doubling the time interval did not affect the result.
FIGURE 4.

Simulation of the production of smooth muscle myosins with different phosphorylation states (UPMII, SHPMII, and DHPMII) in the smooth muscle fiber after agonist stimulation. A, time-dependent relative activities of MLCK and MLCP during the contraction of tonic smooth muscle. B, fractions of UPMII, SHPMII, and DHPMII during a tonic contraction of smooth muscle.
RESULTS
To examine the motor characteristics of smooth muscle myosin phosphorylated at one head, we prepared smooth muscle myosin species phosphorylated at both heads (DHPMII), phosphorylated at one head (SHPMII), or unphosphorylated (UPMII) (Fig. 1A). To obtain these smooth muscle myosin species, the inherent RLCs were specifically removed from smooth muscle myosin and replaced with the recombinant RLCs, which were either phosphorylated or unphosphorylated. These recombinant RLCs contained hexahistidine tag or FLAG epitope tag to facilitate the purification. Fig. 1B shows a typical example of the purification of SHPMII. A HMM version of the smooth muscle myosin species (DHPHMM, SHPHMM, and UHPHMM) was also prepared for the solution kinetics assays, because the filament formation of myosin makes an accurate analysis of the enzymatic activity difficult. The smooth muscle myosin species used in this study are summarized in Table 1.
FIGURE 1.
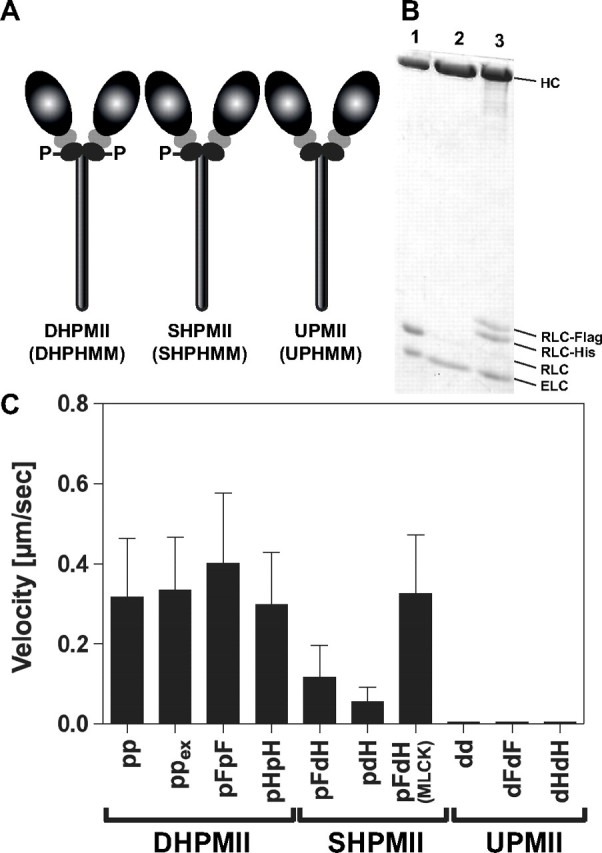
Smooth muscle myosin species used in this study. A, schematic drawing of smooth muscle myosin species with different phosphorylation states. The heavy meromyosin versions of the smooth muscle myosin species were also used for solution kinetics experiments. B, preparation of the single-head phosphorylated smooth muscle myosin. The sample of each preparation step was examined by SDS-PAGE and stained by Coomassie Brilliant Blue. Lane 1, smooth muscle myosin; lane 2, RLC depleted smooth muscle myosin; lane 3, SHPMII containing a phosphorylated RLC-FLAG and a dephosphorylated RLC-hexahistidine. C, in vitro actin translocating activities of smooth myosin species. Actin filament movement was observed in 25 mm KCl, 25 mm HEPES-KOH, pH 7.5, 5 mm MgCl2, 1 mm EGTA, 0.5% methylcellulose, 4.5 mg/ml glucose, 216 μg/ml glucose oxidase, 36 μg/ml catalase, and 2 mm ATP at 25 °C. All of the values of velocity are the means ± S.D. (n = 100–150). The movement of actin was observed for more than 30 s, and the average velocities were calculated.
TABLE 1.
Smooth muscle myosin species used in this study
| RLC exchanged? | RLC | |
|---|---|---|
| Double-head phosphorylated | ||
| pp | No | p-RLC/p-RLC (native RLC) |
| ppex | Yes | p-RLC/p-RLC (recombinant RLC) |
| pFpF | Yes | p-FLAG-RLC/p-FLAG-RLC (recombinant RLC) |
|
pHpH
|
Yes
|
p-His6-RLC/p-His6-RLC (recombinant RLC)
|
| Single-head phosphorylated | ||
| pFdH | Yes | p-FLAG-RLC/His6-RLC (recombinant RLC) |
|
pdH
|
Yes
|
p-RLC/His6-RLC (recombinant RLC)
|
| Unphosphorylated | ||
| dd | No | RLC/RLC (native RLC) |
| dHdH | Yes | His6-RLC/His6-RLC (recombinant RLC) |
| dFdF | Yes | FLAG-RLC/FLAG-RLC (recombinant RLC) |
In Vitro Actin Translocating Activities—We first examined the actin translocating activities of the smooth muscle myosin species (Fig. 1C). The DHPMII species having the exchanged RLC with epitope tags (ppex, pFpF, and pHpH) showed comparable actin translocating velocities to that of the control DHPMII (pp), whereas all of the UPMII species (dd, dHdH, and dFdF) did not show actin translocating activity. These results strongly indicate that the RLC exchange procedure itself and the epitope tags of RLC do not impair the regulation and the motor activity of smooth muscle myosin. In contrast to DHPMII, the translocation of the actin filaments by the SHPMII species (pFdH and pdH) were not uniform. The actin filament movement was frequently intermitted, and thus the apparent overall movements were slower than the DHPMII species (Fig. 1C and supplemental Movies S1 and S2). To assure that this apparentlgy slow actin translocation is not due to the nonfunctional myosin molecules generated during the preparation, we tested whether this characteristic nonuniform actin translocating activity of SHPMII was rescued by treating the flow chamber used for the motility assay with Ca2+-calmodulin-activated MLCK. As shown in Fig. 1C and in supplemental Movie S3, the Ca2+-calmodulin-activated MLCK treatment completely rescued the slow and uneven actin translocating activity of SHPMII to the same level as that of DHPMII. It should be noted that the smooth actin translocation by DHPMII was hardly affected by mixing UPMII to DHPMII with 1:1 ratio (supplemental Movie S4). These results suggest that the slow intermittent movement of SHPMII is due to the presence of the dephosphorylated head within the same molecules and that SHPMII retains a unique actomyosin interaction that is not present in DHPMII.
Dwell Time Distributions of Actin Interaction—To examine the mechanical property of SHPMII in detail, we performed a single molecule mechanical nanometry assay using optical trap (Fig. 2A). We used the “cofilament” method in which smooth muscle myosin molecules are incorporated into the headless myosin rod filaments to avoid damage to the molecules during the interaction with the glass (19, 20). To produce cofilaments, we incubated the myosin rods at large molar excess compared with DHPMII, SHPMII, or UPMII to ensure that only one or two smooth muscle myosins are incorporated into each cofilament. Cofilaments were sparsely adsorbed onto the surface of a pedestal made on a glass surface. The number of myosins in a cofilament was determined by observing single fluorescent nucleotide analogues bound to myosin (19–21). The number of the fluorescence spots in a cofilament caused by the bound nucleotides (Cy3-ATP/ADP) was mostly one and occasionally two, indicating that only one or two smooth muscle myosin molecules were incorporated into a cofilament. An actin filament with both ends attached to optically trapped beads was brought into contact with a single smooth muscle myosin in a cofilament, and the individual mechanical events were determined by measuring bead displacements with nanometer accuracy (21–23).
FIGURE 2.

Single molecule mechanical measurement of smooth muscle myosin with optical trap nanometry. A, the nanometry setup for measuring actin displacements by a single smooth muscle myosin molecule. B, typical recordings of actin displacements by DHPMII, SHPMII, and UPMII. The white dots represent raw data. The data passed through a low pass filter of 30-Hz bandwidth is shown by black lines. Note the differences in the time scale among the recordings. C, dwell time distribution of the actomyosin interaction. The integrated frequencies of DHPMII (pp) (n = 2051), SHPMII (pFdH) (n = 704), and UPMII (dd) (n = 237) were plotted against the observed dwell times. Both single exponential and double exponential fitting were tested, and the residuals are shown in the inset graphs. Note that the differences in the amplitude of the residuals among the smooth muscle myosin species came from their different sampling sizes (n = 2051, 704, and 237 for DHPMII, SHPMII, and UPMII, respectively). The single exponential fitting gave apparent rates of 29.0 ± 0.2, 21.1 ± 0.4, and 2.5 ± 0.1 s–1 for DHPMII, SHPMII, and UPMII, respectively, whereas the double exponential fittings gave 28.8 ± 1.3 s–1 (97%) and 1.3 ± 1.6 s–1 (3%) for DHPMII, 24.2 ± 0.6 s–1 (92%) and 1.0 ± 0.3 s–1 (8%) for SHPMII, and 12.3 ± 0.7 s–1 (41%) and 1.1 ± 0.1 s–1 (59%) for UPMII. The percentage values are the amplitude contributions of the different rate components. The amplitudes of the fitting curves were greater than the total integrated frequencies because displacements with very short dwell times were not detected because of the 30-Hz low pass filtering of the raw data. (The shortest possible events we can detect with the 30-Hz low pass filter can be calculated as 1/2 Pi/30 =∼5 ms. Thus the dead time of our measurement is ∼5 ms.) Note that the dwell time distribution of DHPMII is fairly explained by a single exponential kinetics, whereas those of SHPMII and UPMII are well explained by double exponential.
Typical recordings of displacements of actin by DHPMII, SHPMII, and UPMII are shown in Fig. 2B. To precisely analyze the dwell time distributions, the integrated frequency was plotted against the dwell time and analyzed by both single exponential and double exponential functions (Fig. 2C). The dwell time distribution of DHPMII was fairly explained by a single exponential kinetics with an apparent rate of 29.0 ± 0.2 s–1, and the double exponential fitting did not significantly improve the fitting. SHPMII showed a significant frequency of prolonged dwell times compared with DHPMII. The frequency of dwell time longer than 1 s was ∼6% of the observed total events for SHPMII, whereas that of DHPMII was only ∼0.3%. The dwell time distribution of SHPMII was best explained by a double exponential kinetics with apparent rate constants of 24.2 ± 0.6 s–1 (92%) and 1.0 ± 0.3 s–1 (8%). The fast rate (24.2 ± 0.6 s–1) was similar to the rate observed for DHPMII (29.0 ± 0.2 s–1), suggesting that the two heads of SHPMII are distinct: one head is as active as the heads in DHPMII, whereas the other head is partially active with a slow actomyosin interaction. The dwell time distribution of UPMII was also satisfactorily explained by a double exponential kinetics with apparent rate constants of 12.3 ± 0.7 s–1 (41%) and 1.1 ± 0.1 s–1 (59%).
The ADP release rate determines the dwell times of a myosin molecule on actin under the physiological concentration of ATP, and thus it is closely related to the actin translocating activities of myosins. Because the single molecule experiment was performed under a saturating ATP condition (2 mm), the apparent rates represent the ADP release rates from actomyosin. We measured the ADP release rates of the smooth myosin species by measuring the actomyosin dissociation rate in the presence of ADP induced by saturating ATP using HMM constructs: DHPHMM, SHPHMM, and UPHMM (supplemental text). As expected, the ADP release rate of DHPHMM (28.6 ± 1.6 s–1) was consistent with the rate obtained from the dwell time distribution of DHPMII (29.0 ± 0.2 s–1). Likewise, the ADP release rates of SHPHMM (27.4 ± 1.5 s–1) and UPMII (12.1 ± 0.8 s–1) were consistent with the faster rates of SHPMII (24.2 ± 0.6 s–1) and UPMII (12.3 ± 0.7 s–1) obtained from the dwell time distributions (Fig. 2C). The ADP release rates of the RLC exchanged HMMs of DHPHMM (pFpF) and UPHMM (dHdH) were almost identical to those of RLC unexchanged controls (pp and dd, respectively) (supplemental Table S2), suggesting that the RLC exchange procedure and the FLAG or the hexahistidine tag of RLC do not impair the motor activity of smooth muscle myosin. The ADP release rate of S1 was ∼25 s–1. A similar rate has been reported previously (24). The rate is comparable with the faster ADP release rates of DHP and SHP. The results are consistent with the notion that S1 is as active as the phosphorylated head of the double-headed form (DHP). A slow ADP release rate of SHPHMM and UPHMM that was expected from the slow dwell time distribution (Fig. 2C) was not evident. If both heads of single molecule SHPHMM or single molecule UPHMM simultaneously bind to actin in the presence of ADP, we should be able to observe the slow rate predominantly because the acto-HMM dissociation should be limited by the slow interaction. However, we could not observe the slow ADP release rate for SHPHMM and UPHMM clearly. It is possible that the phosphorylated head of SHPMII is fully active, whereas the unphosphorylated head is partially active, and that only the fully active head of SHPMII preferentially binds to actin in the presence of ADP, and thus we observed that the ADP release rate originated only from the phosphorylated head. In the case of UPHMM, it is reported that the two heads interact asymmetrically with each other (25). Thus it is possible that the motor property of the two heads is distinct because of the asymmetric interaction and that only one of the two heads with faster ADP release rate predominantly binds to actin in the presence of ADP. To verify this possibility, we examined whether two heads of DHPHMM, SHPHMM, and UPHMM bind to actin in the presence of ADP using pyrene-labeled actin. It has been known that the fluorescence intensity of pyrene-actin decreases upon binding of myosin. Pyrene-labeled actin was mixed with substoichiometric concentration of DHPHMM (pp), SHPMII (pdH and pFdH), or UPHMM (dd) in the presence of 0.2 mm ADP, and the decrease in pyrene fluorescence intensity was monitored. The degree of the fluorescence change was compared under the same condition (supplemental Fig. S3). S1 was used as control for the fluorescence change upon complete binding of the myosin head. The binding of DHPHMM (pp) to actin decreased the fluorescence intensity of pyrene-actin to a similar extent as S1, suggesting that both heads of DHPHMM bind to actin in the presence of ADP. The result is consistent with previous studies (26, 27). The decrement of pyrene fluorescence intensity induced by the binding of SHPHMM (pdH and pFdH) was approximately half of that induced by DHPHMM (pp), suggesting that only one of the two heads of SHPHMM preferentially binds to actin in the presence of ADP. The actin binding affinity of the unphosphorylated head may be lower than that of the phosphorylated head, and therefore, the binding of the unphosphorylated head may be interfered easily by an intramolecular strain induced when both heads bind to actin. The decrement of pyrene fluorescence intensity induced by the binding of UPHMM (dd) was also approximately half of that induced by DHPHMM (pp), suggesting that only one of the two heads of UPHMM preferentially binds to actin in the presence of ADP in our experimental condition. Therefore, we think that the slow ADP release rates of SHPHMM and UPHMM, which we expected to observe in our kinetics experiment, were simply unmeasurable under our experimental condition. The lower frequency of the slow actin interaction of SHPMII (8%; Fig. 2C) may indicate the lower affinity of the unphosphorylated head of SHPMII to actin. Note that the property of the unphosphorylated head of UPHMM is probably different from that of SHPHMM, because the faster actomyosin interaction rate of UPMII (12 s–1) did not match the rates observed for SHPMII (Fig. 2C), although we do not know the molecular mechanism causing this difference at this point.
Displacements of Actin Filament—To further examine the mechanical interplays of the smooth muscle myosin species and actin, we analyzed the step size distributions (Fig. 3). Both DHPMII and SHPMII showed positive net displacements, whereas UPMII showed almost zero net displacement, which is consistent with the fact that UPMII did not translocate actin in the in vitro motility assay (Fig. 1C). The large average step sizes of DHPMII and SHPMII are explained by multiples of the unitary step size of ∼5.3 nm as reported previously for skeletal muscle myosin (28). Because two distinct dwell time distributions were evident in SHPMII and UPMII, the step size distributions were further analyzed separately for the shorter dwell times and for the longer (prolonged) dwell times (Fig. 3, B and C). We separated the dwell time distributions at 0.1 s for SHPMII and 0.2 s for UPMII, because over 90% of their shorter dwell time phases were estimated to complete in 0.1 s (SHPMII) and 0.2 s (UPMII) based on their apparent rates of 24.2 s–1 (SHPMII) and 12.3 s–1 (UPMII), respectively. An important finding is that both the shorter and the longer actin interactions of SHPMII had a positive net mechanical displacement, whereas those of UPMII did not, suggesting that the apparently slow actomyosin interaction of SHPMII is the active mechanical one that is qualitatively different from those of UPMII.
FIGURE 3.

Histogram of bead displacement induced by DHPMII, SHPMII, and UPMII. A, the average displacements of DHPMII (pp), SHPMII (pFdH), and UPMII (dd) were 24.8 ± 36.4, 26.4 ± 26.2, and 3.6 ± 20.5 nm, respectively. For SHPMII (B) and UPMII (C), the displacement distributions were analyzed for faster and slower actomyosin interactions. The average displacements of the shorter dwell time component (<0.1 s) and the longer dwell time component (≥0.1 s) of SHPMII were 27.6 ± 25.1 and 22.6 ± 29.2 nm, respectively. The average displacement of the shorter dwell time component (<0.2 s) and the longer dwell time component (≥0.2 s) of UPMII were 3.6 ± 18.8 and 2.8 ± 20.2 nm, respectively. The trapping force of the bead was 0.02 pN/nm. Thus the force required for displacing the bead, e.g. ∼10 nm is just ∼0.2 pN (0.02 pN/nm × 10 nm) that is much smaller than the force exerted by actomyosin strong binding (∼10 pN). Therefore, almost all actomyosin interactions observed in our nanometry experiment should be the results of forward stepping, although we cannot distinguish forward steps from backward steps. The apparently negative displacements are due to the thermal fluctuation of actin filament loosely trapped by the optical beads (0.02 pN/nm). Depending on the position of the first weak association of myosin on the actin filament, the apparent position of the bead after the forward stepping becomes sometimes negative. However, this does not necessarily mean it is due to backward displacement.
Fraction of SHPMII during the Latch State—Although it is not readily feasible to experimentally distinguish SHPMII from UPMII or DHPMII in smooth muscle tissues during the latch state, it is possible to estimate the fractions of these smooth muscle myosin species based on currently available data. Because phosphorylation and dephosphorylation of smooth muscle myosin by MLCK and MLCP have been reported to occur randomly (9, 10), the reaction scheme of phosphorylation and dephosphorylation of smooth muscle myosin in smooth muscles can be simply described as follows,
 |
REACTION 1 |
where kMLCK and kMLCP are the reaction rate constants of phosphorylation by MLCK and dephosphorylation by MLCP, respectively. Based on this reaction scheme, the fractions of UPMII, SHPMII, and DHPMII during the latch state where the total phosphorylation level is 20–30% (11) are estimated to be 56–68, 24–29, and 8–15%, respectively. Because UPMII does not have actin translocating activity, the motor activity of SHPMII is expected to predominantly determine the contractile state of smooth muscles during the latch state.
It is known that in tonic smooth muscles agonist stimulation transiently increases the myoplasmic Ca2+ concentration to 300–500 nm at the peak contraction. After the initial spike, the myoplasmic Ca2+ concentration plummets, but it is maintained at a level higher than the resting state during the latch state (29, 30). MLCP activity is regulated by the Rho/Rho kinase pathway (31, 32), and the activity is down-regulated to ½ to ⅓ after the agonist stimulation (33, 34). By taking this evidence into account, the relative activities of MLCK and MLCP during the smooth muscle contraction were defined as shown in Fig. 4A. Based on this, we performed computer simulation to follow the fractional changes of UPMII, SHPMII, and DHPMII during the tonic smooth muscle contraction (Fig. 4B). As expected, the fraction of DHPMII transiently increased accompanied by the down-regulation of MLCP activity and the transient activation of MLCK caused by the transient increase of the myoplasmic Ca2+ concentration (3–8). During this phase, the fractions of UPMII and SHPMII were kept at a very low level. Shortening of smooth muscles with fast cross-bridge cycling is expected to take place during this phase. The DHPMII level then decreased accompanied by the inactivation of MLCK activity caused by the decrement of the myoplasmic Ca2+ concentration. It is important to note that the fraction of SHPMII increased after the peak [Ca2+]in accompanied by the decrement of the fraction of DHPMII. During the later phase (latch state), the fraction of SHPMII reached ∼26%, whereas that of DHPMII decreased to ∼11%. This gave an overall phosphorylation level of ∼24%, which is consistent with the apparent overall phosphorylation level of 20–30% during the latch state (11). Our result suggests that the population of SHPMII dominates over the population of DHPMII ∼2–3 times during the latch state.
DISCUSSION
Motor Property of SHPMII—Our result implies that the motor activities of the two heads of SHPMII are distinct from each other; the phosphorylated head is as active as the phosphorylated heads of DHPMII, whereas the unphosphorylated head is partially active in terms of actin translocating activity and the ADP release rate. It should be emphasized that the motor property of the unphosphorylated head of SHPMII is completely different from the unphosphorylated head of UPMII, because both the fast and the slow actomyosin interactions of SHPMII showed positive net displacement in contrast to those of UPMII (Fig. 3, B and C). The unique mechanical property of SHPMII is also manifested in its nonuniform actin translocation activity (see supplemental movies). We think that the frequently intermitted actin filament movement is due to the slow sustained actin binding of the unphosphorylated head of SHPMII. This intermitted actin movement was not observed for the mixture of DHPMII and UPMII, suggesting the unique mechanical activity of the dephosphorylated head of SHPMII. Because it has been shown that the interaction between the two heads is critical to stabilize the inhibitory conformation of smooth muscle and nonmuscle type myosin (25, 35), it is possible that the activation of one head partially releases the inhibitory effect on the other head.
The overall ATPase cycle rate of smooth muscle myosin represents the phosphate release rate, which limits the actin-activated ATP hydrolysis cycle. Phosphate release is thought to occur either concomitant with or immediately after the formation of the strongly actin-bound state, and thus this rate determines the rate of formation of the strong actin-bound state (actomyosin-ADP). On the other hand, the ADP release rate, together with the step size, determines the actin translocating velocity under saturating ATP condition. Therefore, if ADP release rate is much faster than the overall ATPase turnover rate, the ATP turnover rate and the actin translocating rate should be separately discussed. In the present study, we also measured the single ATPase turnover rates of DHPHMM, SHPHMM, and UPHMM. The result was very similar to that reported previously by Ellison et al. (17); the ATPase turnover rate of SHPHMM was much less than 50% of that of DHPHMM (data not shown). The result suggests that the actin binding rates of both heads of SHPMII in the myosin-ADP-Pi state are significantly reduced compared with DHPMII. Thus it is anticipated that the slow phosphate release rates contribute to reduce the number of myosin molecule being involved in the actin translocation. This low ATPase turnover rate of SHPMII can explain the low ATP consumption of smooth muscles during the latch state.
Physiological Relevance of the Motor Property of SHPMII to the Latch State—Smooth muscle myosin molecules form side polar filaments and interact with actin to generate large force as a whole. In such a circumstance, if some myosin molecules in the myosin filament interact with actin for prolonged period of time, such slow interactions would interfere with cross-bridge cycling of other myosin molecules (thus reduce the overall cycling rate) while maintaining the force. We propose that the unique mechanical activity of SHPMII explains well the sustained force with low energy consumption of tonic smooth muscle during the latch state.
Consistency with Other Studies—Two independent studies mainly focusing on the ATP turnover rate of SHP have been reported (17, 36). Ellison et al. (17) concluded that the ATP turnover rate of SHP is less than 20% of that of DHP, whereas Rovner et al. (36) concluded that the ATP turnover rate of SHP is more than 50% of that of DHP. The ATP turnover rate of SHPHMM obtained in our single turnover experiment was ∼30% of that of DHPHMM (not shown), which is similar to the results of Ellison et al. The discrepancy may arise from the regulatory light chain used in these studies. Ellison et al. and the present study used the regulatory light chain with intact phosphorylation sites (Thr18 and Ser19), whereas Rovner et al. used a mutant regulatory light chain (T18A/S19A). It is possible that the T18A/S19A mutant does not properly mimic the unphosphorylated state of the regulatory light chain, although apparently it does not show the actin-activated ATPase activity and the motility activity when it is incorporated into the both heads. Another inconsistency among these studies is found in the actin translocating velocity. Although all of the groups found reduction of actin translocating velocity in SHP compared with DHP, the degrees of the reduction are very different from one another: 50–60%(17), 10–20%(36), and 70–80% (this study). It is possible that the variation in the degree of the reduction (20 ∼ 80%) arises from the nonuniform movement of actin filaments by SHP as observed in the present study (supplemental Movie S2).
Supplementary Material
This work was supported, in whole or in part, by National Institutes of Health Grants AR41653 and HL073050. The costs of publication of this article were defrayed in part by the payment of page charges. This article must therefore be hereby marked “advertisement” in accordance with 18 U.S.C. Section 1734 solely to indicate this fact.
The on-line version of this article (available at http://www.jbc.org) contains supplemental Figs. S1–S3, supplemental Tables S1 and S2, supplemental Movies S1–S4, and supplemental text.
Footnotes
The abbreviations used are: RLC, regulatory light chain; SHP, single-head phosphorylated; SHPMII, SHP smooth myosin; DHP, double-head phosphorylated; DHPMII, DHP myosin; UPMII, unphosphorylated myosin; HMM, heavy meromyosin; ATPγS, adenosine 5′-O-(thiotriphosphate); MLCK, myosin light chain kinase; TRITC, tetramethylrhodamine; MLCP, myosin light chain phosphatase.
References
- 1.Hai, C. M., and Murphy, R. A. (1989) Annu. Rev. Physiol. 51 285–298 [DOI] [PubMed] [Google Scholar]
- 2.Dillon, P. F., Aksoy, M. O., Driska, S. P., and Murphy, R. A. (1981) Science 211 495–497 [DOI] [PubMed] [Google Scholar]
- 3.D. J., Hartshorne. (1987) in Physiology of the Gastrointestinal Tract (Johnson, D. R., Ed) 2nd Ed., pp. 423–482, Raven, New York
- 4.Adelstein, R. S., and Sellers, J. R. (1987) Am. J. Cardiol. 59 4B–10B [DOI] [PubMed] [Google Scholar]
- 5.Kamm, K. E., and Stull, J. T. (1989) Annu. Rev. Physiol. 51 299–313 [DOI] [PubMed] [Google Scholar]
- 6.Somlyo, A. P., and Somlyo, A. V. (1994) Nature 372 231–236 [DOI] [PubMed] [Google Scholar]
- 7.Ogut, O., and Brozovich, F. V. (2003) J. Mol. Cell Cardiol. 35 347–355 [DOI] [PubMed] [Google Scholar]
- 8.Somlyo, A. V., Khromov, A. S., Webb, M. R., Ferenczi, M. A., Trentham, D. R., He, Z. H., Sheng, S., Shao, Z., and Somlyo, A. P. (2004) Philos. Trans. R. Soc. Lond. B. Biol. Sci. 359 1921–1930 [DOI] [PMC free article] [PubMed] [Google Scholar]
- 9.Ogawa, Y., and Sato, O. (1998) Adv. Exp. Med. Biol. 453 241–246 [DOI] [PubMed] [Google Scholar]
- 10.Trybus, K. M., and Lowey, S. (1985) J. Biol. Chem. 260 15988–15995 [PubMed] [Google Scholar]
- 11.Berne, R. M. (2004) Physiology, 5th Ed., p. 255, Mosby, St. Louis, MO
- 12.Ikebe, M., and Hartshorne, D. J. (1985) Biochemistry 24 2380–2387 [DOI] [PubMed] [Google Scholar]
- 13.Spudich, J. A., and Watt, S. (1971) J. Biol. Chem. 246 4866–4871 [PubMed] [Google Scholar]
- 14.Ikebe, M., Kambara, T., Stafford, W. F., Sata, M., Katayama, E., and Ikebe, R. (1998) J. Biol. Chem. 273 17702–17707 [DOI] [PubMed] [Google Scholar]
- 15.Komatsu, S., and Ikebe, M. (2007) Mol. Biol. Cell 18 5081–5090 [DOI] [PMC free article] [PubMed] [Google Scholar]
- 16.Komatsu, S., Yano, T., Shibata, M., Tuft, R. A., and Ikebe, M. (2000) J. Biol. Chem. 275 34512–34520 [DOI] [PubMed] [Google Scholar]
- 17.Ellison, P. A., Sellers, J. R., and Cremo, C. R. (2000) J. Biol. Chem. 275 15142–15151 [DOI] [PubMed] [Google Scholar]
- 18.Sata, M., Matsuura, M., and Ikebe, M. (1996) Biochemistry 35 11113–11118 [DOI] [PubMed] [Google Scholar]
- 19.Tanaka, H., Ishijima, A., Honda, M., Saito, K., and Yanagida, T. (1998) Biophys. J. 75 1886–1894 [DOI] [PMC free article] [PubMed] [Google Scholar]
- 20.Tanaka, H., Homma, K., Iwane, A. H., Katayama, E., Ikebe, R., Saito, J., Yanagida, T., and Ikebe, M. (2002) Nature 415 192–195 [DOI] [PubMed] [Google Scholar]
- 21.Ishijima, A., Kojima, H., Funatsu, T., Tokunaga, M., Higuchi, H., Tanaka, H., and Yanagida, T. (1998) Cell 92 161–171 [DOI] [PubMed] [Google Scholar]
- 22.Finer, J. T., Simmons, R. M., and Spudich, J. A. (1994) Nature 368 113–119 [DOI] [PubMed] [Google Scholar]
- 23.Molloy, J. E., Burns, J. E., Kendrick-Jones, J., Tregear, R. T., and White, D. C. (1995) Nature 378 209–212 [DOI] [PubMed] [Google Scholar]
- 24.Cremo, C. R., and Geeves, M. A. (1998) Biochemistry 37 1969–1978 [DOI] [PubMed] [Google Scholar]
- 25.Wendt, T., Taylor, D., Trybus, K. M., and Taylor, K. (2001) Proc. Natl. Acad. Sci. U. S. A. 98 4361–4366 [DOI] [PMC free article] [PubMed] [Google Scholar]
- 26.Berger, C. E., Fagnant, P. M., Heizmann, S., Trybus, K. M., and Geeves, M. A. (2001) J. Biol. Chem. 276 23240–23245 [DOI] [PubMed] [Google Scholar]
- 27.Ellison, P. A., DePew, Z. S., and Cremo, C. R. (2003) J. Biol. Chem. 278 4410–4415 [DOI] [PubMed] [Google Scholar]
- 28.Kitamura, K., Tokunaga, M., Iwane, A. H., and Yanagida, T. (1999) Nature 397 129–134 [DOI] [PubMed] [Google Scholar]
- 29.Somlyo, A. P., and Himpens, B. (1989) FASEB J. 3 2266–2276 [DOI] [PubMed] [Google Scholar]
- 30.Moore, E. D., Becker, P. L., Itoh, T., and Fay, F. S. (1991) Adv. Exp. Med. Biol. 304 171–183 [DOI] [PubMed] [Google Scholar]
- 31.Kitazawa, T., Gaylinn, B. D., Denney, G. H., and Somlyo, A. P. (1991) J. Biol. Chem. 266 1708–1715 [PubMed] [Google Scholar]
- 32.Kitazawa, T., and Somlyo, A. P. (1991) Adv. Exp. Med. Biol. 304 97–109 [DOI] [PubMed] [Google Scholar]
- 33.Kitazawa, T., Masuo, M., and Somlyo, A. P. (1991) Proc. Natl. Acad. Sci. U. S. A. 88 9307–9310 [DOI] [PMC free article] [PubMed] [Google Scholar]
- 34.Nakamura, K., Koga, Y., Sakai, H., Homma, K., and Ikebe, M. (2007) Circ. Res. 101 712–722 [DOI] [PubMed] [Google Scholar]
- 35.Wendt, T., Taylor, D., Messier, T., Trybus, K. M., and Taylor, K. A. (1999) J. Cell Biol. 147 1385–1390 [DOI] [PMC free article] [PubMed] [Google Scholar]
- 36.Rovner, A. S., Fagnant, P. M., and Trybus, K. M. (2006) Biochemistry 45 5280–5289 [DOI] [PMC free article] [PubMed] [Google Scholar]
Associated Data
This section collects any data citations, data availability statements, or supplementary materials included in this article.