

Abstract
In this study, Bax inhibitor-1 (BI-1) overexpression reduces the ER pool of Ca2+ released by thapsigargin. Cells overexpressing BI-1 also showed lower intracellular Ca2+ release induced by the Ca2+ ionophore ionomycin as well as agonists of ryanodine receptors and inositol trisphosphate receptors. In contrast, cells expressing carboxyl-terminal deleted BI-1 (CΔ-BI-1 cells) displayed normal intracellular Ca2+ mobilization. Basal Ca2+ release rates from the ER were higher in BI-1-overexpressing cells than in control or CΔ-BI-1 cells. We determined that the carboxyl-terminal cytosolic region of BI-1 contains a lysine-rich motif (EKDKKKEKK) resembling the pH-sensing domains of ion channels. Acidic conditions triggered more extensive Ca2+ release from ER microsomes from BI-1-overexpressing cells and BI-1-reconsituted liposomes. Acidic conditions also induced BI-1 protein oligomerization. Interestingly subjecting BI-1-overexpressing cells to acidic conditions induced more Bax recruitment to mitochondria, more cytochrome c release from mitochondria, and more cell death. These findings suggest that BI-1 increases Ca2+ leak rates from the ER through a mechanism that is dependent on pH and on the carboxyl-terminal cytosolic region of the BI-1 protein. The findings also reveal a cell death-promoting phenotype for BI-1 that is manifested under low pH conditions.
The endoplasmic reticulum (ER)3 contains the largest calcium reserve in the cell (1, 2). Agonist-induced ER calcium release occurs through Ca2+ channels such as inositol trisphosphate (IP3) and ryanodine receptors (3). Calcium uptake into the ER occurs when the calcium release channels are closed (i.e. negative feedback to the IP3 receptor) (4) and is performed by sarcoplasmic reticulum/ER-associated calcium-activated ATPase pumps (5). In the resting state, the Ca2+ content of the ER reflects a balance between active uptake by sarcoplasmic reticulum/ER-associated calcium-activated ATPase and passive efflux or basal leakage through other Ca2+ channels. This leakage is revealed when sarcoplasmic reticulum/ER-associated calcium-activated ATPase pumps are inhibited by agents such as thapsigargin (6), causing Ca2+ to leak out of the ER into the cytosol.
The Bax inhibitor-1 (BI-1) (also known as “testis enhanced gene transcript” (TEGT)) is an antiapoptotic protein capable of inhibiting Bax activation and translocation to mitochondria (7). This ubiquitously expressed protein contains several transmembrane domains and localizes to the ER. The homology of BI-1 sequences among species is striking, and the characteristic hydrophobicity and ER membrane localization are evolutionarily conserved (8). BI-1 affects calcium leakage from the ER as measured with Ca2+-sensitive, ER-targeted fluorescent proteins and Ca2+-sensitive dyes (9). However, the mechanism by which BI-1 regulates ER Ca2+ fluxes remains unclear. Here we have provided additional evidence that BI-1 induces passive Ca2+ leakage from the ER and also show that BI-1 activity is regulated by pH in a manner dependent on the carboxyl-terminal cytosolic domain of this protein.
MATERIALS AND METHODS
Cell Lines and Cell Culture—Human fibrosarcoma cells (HT1080), stably transfected with pcDNA3, pcDNA3-BI-1, or pcDNA3-BI-1ΔC, have been described previously (9). Human cervical carcinoma cells (HeLa) expressing BI-1 under a tetracycline-inducible promoter have been described previously (10). Cells were maintained in Dulbecco's modified Eagle's medium containing 10% fetal bovine serum, 1 mm l-glutamine, and antibiotics. When investigating the effect of intracellular acidification, the cells were cultured in the presence of the K+ ionophore nigericin (5 μm) in medium buffered to a pH ranging from 8.0 to 5.0. Nigericin-containing media were supplemented with 140 mm K+, which facilitates pH equilibration (11, 12).
Measurement of Intracellular Ca2+—The fluorescent calcium indicator Fura-2/AM (1-[2-(5-carboxyoxazol-2-yl)-6-aminobenzoFURAn-5-oxy]-2-(2-amino-5-methylphenoxy)-ethane-N,N,N′,N′-tetraacetic acid pentaacetoxymethyl ester; Molecular Probes, Eugene, OR) was used to measure changes in intracellular (cytosolic) free Ca2+. Cells were plated onto glass-bottomed perfusion chambers that were mounted on the stage of an inverted microscope (Nikon Eclipse TE2000) and incubated with Fura-2/AM (6 μm) for 30 min at room temperature in Hanks' balanced salt solution. After loading, cells were washed three times in isotonic buffer without Ca2+ (KH buffer: 132 mm NaCl, 5 mm KCl, 10 mm dextrose, 10 mm HEPES, and 1.05 mm MgCl2). Cells were then promptly treated with various agents, including thapsigargin, ionomycin, ryanodine, histamine, and ATP. Changes in [Ca2+]i were determined as a ratio of 340/380-nm excitation (512-nm emission) using an integrated spectrofluorometer (Photon Technology International, Birmingham, NJ). Ca2+ concentrations were calculated using the equation [Ca2+]i = Kd(F380 max/F380 min) (R - Rmin)/(Rmax - R); a Kd value of 229 nm was assumed for the binding of calcium to Fura-2/AM. Rmax and Rmin were determined in each experimental group by the consecutive addition of 30 μm digitonin (Rmax) and 50 mm EGTA (Rmin). When investigating the effect of intracellular acidification, cells were incubated with the proton ionophore nigericin (5 μm) in a pH ranging from 7.4 to 5.4 (5 μm nigericin-containing modified KH buffer: 140 mm KCl, 5 mm NaCl, 10 mm dextrose, 10 mm HEPES, and 1.05 mm MgCl2) to facilitate pH equilibration between the intra- and extracellular environment (11, 12).
Subcellular Fractionation—To obtain microsome preparations, all procedures were performed at 4 °C using cold reagents. Cells were washed and homogenized using 20–30 strokes of a motor-driven glass-Teflon homogenizer at 4 °C in an ice-cold, pH 7.4 solution containing 250 mm sucrose, 10 mm HEPES, 10 mm KCl, 1.5 mm MgCl2, 1.0 mm EGTA, 1.0 mm dithiothreitol, and 1× protease inhibitor complex (Roche Applied Science). Homogenates were centrifuged at 1600 × g for 10 min to remove the nuclear fraction. The supernatant was then centrifuged at 10,000 × g for 10 min to pellet the mitochondria. The resulting supernatant was then centrifuged at 100,000 × g for 60 min to yield the ER-enriched microsomal pellet. Microsomes were used immediately for experiments.
To monitor cytosolic-mitochondrial translocation of proteins, neomycin control vector (Neo)- or BI-1-overexpressing cells were exposed to normal or acidic pH (5.0, 5.4, 6.0, 6.4, and 7; acidic medium: 15 mm HEPES in Dulbecco's modified Eagle's medium without bicarbonate) for 24 h. The cells were washed with phosphate-buffered saline, resuspended in an isotonic mitochondrial buffer (210 mm sucrose, 70 mm mannitol, 1 mm EDTA, and 10 mm HEPES, pH 7.4), and broken by six passages through a 25-gauge needle fitted to a syringe. Unbroken cells and nuclei were removed by centrifugation at 700 × g for 10 min at 4 °C. The resulting supernatant was further centrifuged at 10,000 × g for 30 min at 4 °C to collect the heavy membrane fraction in which mitochondria are enriched. The resulting supernatant was used as a cytosolic fraction, and the heavy membrane pellet was resuspended in 50 μl of the same mitochondrial buffer and used as a mitochondrial fraction.
Measurement of ER Ca2+—For measurements of [Ca2+]ER, we used the low affinity fluorescent Ca2+ dye mag-Fura-2/AM. Intracellular-like medium (ICM) for ER Ca2+ loading contained 120 mm KCl, 20 mm NaCl, 2.0 mm MgSO4, 10 mm HEPES, pH 7.2, 3.0 mm ATP, 1.0 mm EGTA, 2.0 mm CaCl2, 10 mm Mg-ATP, and 1.0 mm dithiothreitol. ICM also contained 5 mm creatine phosphate and 20 units/ml creatine phosphokinase. The isolated ER-enriched microsomal fractions were loaded with Ca2+ in ICM for 60 min at 37 °C. During the last 20 min of ER Ca2+ loading, 8 μm mag-Fura-2/AM was added to the ICM loading solution. After mag-Fura-2 loading, the ER fractions were briefly washed with ICM. The fluorescence system (Photon Technology International) was based on a Nikon Diaphot inverted microscope. Mag-Fura-2 was excited (340 and 380 nm) at 1 Hz; fluorescence emission at 495 nm was captured using a 200× objective and a photomultiplier tube and then was digitized, displayed, and stored on a computer. The resulting changes in the 340/380 nm ratios were used as an indication of changes in [Ca2+]. The Kd of mag-Fura-2 is 54 μm. Under the described experimental conditions, changes of the ratio R = F340/F380 reflect changes in [Ca2+]ER.
Immunoblotting—For immunoblot analysis, cells were lysed in 1% Nonidet P-40, 50 mm HEPES, pH 7.5, 100 mm NaCl, 2 mm EDTA, 1 mm pyrophosphate, 10 mm sodium orthovanadate, 1 mm phenylmethylsulfonyl fluoride, and 100 mm sodium fluoride. Lysates were normalized for total protein content with a BCA kit (Pierce), and 40–50-μg aliquots were suspended in an equal volume of 2× Laemmli buffer containing 2-mercaptoethanol and then boiled for 5 min before performing SDS-PAGE or loaded directly without boiling when analyzing BI-1 protein. Proteins were transferred to Immobilon-P membranes (Millipore, Billerica, MA), blocked with skim milk (5%), and incubated with various primary antibodies recognizing hemagglutinin (HA) or actin (Santa Cruz Biotechnology, Inc., Santa Cruz, CA). Antibody detection was accomplished via horseradish peroxidase-conjugated protein A or goat anti-rabbit immunoglobulin G (Bio-Rad), a chemiluminescent substrate (Amersham Biosciences), and exposure to x-ray film (Eastman Kodak Co.).
Expression and Purification of Recombinant His-BI-1 Protein—Bacterial cultures of pRSET-BI-1 were grown at 37 °C in 500 ml of LB with 50 μg/ml ampicillin until the A600 reached 0.5. Isopropyl 1-thio-β-d-galactopyranoside (0.5 mm) was added to induce the recombinant protein followed by further incubation for 4 h. To purify recombinant His-BI-1 proteins, harvested bacterial pellets were resuspended in binding buffer (20 mm Tris-HCl, pH 8.0, 500 mm NaCl, 5 mm imidazole, 1 mm phenylmethylsulfonyl fluoride, and 5 μg/ml benzamidine, leupeptin, and pepstatin). The cells were lysed by passing through an Amicon French pressure cell. Cell lysates were applied to a nickel-nitrilotriacetic acid-agarose column pre-equilibrated with binding buffer. The column was washed with binding buffer and washing buffer (20 mm Tris-HCl, pH 8.0, 500 mm NaCl, and 60 mm imidazole). The recombinant proteins were eluted in binding buffer containing 250 mm imidazole. The recombinant protein concentrations were quantified with bicinchoninic acid according to the manufacturer's instructions (Pierce).
Reconstitution of Purified His-BI-1 into Proteoliposomes— Phosphatidylcholine (from bovine brain), phosphatidylethanolamine (from bovine brain), and phosphatidylserine (from bovine brain) dissolved in chloroform were mixed at molar ratios of 50, 30, and 20%, respectively. The final lipid concentration was 5 mm in a total volume of 1 ml. The solvent was evaporated under a stream of argon gas, and the residual chloroform was removed by speed vacuuming. The dry lipids were hydrated in buffer A (20 mm HEPES, pH 7.5, 100 mm NaCl, 0.1 mm dithiothreitol, 1 mm CaCl2, and 1% CHAPS) containing ∼20 μg/ml His-BI-1. The mixtures were dialyzed for 72 h against an excess volume of buffer B (buffer A without CHAPS). The resulting proteoliposomes were pelleted by centrifugation at 100,000 × g for 30 min at 4 °C, washed with buffer C (20 mm HEPES, pH 7.5, 100 mm NaCl, 0.1 mm dithiothreitol, and 1 m KCl), and then dialyzed against buffer D (buffer C without 1 mm KCl) for 24 h at 4 °C. The resulting proteoliposomes were passed through Chelex 100 to remove free Ca2+. The formation of proteoliposomes was monitored by measurement of light scattering during dialysis with a spectrofluorometer (excitation and emission wavelength of 450 nm). The amounts of reconstituted BI-1 protein were determined using the NanoOrange® Protein Quantitation kit (Molecular Probes). After reconstitution, the ratio of phospholipid concentration (w/v) to protein was 830 ± 48 in reaction samples.
Bax Inhibitor-1 Antibody—A BI-1 peptide (CAMNEKDKKKEKK, in single letter code) corresponding to the carboxyl terminus of BI-1 was synthesized with an additional amino-terminal cysteine. In rats, a polyclonal antibody was raised against this peptide coupled to keyhole limpet hemocyanin, and the antibody was purified by affinity chromatography on the immobilized peptide as described previously (13).
pH Decrease-induced Ca2+ Release Measurement Using Indo-1 Fluorescence—Ca2+ efflux from proteoliposomes was observed by measuring the changes in the fluorescence of external indo-1, a fluorescent Ca2+ indicator, after rapid dilution of the proteoliposomes with acidic solutions (50 mm sodium phosphate, pH 6.5, and 50 mm sodium citrate, pH 6.0, 5.5, and 5.0) in a ratio of 1:20 (v/v). Fluorometric measurements were performed at 30 °C using a Shimadzu RF-5301 PC spectrofluorometer. The fluorescence intensity was measured at an emission wavelength of 393 nm with an excitation wavelength of 355 nm. The fluorescence intensity of 10 μm indo-1 was calibrated to free Ca2+ concentration using a Ca2+-EGTA buffering system. To quantify the amount of Ca2+ released from proteoliposomes by hydrogen ions, the fluorescence intensity of indo-1 after rapidly mixing the proteoliposomes with buffer was compared with the fluorescence intensity after addition of Triton X-100 (1% (v/v) final concentration).
To examine the functional role of the carboxyl terminus of BI-1 in Ca2+ efflux, the anti-BI-1 antibody was mixed with reaction samples at a ratio of 1 μg of reconstituted BI-1 to 10, 20, or 40 μg of antibody. After preincubating the sample at 30 °C for 15 min, Ca2+ release was measured using the same method described above. As a control, all experiments were repeated using liposomes without reconstituted BI-1 protein under the same conditions.
Hydrogen Ion-mediated Release of Ca2+ from Proteoliposomes Using 45Ca2+—The proteoliposomes were prepared in the presence of 45Ca2+ to include ∼20,000 cpm 45Ca2+ in buffer D. To remove residual Ca2+ bound to the vesicle surface, the sample was applied to a Sephadex G25 column equilibrated with buffer D, and the liposomes were pelleted by centrifugation (100,000 × g for 30 min at 4 °C). Each pellet was then redissolved and dialyzed against an excess volume of buffer D for 12 h at 4 °C. The proteoliposomes were rapidly mixed with pH buffer solutions and incubated for 20 min at 30 °C. The samples were diluted with buffer E (buffer D plus 1.5 m KCl), and the liposomes were pelleted by centrifugation (100,000 × g for 30 min at 30 °C). The pellet was then dissolved in 1% (v/v) Triton X-100, and the radioactivity of each fraction (pellet and supernatant) was determined by scintillation counting.
Analysis of BI-1 Oligomerization—Endoplasmic reticulum were isolated from Neo-, BI-1-, and CΔ-BI-1-overexpressing cells. ER pellets were resuspended in buffer B containing 250 mm sucrose, 10 mm HEPES-NaOH, pH 7.5, 2 mm KH2PO4, 5 mm sodium succinate, and 25 μm EGTA and then treated with or without acidic pH (5.0, 6.0, 7.0, or 7.4) for 30 min at 30 °C. The ER pellets were harvested by centrifugation and then analyzed by immunoblotting using an anti-HA antibody.
Analysis of Mitochondrial Ca2+—Cells were allowed to adhere to glass coverslips and incubated with 5% CO2 at 37 °C. All Ca2+ imaging experiments were performed using an inverted epifluorescence Nikon microscope and a digital imaging system consisting of a TILL polychrome IV monochromator illumination system, a Sensicam 12-bit charge-coupled device camera, and TILL VisION acquisition and analysis software as described previously (11). Mitochondrial Ca2+ uptake was confirmed by dual loading cells with MitoTracker Green FM and Rhod-2-TRITC. Cells were excited with light at 488 ± 15 (10 ms) and 550 ± 25 nm (50 ms), and the emitted fluorescence from both dyes was collected through a fluorescein isothiocyanate/TRITC dual emission dichroic beam splitter and band pass filter (520 ± 15 and 600 ± 25 nm; Chroma). All experiments were performed at 37 °C with 5% CO2.
Statistical Analyses—Results are presented as mean ± S.E. of n cells, and paired and unpaired Student's t tests were applied to test and control conditions where appropriate. Microcal Origin software (Northampton, MA) was used for statistical calculations.
RESULTS
BI-1 Reduces ER Pools of Releasable Ca2+—Thapsigargin, an irreversible inhibitor of the sarcoplasmic reticulum/ER-associated calcium-activated ATPase, unmasks basal release of Ca2+ from ER pools by blocking Ca2+ uptake into the ER. Thus, thapsigargin treatment causes Ca2+ to leak from the ER into the cytosol, an event measurable with cytosolic Ca2+-sensitive dyes such as Fura-2/AM in cells cultured in Ca2+-free medium. For studies of BI-1, we used human HT1080 cells stably transfected with plasmids encoding full-length BI-1 protein (BI-1 cells) or truncated BI-1 protein lacking the carboxyl-terminal cytosolic domain (residues 229–237) (CΔ-BI-1 cells) or with empty plasmid (Neo). Immunoblot analysis confirmed expression of the BI-1 and CΔ-BI-1 proteins (Fig. 1A). Addition of thapsigargin to Neo control cells cultured in Ca2+-free medium led to a time-dependent increase in cytosolic free Ca2+ concentration ([Ca2+]i) (Fig. 1, B and C). We used a relatively high concentration of Fura-2/AM (6 μm) that was appropriate for the integrated spectrofluorometer approach. However, 1–2 μm Fura-2/AM produced similar results (data not shown). By comparison, far less Ca2+ release into the cytosol was observed in BI-1 cells (Fig. 1, B and C). In contrast, thapsigargin-inducible Ca2+ release was not significantly different in CΔ-BI-1 cells compared with Neo control cells. The ability of BI-1 overexpression to reduce intracellular pools of thapsigargin-inducible Ca2+ was also confirmed using HeLa cells conditionally expressing BI-1 under a tetracycline-dependent promoter system. Tetracycline treatment increased BI-1 protein expression (Fig. 2A), which reduced thapsigargin-induced release of Ca2+ from intracellular stores (Fig. 2B), independently confirming that BI-1 overexpression regulates ER Ca2+.
FIGURE 1.
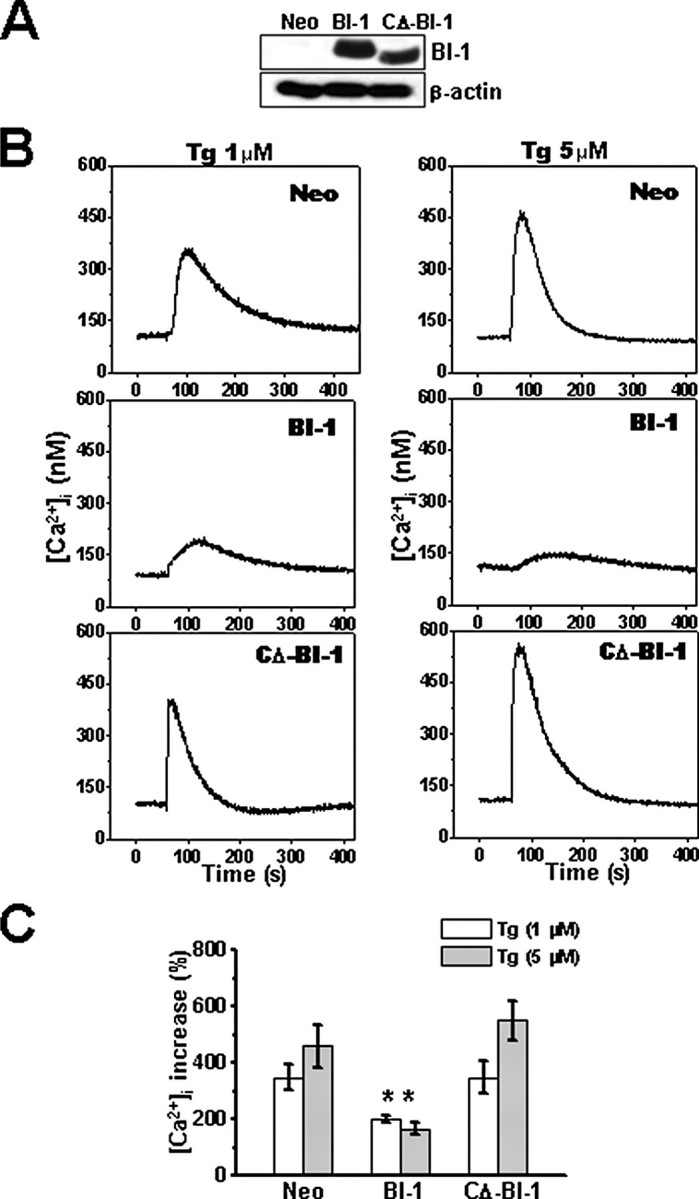
Internal stores of thapsigargin-releasable Ca2+ are reduced in BI-1 stable transfectants. A, expression of BI-1-HA tagged protein in HT1080-Neo, -BI-1, and -CΔ-BI-1 cells was compared by immunoblotting using an anti-HA antibody (upper panel). Lysates were normalized for total protein content (20 μg/lane). Blots were reprobed with anti-β-actin antibody to confirm equivalent loading (lower panel). B, HT1080-Neo, -BI-1, and -CΔ-BI-1 cells were loaded with Fura-2/AM, cultured in Ca2+-free medium, and incubated with 1 μm (left) or 5 μm (right) thapsigargin (Tg) at 1 min. Individual cells were imaged (n = 16), and average fluorescence intensity was recorded over time. C, the peak of Ca2+ release obtained in B was quantified and expressed as a percentage of the increase above base line prior to thapsigargin treatment (mean ± S.E. of four independent experiments). *, p < 0.05 by unpaired t test versus the percentage of increased cytoplasmic Ca2+ in the indicated concentration of thapsigargin in Neo cells.
FIGURE 2.

Internal stores of thapsigargin-releasable Ca2+ are modulated by BI-1 in cells with conditional expression. A, HeLa-Tet-On-BI-1 cells were incubated with 1 μm doxycycline for 6, 12, 18, 24, or 36 h, and the expression of BI-1-HA tagged protein (top panel) was analyzed by immunoblotting using lysates normalized for total protein content (20 μg/lane). The blot was reprobed with anti-β-actin antibody (bottom panel). B, HeLa-Tet-On-BI-1-transfected cells were incubated with or without 1 μm doxycycline for 12 h, and then cells were loaded with Fura-2/AM, cultured in Ca2+-free medium, and incubated with 1 μm thapsigargin (Tg) (arrow). Individual cells were imaged (n = 16). A representative tracing is provided showing Ca2+ release over time. C, the peak of Ca2+ release obtained in B was quantified, and data are expressed as a percentage of the increase over base line prior to thapsigargin treatment (mean ± S.E. of four independent experiments). *, p < 0.05 by paired t test versus Neo cells.
The reduced entry of Ca2+ into the cytosol following thapsigargin treatment suggests that intracellular pools of Ca2+ are lower in BI-1-overexpressing cells. To confirm this hypothesis, we cultured HT1080 cells in Ca2+-free medium and then treated them with a 5 μg/ml concentration of the detergent digitonin (digitonin at 5 μg/ml did not cause any leakage of Fura-2 florescence; data not shown) and the Ca2+ ionophore ionomycin. Digitonin can permeabilize the cell membranes to small molecules such as Ca2+ (14, 15) and allows indirect measurement of intra-ER calcium with ionomycin. In BI-1-expressing cells, maximal [Ca2+]i induced by ionomycin was approximately half the levels of control cells (p < 0.05 by unpaired t test). (Fig. 3A), but release was not significantly different in CΔ-BI-1 cells (Fig. 3A). We also compared releasable ER Ca2+ pools in Neo control, BI-1, and CΔ-BI-1 cells using the ryanodine receptor agonist 4-chloro-m-cresol, again observing less Ca2+ release into cytosol in BI-1-overexpressing cells (Fig. 3B). Finally treatment with histamine and ATP, agonists of G-protein-coupled receptors that induce production of IP3 second messenger, an activator of IP3-gated ER Ca2+ channels (16), showed reduced release of the IP3-releasable pool of Ca2+ from BI-1-overexpressing cells (Fig. 3, C and D). Thus, total, ryanodine receptor-gated, and IP3R-gated pools of releasable ER Ca2+ appear to be reduced in BI-1-overexpressing cells, although the expression of ryanodine receptor and IP3R was not affected in the BI-1 cells (supplemental Fig. S1).
FIGURE 3.

Total and ryanodine receptor- and IP3R-releasable intracellular pools of Ca2+ are lower in BI-1-overexpressing cells. HT1080-Neo, -BI-1, and -CΔ-BI-1 cells were cultured in Ca2+-free medium and stimulated with 0.1 μm ionomycin following pretreatment with 5 μg/ml digitonin (A) or with 300 μm 4-chloro-m-cresol (4-CMC) (B), 1 mm ATP (C), or 100 μm histamine (D). Individual cells were imaged (n = 20), fluorescence intensity was recorded, and the peak of the Ca2+ release was quantified as a percentage of the increase above base line prior to stimulation (*, p < 0.05 by unpaired t test versus Neo cells).
BI-1 Increases Ca2+ Permeability of the ER—To study the effects of BI-1 on Ca2+ permeability of the ER membrane, we analyzed the kinetics of thapsigargin-induced Ca2+ store depletion. Ionomycin was added after thapsigargin treatment to determine how much Ca2+ remained in the ER by measuring cytosolic [Ca2+]i in Fura-2/AM-loaded cells. As expected, the total amount of Ca2+ released in response to thapsigargin and ionomycin was decreased in BI-1-expressing cells compared with untransfected, Neo control-transfected, and CΔ-BI-1-expressing cells (Fig. 4A) consistent with our data and prior reports that used ER-targeted Ca2+-sensitive fluorescent proteins to estimate ER free Ca2+ concentrations (9). More importantly, by adding ionomycin at various times after thapsigargin treatment, we deduced that the kinetics of Ca2+ release was markedly accelerated in BI-1-expressing cells (Fig. 4, A and B). For example, at 1 min after thapsigargin addition, 33 ± 3.86% of the total Ca2+ was released in BI-1-expressing cells, whereas only 11 ± 2.02% was released in Neo control cells. A monoexponential fit to the data from Fig. 4B revealed that the permeability kinetics of thapsigargin-induced Ca2+ release in BI-1-expressing cells was much faster than that in Neo control cells, suggesting that BI-1 expression increases the Ca2+ permeability of the ER membrane.
FIGURE 4.

BI-1 increases the Ca2+ permeability of ER membranes. Thapsigargin (100 nm) was added at 1 min, and ionomycin (10 μm) was added either concomitantly with thapsigargin or at later time points (1–5 min at 1-min intervals). A, typical experiments showing initial peak calcium ([Ca2+]c) elevations in Neo- and BI-1-expressing cells; four traces with ionomycin addition at different times are superimposed to facilitate comparison. B, ionomycin-releasable Ca2+ (expressed as a percentage of the initial peak [Ca2+]c) is plotted as a function of time after thapsigargin addition in untransfected, Neo-, BI-1-, and CΔ-BI-1-transfected cells. Results shown in B represent the mean ± S.E. of four independent experiments (*, p < 0.05 compared with the amount of [Ca2+]c at 0 min). Tg, thapsigargin; Iono, ionomycin; UT, untransfected.
BI-1-mediated Regulation of ER Ca2+ Is pH-dependent—We found that the carboxyl-terminal domain of BI-1 is critical for regulating ER Ca2+. A sequence in the carboxyl-terminal domain of BI-1 (EKDKKKEKK) is similar to the RKKEE cluster found in the mechanosensitive channel (MscL) that mediates gating of this ion channel in a pH-dependent manner (17). We hypothesized therefore that BI-1 may act as a pH-sensitive regulator of ER Ca2+ channel activity. To test this hypothesis, microsomes were isolated from HT1080 cells stably transfected with neomycin control vector (Neo) or plasmids encoding BI-1 or CΔ-BI-1. The ER-rich microsomes from BI-1 and CΔ-BI-1 cells were loaded with the Ca2+-sensitive fluorescent dye mag-Fura-2 to compare intralumenal Ca2+ concentrations before and after treatment under acidic conditions. When microsomes were exposed to pH 5.4, a marked decrease in mag-Fura-2 fluorescence was observed in microsomes derived from BI-1-overexpressing cells, but there was little change in ER Ca2+ concentrations in microsomes from control or CΔ-BI-1-expressing cells exposed to pH 5.4 (Fig. 5, A and B).
FIGURE 5.

pH differentially regulates microsomal Ca2+ when BI-1 is overexpressed. A, mag-Fura-2/AM-loaded microsomal fractions were isolated from untransfected, Neo-, BI-1-, and CΔ-BI-1-transfected cells and treated with acidic condition (pH 5.4) at the time indicated. B, the decrease in microsomal Ca2+ induced by acidic pH in A was expressed as a percentage of the maximum releasable Ca2+. C, Fura-2/AM-loaded cells were treated with nigericin (5 μm) in Ca2+-free extracellular medium (pH 6.4), and the increase of [Ca2+]c was measured. Results shown in B and C represent the mean ± S.E. of four independent experiments (*, p < 0.05 compared with Neo cells). UT, untransfected; cyto, cytosolic.
To determine whether acidification of the cytosol similarly induces increased Ca2+ efflux from the ER in intact cells, HT1080-Neo, -BI-1, and -CΔ-BI-1 cells were treated with Ca2+-free buffer with nigericin (5 μm) and high potassium (140 mm K+) adjusted to pH 6.4, and Ca2+ entry into the cytosol was measured in Fura-2/AM-loaded cells. Nigericin allows extracellular protons into the intracellular environment through the K+/H+ exchanger, leading to intra/extra-pH equilibrium (11, 12, 18). BI-1-overexpressing cells showed markedly increased release of intracellular Ca2+ in response to acidic pH compared with Neo control and CΔ-BI-1 cells (Fig. 5C). To independently confirm the pH-regulated Ca2+ transport effects of BI-1, we compared pH-induced release of Ca2+ into the cytosol in tetracycline-inducible, BI-1-transfected HeLa cells before and after induction using Fura-2/AM-loaded cells cultured in Ca2+-free medium (supplemental Fig. S2). Using this conditional system, we also observed a markedly increased release of Ca2+ from the ER in response to acidic conditions. These results suggest that a large Ca2+ spike under acidic pH is a common characteristic of BI-1. We next measured Ca2+ efflux from proteoliposomes in reconstituted BI-1-encapsulated artificial membranes. The emission of indo-1, a fluorescent Ca2+ indicator, increased because of the rapid mixing of the proteoliposomes with recombinant BI-1 and acidic solutions, suggesting that internalized Ca2+ was released (Fig. 6A). Changes in fluorescence were strictly dependent on the acidity of the reaction buffers (more acidity induced more Ca2+ release) and reached a plateau after about 60 s regardless of acidity. No further increase in the fluorescence emission was observed by lowering the acidity to pH 5.0 (data not shown). When compared with the fluorescence increase upon lysis of the proteoliposome with Triton X-100, ∼90% of internalized Ca2+ was released by acidity treatment at pH 5.0 (Fig. 6B). Addition of a BI-1 antibody at a ratio of 1 μg of reconstituted BI-1 to 10 μg of BI-1 antibody inhibited ∼55% of the acidity-induced Ca2+ release at pH 5.0 (Fig. 6B). Addition of more BI-1 antibody at a ratio of up to 1:40 (w/w) did not further inhibit the Ca2+ release. To assess the hydrogen ion-induced release of Ca2+ through reconstituted BI-1, we repeated the same experiment using encapsulated 45Ca2+. The amount of Ca2+ released by acidic solution and the degree of immunoinhibition by BI-1 antibody were similar to the results obtained using the fluorescent probe (Fig. 6C). Therefore, this result directly confirms the function of BI-1 as a Ca2+ channel in vitro. Moreover the present in vitro observations match results obtained with microsomal fractions of cultured cells (Fig. 5, A and B).
FIGURE 6.

Acidic pH induces Ca2+ release from BI-1-reconstituted lipid vesicles. A, changes in fluorescence were recorded kinetically after the dilution of proteoliposomes into acidic solution (pH 6.5, 6.0, 5.5, and 5.0). B, the amount of Ca2+ released in acidic pH is expressed as a percentage of the maximum releasable Ca2+. The acidic pH-induced changes in fluorescence were compared with those changes caused by 1% Triton X-100 (this intensity was set as 100%). Gray bars indicate the amount of Ca2+ released in the presence of anti-BI-1 antibody at a ratio of 1 μg of reconstituted BI-1 to 10, 20, or 40 μg of antibody after mixing the proteoliposomes with pH 5.0 buffer for 15 min at 30 °C. Hatched bars represent the amount of Ca2+ released in the absence of reconstituted BI-1 protein. C, the proteoliposomes were incubated with each of the indicated acid solutions, and the radioactivities of released 45Ca2+ were measured as described under “Materials and Methods.” Gray and hatched bars indicate the amount of Ca2+ efflux in the presence of anti-BI-1 antibody and in the absence of reconstituted BI-1 protein, respectively. Data shown are the mean ± S.E. of three independent experiments. F.I., fluorescence intensity; TX-100, Triton X-100.
BI-1 Forms Oligomers, and BI-1 Oligomerization Is Enhanced by Acidic Conditions—We previously noted that the BI-1 protein (calculated molecular mass, 26 daltons) displays anomalous mobility when analyzed by SDS-PAGE that we attributed to the extreme hydrophobicity of the protein (19). However, dimers and apparent oligomers of BI-1 are sometimes observed after gel electrophoresis. To explore this phenomenon further, we used transfection of HEK293T cells to express 3×HA-tagged BI-1 protein, which has a predicted molecular mass of ∼26 kDa, and prepared microsomal membranes that were exposed to various pH conditions. At neutral pH, we observed a series of bands at ∼50, ∼75, and ∼100 kDa with immunoblot analysis consistent with the formation of di-, tri-, or tetrameric forms of BI-1 (Fig. 7A). The cross-linking agent enhanced oligomerization (data not shown). CΔ-BI-1 protein also formed multimers although perhaps less efficiently than full-length BI-1 protein. Interestingly acidic conditions increased the multimerization of BI-1 (Fig. 7B). In these data, the film exposure time was short to show the difference of oligomerization in neutral and acidic conditions. Hence a decrease in pH may act as a switch to induce oligomerization of BI-1 and the subsequent release of Ca2+ from the ER.
FIGURE 7.
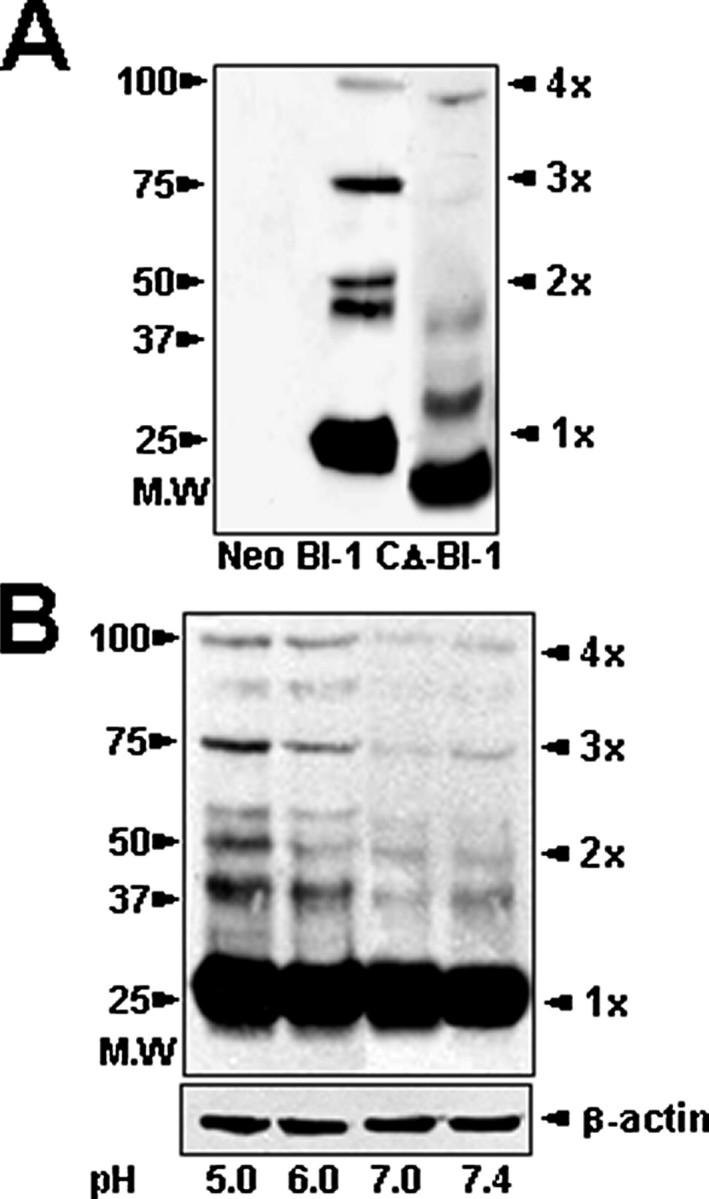
BI-1 forms oligomers, and BI-1 oligomerization is enhanced by acidic conditions. A, Neo-, BI-1-, or CΔ-BI-1-expressing cells were fractionated to collect membrane-bound organelle fractions. Proteins were resolved by gel electrophoresis under non-reducing conditions followed by immunoblot analysis with anti-HA antibody. B, microsomal fractions were isolated from BI-1-expressing cells, and then the fractions were exposed to different pH conditions (pH 5.0, 6.0, 7.0, or 7.4) followed by gel electrophoresis under non-reducing conditions for immunoblot analysis with anti-HA antibody. Results shown in B represent the mean ± S.E. of seven independent experiments.
BI-1 Induces Increased Ca2+ Accumulation in Mitochondria following Acid Stress—Because overexpression of BI-1 increases Ca2+ release from the ER under acidic conditions, we surmised that Ca2+ would likely accumulate in mitochondria to a greater extent in cells overexpressing BI-1 than in control cells under acidic stress. To test this hypothesis, we loaded HT1080-Neo and HT1080-BI-1 cells with Rhodamine-2, a mitochondrial Ca2+-sensitive dye, and compared fluorescence before and after exposure to acidic conditions. To equilibrate intracellular and extracellular pH, we used high potassium buffer with nigericin (20, 21). Rhodamine-2 fluorescence reached higher peaks in BI-1-overexpressing cells following exposure to acidic conditions with Rhodamine-2 fluorescence showing dose-responsive behavior over pH values of 5.0, 6.0, and 7.0 (Fig. 8A). At normal pH (7.4), no difference was detected in mitochondrial Ca2+ accumulation between Neo and BI-1 cells (data not shown). Next we calculated mean peak Rhodamine-2 fluorescence levels for multiple cells (Fig. 8B). These data show a pH change-induced mitochondrial Ca2+ accumulation in BI-1 overexpression.
FIGURE 8.

Acidic pH induces greater mitochondrial Ca2+ accumulation in BI-1-overexpressing cells. HT1080-Neo and HT1080-BI-1 cells were pre-loaded with 1 μm Rhod-2 for 1 h and then treated with nigericin (5 μm) in 140 mm K+, Ca2+-free buffer (pH 5.0, 6.0, and 7.0). A, Rhod-2 fluorescence intensity was measured over time. Data shown represent 16 independent samples. B, the peak of Rhod-2 fluorescence was recorded for several cells (n = 16 cells) (*, p < 0.05) versus Neo control cells at the same pH). Mitochondrial Rhod-2 Ca2+ fluoresence is shown (right).
BI-1 Increases Cell Death, Bax Translocation to Mitochondria, and Cytochrome c Release from Mitochondria following Acidic Stress—To explore the effects of BI-1 overexpression on the mitochondrial cell death pathway under acidic stress conditions, we compared viability of HT1080-Neo and HT1080-BI-1 cells cultured with high K+ medium and nigericin buffered to pH values ranging from 5.0 to 8.0 (Fig. 9A). Acidification dose-dependently reduced cell viability with significantly more cell death occurring in BI-1 cultures than in Neo control cells. Next we evaluated Bax and cytochrome c levels under the same acidic conditions after subcellular fractionation, measuring the relative amounts of Bax and cytochrome c in cytosolic and mitochondria-containing heavy membrane fractions. Acidic pH induced Bax association with mitochondria to a greater extent in BI-1-overexpressing cells than in Neo control cells (Fig. 9B) consistent with translocation/activation of this proapoptotic protein from the cytosol to mitochondria (22). Conversely Bax levels in the cytosol dropped to a greater extent in BI-1-overexpressing cells following exposure to acidic conditions. Reciprocally cytochrome c levels were reduced in mitochondria and increased in cytosol to a greater extent in BI-1-overexpressing cells compared with Neo control cells (Fig. 9B) consistent with greater release of cytochrome c from mitochondria in acid-stressed BI-1-overexpressing cells.
FIGURE 9.

BI-1 sensitizes cells to cell death induced by acidic conditions. A, cells were cultured in 140 mm K+-adjusted medium buffered to the indicated pH in the presence of 5 μm nigericin, and cell viability was measured 48 h later using the trypan blue method. B, mitochondria-enriched heavy membranes and cytosol fractions were obtained from cells at 48 h following treatment in the same medium as in A. The fractions were analyzed by SDS-PAGE/immunoblotting using antibodies recognizing Bax, cytochrome c, Hsp60 (mitochondrial marker), and tubulin (cytosolic marker). Data from blots of three replicate immunoblotting experiments were quantified by scanning densitometry, were normalized relative to Hsp60 for membrane fractions and tubulin for cytosol fractions, and are presented as bar graphs below the immunoblots. Cyt c, cytochrome c.
DISCUSSION
BI-1 is a cytoprotective, integral membrane protein that is conserved in both animal and plant species and that resides in ER membranes. BI-1 function is associated with the regulation of intracellular Ca2+ homeostasis in both plant and mammalian systems (9, 19, 23, 24). Specifically ER free Ca2+ concentrations are reduced in BI-1-overexpressing cells, and cells with deficient BI-1 have elevated thapsigargin-releasable Ca2+ levels (9), suggesting that BI-1 protein controls ER Ca2+ levels. We have confirmed and extended these previous observations, showing that microsomes from BI-1-overexpressing cells contain reduced thapsigargin-releasable Ca2+ and showing that cells with either stable or conditional overexpression of BI-1 demonstrate less release of ER Ca2+ into the cytosol in response to thapsigargin. Furthermore the pools of ER Ca2+ regulated by ryanodine receptors and IP3Rs, as shown by experiments using agonists of these receptors (4-chloro-m-cresol, histamine, and ATP), were reduced in BI-1-overexpressing cells as were total Ca2+ stores as shown by ionomycin and digitonin treatment.
We found that BI-1 renders ER membranes more porous to Ca2+, but the mechanism of this function is unknown. BI-1 could be an ion channel that conducts Ca2+, thus accounting for the passive leak of Ca2+ out of the lumen of the ER in cells overexpressing BI-1. Alternatively BI-1 may regulate the activity of other types of ER Ca2+ channels such as ryanodine receptors and IP3Rs. Chemical antagonists of these channels failed to modify BI-1-mediated changes in Ca2+ regulation.4 Because these pharmacological approaches have scientific limitations (25), it is necessary to extend the studies using a more biological approach, e.g. an IP3R knock-out system, in the future.
Here we show that the effect of BI-1 on ER Ca2+ permeability is pH-dependent and that the carboxyl-terminal cytosolic domain of BI-1 is required for regulating ER Ca2+. Interestingly this region contains a charged cluster of residues, EKDKKKEKK, within the proximal part of the cytosolic BI-1 carboxyl terminus. We hypothesized that this motif could function as a pH sensor similar to observations previously made for the TREK-1 potassium channel (17). For TREK-1, cytosolic acidosis increases the probability of channel opening; this is similar to the effects we observed for BI-1-overexpressing microsomes and cells with respect to release of ER Ca2+ regulation under acidic conditions. Furthermore we showed that BI-1 protein itself shows acidic pH-induced Ca2+ release in BI-1-reconsituted artificial liposomes (Fig. 6, A, B, C, and D). Thus, BI-1 itself, without interacting with another protein, may be a pH-sensitive Ca2+ regulator. Because the putative pH-sensing motif of BI-1 is similar among several BI-1 orthologs, this pH sensitivity may be evolutionarily conserved.
Acidic pH conditions and chemical cross-linkers promote BI-1 oligomerization (Fig. 7, A and B), suggesting that oligomerization of BI-1 regulates an ER Ca2+ channel or creates a BI-1-mediated Ca2+ channel, thus explaining why acidic pH more potently induces Ca2+ release from ER when BI-1 is overexpressed. Further studies are necessary to establish the mechanistic relevance of BI-1 oligomerization to pH-dependent ER Ca2+ permeabilization. ER Ca2+ levels and the mechanisms controlling its release into the cytosol regulate many cellular processes, including cell death, a variety of signal transduction events, regulation of ER protein folding (27), and gene expression (28). The interplay of H+ and Ca2+ is complex with transient receptor potential channels (29) and acid-sensing ionic channels among the possible mediators (30–32). Reports vary in terms of whether cytosolic pH rises or declines during apoptosis, but the preponderance of evidence favors acidification (33). In contrast, growth and survival factors typically induce cytosol alkalinization (34). Acidification of the cytosol is also a common occurrence in ischemia (35). Thus, BI-1 activity may be potentiated by acidic conditions induced during cellular stress and cytosolic acidification. In HT1080 cells overexpressing BI-1, exposure to acidic conditions resulted in enhanced rather than reduced cell death along with accentuated Bax activation and cytochrome c release from mitochondria as well as excessive Ca2+ accumulation in mitochondria. These observations thus demonstrate for the first time a cell death-promoting phenotype for BI-1 that is manifested during acidic stress. It remains to be demonstrated whether endogenous levels of BI-1 are sufficiently high to promote cell death during acid stress in vivo. More modest levels of BI-1 might even be protective during acid stress. For example, during acidification BI-1 may promote ER Ca2+ release to stimulate mitochondrial respiration, which would help restore cellular ATP levels and support plasma membrane ion transport mechanisms that restore physiological pH.
In the normal human body, pH compensation mechanisms such as HCO3+/CO2 have been well established. Notably in severe pathologic conditions, systemic pH alterations do not occur, although local pH alterations including severe acidic environment may be observed. The dynamic accumulation pattern of Ca2+ at low pH may be related to the pathological sites of rheumatoid arthritis (36), hypoxia (37), the surrounding sites of metastatic cancers (38, 39), and atherosclerosis (40). The acidic sites around cancer have been reported to be as low as 5.2 (38). The pH of atherosclerotic lesions will depend on the rate of release of H+ from the cells including macrophages (26, 41).
The physiological and pathophysiological roles of BI-1 should be studied in detail in the near future. Additional studies will reveal the pathophysiological contexts in which pH-dependent regulation of BI-1 contributes to ER Ca2+ regulation and cell death.
Supplementary Material
Acknowledgments
We thank Prof. Mi-Jae Lim for critical review of this manuscript.
This work was supported, in whole or in part, by National Institutes of Health Grant AG15393 (to J. C. R.). This work was also supported by Korea Research Foundation Grants KRF-2005-070-C00095, E00021, and 2005-015-E00210 and Korea Science and Engineering Foundation Grants R01-2006-000-10422-0 and R01-2007-000-20275-0. The costs of publication of this article were defrayed in part by the payment of page charges. This article must therefore be hereby marked “advertisement” in accordance with 18 U.S.C. Section 1734 solely to indicate this fact.
The on-line version of this article (available at http://www.jbc.org) contains supplemental Figs. S1 and S2.
Footnotes
The abbreviations used are: ER, endoplasmic reticulum; IP3, inositol trisphosphate; BI-1, Bax inhibitor-1; ICM, intracellular-like medium; HA, hemagglutinin; CHAPS, 3-[(3-cholamidopropyl)dimethylammonio]-1-propanesulfonic acid; TRITC, tetramethylrhodamine isothiocyanate; IP3R, IP3 receptor; Rhod-2, Rhodamine-2.
H.-R. Kim, G.-H. Lee, K.-C. Ha, T. Ahn, J.-Y. Moon, B.-J. Lee, S.-G. Cho, S. Kim, Y.-R. Seo, Y.-J. Shin, S.-W. Chae, J. C. Reed, and H.-J. Chae, unpublished data.
References
- 1.Berridge, M. J. (2002) Cell Calcium 32 235-249 [DOI] [PubMed] [Google Scholar]
- 2.Van Coppenolle, F., Vanden Abeele, F., Slomianny, C., Flourakis, M., Hesketh, J., Dewailly, E., and Prevarskaya, N. (2004) J. Cell Sci. 117 4135-4142 [DOI] [PubMed] [Google Scholar]
- 3.Clapham, D. E. (2007) Cell 131 1047-1058 [DOI] [PubMed] [Google Scholar]
- 4.Bezprozvanny, I., Watras, J., and Ehrlich, B. E. (1991) Nature 351 751-754 [DOI] [PubMed] [Google Scholar]
- 5.Pozzan, T., Rizzuto, R., Volpe, P., and Meldolesi, J. (1994) Physiol. Rev. 74 595-636 [DOI] [PubMed] [Google Scholar]
- 6.Hofer, A. M., Curci, S., Machen, T. E., and Schulz, I. (1996) FASEB J. 10 302-308 [DOI] [PubMed] [Google Scholar]
- 7.Xu, Q., and Reed, J. C. (1998) Mol. Cell 1 337-346 [DOI] [PubMed] [Google Scholar]
- 8.Chae, H. J., Ke, N., Kim, H. R., Chen, S., Godzik, A., Dickman, M., and Reed, J. C. (2003) Gene (Amst.) 323 101-113 [DOI] [PubMed] [Google Scholar]
- 9.Chae, H. J., Kim, H. R., Xu, C., Bailly-Maitre, B., Krajewska, M., Krajewski, S., Banares, S., Cui, J., Digicaylioglu, M., Ke, N., Kitada, S., Monosov, E., Thomas, M., Kress, C. L., Babendure, J. R., Tsien, R. Y., Lipton, S. A., and Reed, J. C. (2004) Mol. Cell 15 355-366 [DOI] [PubMed] [Google Scholar]
- 10.Wang, Z., Cuddy, M., Samuel, T., Welsh, K., Schimmer, A., Hanaii, F., Houghten, R., Pinilla, C., and Reed, J. C. (2004) J. Biol. Chem. 279 48168-48176 [DOI] [PubMed] [Google Scholar]
- 11.Maidorn, R. P., Cragoe, E. J., Jr., and Tannock, I. F. (1993) Br. J. Cancer 67 297-303 [DOI] [PMC free article] [PubMed] [Google Scholar]
- 12.Zanke, B. W., Lee, C., and Arab, S. (1998) Cancer Res. 58 2801-2808, [PubMed] [Google Scholar]
- 13.Choi, J., Kim, C., and Choi, M. J. (1999) Anal. Biochem. 274 118-124 [DOI] [PubMed] [Google Scholar]
- 14.Ya Deau, J. T., Morelli, C. M., and Desravines, S. (2003) Anesth. Analg. 97 1325-1330 [DOI] [PubMed] [Google Scholar]
- 15.Holz, R. W., Bittner, M. A., and Senter, R. A. (1992) Methods Enzymol. 219 165-178 [DOI] [PubMed] [Google Scholar]
- 16.Gill, D. L., Ghosh, T. K., and Mullaney, J. M. (1989) Cell Calcium 10 363-374 [DOI] [PubMed] [Google Scholar]
- 17.Kloda, A., Ghazi, A., and Martinac, B. (2006) Biophys. J. 90 1992-1998 [DOI] [PMC free article] [PubMed] [Google Scholar]
- 18.Koo, M. K., Oh, C. H., Holme, A. L., and Pervaiz, S. (2007) Cytometry A 71 87-93 [DOI] [PubMed] [Google Scholar]
- 19.Cowling, R. T., and Birnboim, H. C. (1998) Mol. Membr. Biol. 15 177-187 [DOI] [PubMed] [Google Scholar]
- 20.Boyarsky, G., Hanssen, C., and Clyne, L. A. (1996) Am. J. Physiol. 271 C1146-C1156 [DOI] [PubMed] [Google Scholar]
- 21.Akiba, Y., and Kaunitz, J. D. (1999) Am. J. Physiol. 276 G293-G302 [DOI] [PubMed] [Google Scholar]
- 22.Reed, J. C. (2006) Cell Death Differ. 13 1378-1386 [DOI] [PubMed] [Google Scholar]
- 23.Bolduc, N., Lamb, G. N., Cessna, S. G., and Brisson, L. F. (2007) Biochimie (Paris) 89 961-971 [DOI] [PubMed] [Google Scholar]
- 24.Ihara-Ohori, Y., Nagano, M., Muto, S., Uchimiya, H., and Kawai-Yamada, M. (2007) Plant Physiol. 143 650-660 [DOI] [PMC free article] [PubMed] [Google Scholar]
- 25.Bootman, M. D., Collins, T. J., Mackenzie, L., Roderick, H. L., Berridge, M. J., and Peppiatt, C. M. (2002) FASEB J. 16 1145-1150 [DOI] [PubMed] [Google Scholar]
- 26.Silver, I. A., Murrills, R. J., and Etherington, D. J. (1988) Cell Res. 175 266-276 [DOI] [PubMed] [Google Scholar]
- 27.Corbett, E. F., Oikawa, K., Francois, P., Tessier, D. C., Kay, C., Bergeron, J. J., Thomas, D. Y., Krause, K. H., and Michalak, M. (1999) J. Biol. Chem. 274 6203-6211 [DOI] [PubMed] [Google Scholar]
- 28.Hardingham, G. E., Chawla, S., Johnson, C. M., and Bading, H. (1997) Nature 385 260-265 [DOI] [PubMed] [Google Scholar]
- 29.Lambers, T. T., Oancea, E., de Groot, T., Topala, C. N., Hoenderop, J. G., and Bindels, R. J. (2007) Mol. Cell. Biol. 27 1486-1494 [DOI] [PMC free article] [PubMed] [Google Scholar]
- 30.Wang, W., Duan, B., Xu, H., Xu, L., and Xu, T. L. (2006) J. Biol. Chem. 281 2497-2505 [DOI] [PubMed] [Google Scholar]
- 31.Chen, C. C., England, S., Akopian, A. N., and Wood, J. N. (1998) Proc. Natl. Acad. Sci. U. S. A. 95 10240-10245 [DOI] [PMC free article] [PubMed] [Google Scholar]
- 32.Pidoplichko, V. I., and Dani, J. A. (2006) Proc. Natl. Acad. Sci. U. S. A. 103 11376-11380 [DOI] [PMC free article] [PubMed] [Google Scholar]
- 33.Matsuyama, S., and Reed, J. C. (2000) Cell Death Differ. 7 1155-1165 [DOI] [PubMed] [Google Scholar]
- 34.Scott-Burden, T., Resink, T. J., Hahn, A. W., Baur, U., Box, R. J., and Bühler, F. R. (1989) J. Biol. Chem. 264 12582-12589 [PubMed] [Google Scholar]
- 35.Dhein, S. (2006) Adv. Cardiol. 42 198-212 [DOI] [PubMed] [Google Scholar]
- 36.Farr, M., Garvey, K., Bold, A. M., Kendall, M. J., and Bacon P. A. (1985) Clin. Exp. Rheumatol. 3 99-104 [PubMed] [Google Scholar]
- 37.Dasso, L. L., Buckler, K. J., and Vaughan-Jones, R. D. (2000) Am. J. Physiol. 279 L36-L42 [DOI] [PubMed] [Google Scholar]
- 38.Griffiths, J. R. (1991) Br. J. Cancer 64 425-427 [DOI] [PMC free article] [PubMed] [Google Scholar]
- 39.Kingsley, L. A., Fournier, P. G., Chirgwin, J. M., and Guise, T. A. (2007) Mol. Cancer Ther. 6 2609-2617 [DOI] [PubMed] [Google Scholar]
- 40.Leake, D. S. (1997) Atherosclerosis 129 149-157 [DOI] [PubMed] [Google Scholar]
- 41.Tapper, H., and Sundler, R. (1992) Biochem. J. 281 245-250 [DOI] [PMC free article] [PubMed] [Google Scholar]
Associated Data
This section collects any data citations, data availability statements, or supplementary materials included in this article.