Abstract
In recent years, mitochondria have emerged as important targets of agonist-dependent increases in cytosolic Ca2+ concentration. Here, we analyzed the significance of Ca2+ signals for the modulation of organelle function by directly measuring mitochondrial and cytosolic ATP levels ([ATP]m and [ATP]c, respectively) with specifically targeted chimeras of the ATP-dependent photoprotein luciferase. In both HeLa cells and primary cultures of skeletal myotubes, stimulation with agonists evoking cytosolic and mitochondrial Ca2+ signals caused increases in [ATP]m and [ATP]c that depended on two parameters: (i) the amplitude of the Ca2+ rise in the mitochondrial matrix, and (ii) the availability of mitochondrial substrates. Moreover, the Ca2+ elevation induced a long-lasting priming that persisted long after agonist washout and caused a major increase in [ATP]m upon addition of oxidative substrates. These results demonstrate a direct role of mitochondrial Ca2+ in driving ATP production and unravel a form of cellular memory that allows a prolonged metabolic activation in stimulated cells.
ATP is the primary utilizable source of high-energy phosphate bonds within the cell and acts as an allosteric effector of numerous cell processes. Most intracellular ATP is derived from cytosolic glycolysis and mitochondrial oxidative phosphorylation. The latter process couples the oxidation of reduced cofactors via the respiratory chain to ATP synthesis by mitochondrial ATP synthase. The supply of reduced cofactors (NADH, FADH2) is ensured by mitochondrial oxidation of substrates derived from glucose, fatty acids, and amino acids via different metabolic pathways. Therefore, oxidative phosphorylation is a complex process regulated at different levels by the interactions of mitochondrial and cytosolic metabolism (1). In this crosstalk, mitochondrial Ca2+ homeostasis, a process that has attracted a large interest in the past few years (2–11), appears to play a major role. Indeed, three dehydrogenases of the Krebs cycle (pyruvate, isocitrate, and α-ketoglutarate dehydrogenase) are modulated by [Ca2+] in the micromolar range (12, 13). Recently, it has been shown that, despite the low affinity of the mitochondrial Ca2+ uptake systems, large increases in matrix [Ca2+] parallel the cytosolic Ca2+ signals, thanks to the close contact between mitochondria and the intracellular Ca2+ stores (14). The final outcome of this Ca2+ transfer is expected to be the enhancement of mitochondrial ATP production to balance the increased ATP demand of a stimulated cell (15–18).
In this paper, we directly addressed these issues by investigating, in intact living cells, the effect of cytosolic and mitochondrial Ca2+ signaling on intramitochondrial ATP concentration. For this purpose, we have utilized a targeted recombinant Ca2+ probe (mitochondrial aequorin, mtAEQ) (2) and constructed a tool, a specifically targeted chimera of the ATP-sensitive photoprotein luciferase, with the aim of dynamically monitoring the ATP concentration in the mitochondrial matrix ([ATP]m). The basis for this approach to the measurement of this key cellular parameter was the observation that the affinity of luciferase for ATP, which in vitro is in the micromolar range, is drastically lower in vivo, presumably because of the presence of competing proteins and anions (19). Indeed, in the cellular environment and in the presence of luciferin, luciferase light emission is a linear function of [ATP] in a concentration range between 10−3 and 10−2 M, i.e., in the physiological range (20, 21). We thus constructed a chimeric cDNA, which allows the selective targeting of luciferase to the mitochondrial matrix. With this tool, we could not only directly demonstrate that agonist-dependent changes in mitochondrial Ca2+ concentration correlate with an enhancement in mitochondrial ATP concentration, provided that oxidizable substrates are available, but also identify a phenomenon of long-term memory, allowing a prolonged metabolic “priming” that lasts longer than the mitochondrial [Ca2+] increase. These observations may clarify how mitochondria can face the increased energy demand imposed by both short-term (e.g., secretion or contraction) and long-term (e.g., activation of gene transcription) effects of agonists acting by means of a rise in cytoplasmic Ca2+ concentration.
Methods
Plasmid Construction.
Cytosolic (untargeted) firefly luciferase was transferred from the plasmid pGL3 basic (Promega) to the plasmid pcDNA3 (Invitrogen) as an 876-nt BglII–HindIII fragment and then transferred to VR1012.
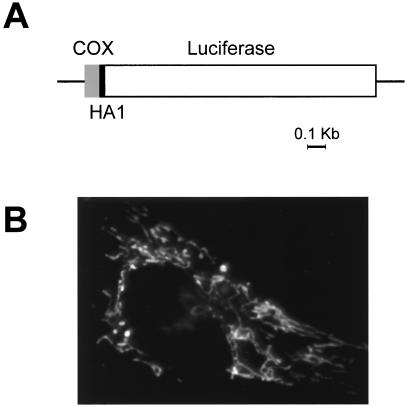
For the preparation of mitochondrial luciferase (mtLuc), DNA sequences encoding a mitochondrial presequence and the hemagglutinin HA1 tag were added to the luciferase cDNA as follows. A fragment of the luciferase cDNA was first amplified using the following primer: 5′-AAAGCTT AAT GGA AGA CGC CAA AAA CAT AAA GAA A (corresponding to the sequence encoding amino acids 1–9 of luciferase; HindIII site underlined) and GAA GAT GTT GGG GTG TTG TAA CAA T (spanning the endogenous ClaI site of the luciferase cDNA and encoding amino acids 456–465). The PCR product was digested with the enzymes HindIII and ClaI and fused in frame to the ClaI/HindIII fragment encoding the HA1 tag (14). A ClaI fragment was thus generated, which, in an appropriately prepared pBluescript SK(+) plasmid, could be fused in frame with the EcoRI/HindIII fragment encoding the N-terminal 33 aa of COX8 (25 aa of the cleavable presequence + 8 aa of the mature polypeptide) (2) and the ClaI/SalI fragment encoding the C-terminal portion of luciferase (amino acids 457–556). The whole final construct (denominated mtLuc, and shown schematically in Fig. 1) was excised by a NotI/XhoI or PstI/SalI digestion and cloned, respectively, into the expression vectors pcDNAI and VR1012.
Figure 1.
(A) Schematic map of the chimeric mitochondrial luciferase. Lines and bars indicate the noncoding and coding regions [gray, cytochrome c oxidase subunit VIII (COX8); black, HA1; white, luciferase], respectively. Details of the construction strategy are given in Material and Methods. (B) Immunofluorescence image of HeLa cells transiently transfected with mtLuc and stained with the anti-HA1 mAb.
Cell Culture and Transfection.
HeLa cells were grown in 1 g/liter glucose DMEM, supplemented with 10% FCS. This concentration of glucose was chosen to decrease the dependency of these cells on glycolysis and increase their oxidative capacity. Cells were seeded for transfection onto 13-mm coverslips and grown to 50% confluence. Primary cultures of skeletal myotubes were prepared from newborn rats as previously described (22), and myotubes were transfected on the second day of culture. Transfection with cytosolic luciferase (cytLuc) or mtLuc cDNA (4 μg/ml) was carried out according to a standard calcium-phosphate procedure (14). Measurements were performed either 36 hr after transfection or at day 7 of culture for HeLa cells and myotubes, respectively.
Luminescence Measurements.
Cell luminescence was measured in a luminometer as previously described (14). Cells (200,000–300,000 per coverslip) were constantly perfused with a modified Krebs–Ringer buffer containing: 125 mM NaCl, 5 mM KCl, 1 mM Na3PO4, 1 mM MgSO4, 1 mM CaCl2, 20 μM luciferin, and 20 mM Hepes (pH 7.4 at 37°C) supplemented with either 5.5 mM glucose or 0.1 mM pyruvate/1 mM lactate, as specified in the text. Complete equilibration in the chamber with new medium was obtained in 5 s. Under these conditions, the light output of a coverslip of transfected cells was in the range of 1,000–10,000 cps for each luciferase construct vs. a background lower than 10 cps. Luminescence was entirely dependent on the presence of luciferin and was proportional to the perfused luciferin concentration between 20 and 200 μM. Agonists and inhibitors were tested for nonspecific effects on the luminescence of the non-ATP-utilizing luciferase of Renilla reniformis expressed in cytosol (23). None were observed. When measured, mitochondrial Ca2+ concentration ([Ca2+]m) was monitored in cells transiently transfected with mtAEQ, and calibration of luminescence signal was performed as previously described (14).
Immunocytochemistry.
Cells were fixed and permeabilized 36 hr after transfection using 4% formaldehyde for 30 min and then 0.5% Triton X-100 for 5 min. Cells were then labeled with the anti-HA1 mAb 12CA5 and a rabbit anti-mouse secondary Ab conjugated to FITC, as previously described (14). After immunostaining, cells were imaged with a Zeiss Axiovert inverted microscope.
Results and Discussion
Agonist-Triggered Mitochondrial and Cytosolic ATP Changes.
To obtain mitochondrially targeted HA1-tagged luciferase, we fused the photoprotein to the targeting information of a mitochondrial protein, subunit VIII of cytochrome c oxidase. To this end, the sequences encoding firefly luciferase (24), HA1 tag, and COX8 (14), were fused in frame, as specified in Materials and Methods. The final chimeric cDNA, mtLuc, encoded from the N to the C terminus: the 25-aa presequence and the first 8 aa of COX8 mature protein, the 9-aa HA1 epitope tag, and the whole photoprotein. When expressed in HeLa cells, the chimera was properly sorted to the mitochondria, as evident from the immunolocalization presented in Fig. 1. Conversely, as previously observed (21, 23, 25), in the absence of the targeting sequence, luciferase was retained in the cytoplasm.
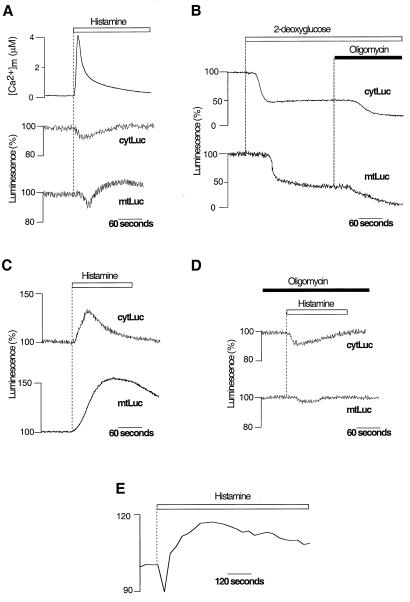
By using both luciferase constructs, we dynamically monitored the effect of agonist-triggered Ca2+ signals on [ATP]m and cytosolic ATP concentration ([ATP]c). In a first series of experiments, cells were perfused with Krebs–Ringer buffer supplemented with glucose (5.5 mM) and challenged, where indicated, with histamine (100 μM), which induces [Ca2+]c and [Ca2+]m transients as a result of intracellular Ca2+ mobilization (2, 10–11). The upper traces of Fig. 2A show the [Ca2+]m transients measured with mtAEQ (2). The concomitant typical patterns of [ATP] changes are illustrated in the lower traces. Histamine triggered first a transient decrease both in [ATP]c (92 ± 4% of the prestimulatory value, n = 20) and [ATP]m (94 ± 3% of the prestimulatory value, n = 20). Such a decrease is consistent with the concerted activation of cytosolic enzymes that consume ATP, including plasma membrane and endoplasmic reticulum Ca2+-ATPases (26). However, this decrease in ATP concentration in both compartments was followed by a recovery to initial or slightly elevated values (105 ± 5% and 113 ± 5% for [ATP]c and [ATP]m, respectively). Pretreatment of the cells with oligomycin (5 μM), a potent inhibitor of the mitochondrial ATP synthase, did not significantly modify the patterns of [ATP]m and [ATP]c changes (n = 20), suggesting that, in HeLa cells, ATP homeostasis is primarily maintained by anaerobic glycolysis when glucose is the primary substrate. Many cancer cell lines, including HeLa cells, are indeed known to exhibit constitutively high glycolytic rates and reduced mitochondrial ATP synthesis (27). Accordingly, oligomycin addition did not elicit any change in resting [ATP]c (n = 20) and had minor effects only on resting matrix ATP levels ([ATP]m: 97 ± 7% of the initial value, n = 20) (data not shown). On the contrary, addition of the glycolysis inhibitor 2-deoxyglucose (5 mM) triggered a large decrease in the luciferase signal, first in the cytosol ([ATP]c: to 60 ± 5% of the initial value, n = 5) and subsequently in the mitochondria ([ATP]m: to 55 ± 7% of the initial value, n = 5) (Fig. 2B). In the presence of 2-deoxyglucose, we thus observed a clear sensitivity to oligomycin, which causes a further decrease in the ATP content, first in the mitochondria ([ATP]m: to 13 ± 4% of the initial value, n = 5) and then in the cytosol ([ATP]c: to 26 ± 6% of the initial value, n = 5) (Fig. 2B). These latter results indicate that, in HeLa cells, mitochondrial ATP synthesis is recruited only when the glycolytic pathway is impaired.
Figure 2.
[ATP]m and [ATP]c changes elicited by Ca2+ signals in HeLa cells perfused with either glycolytic (A and B) or oxidative (C and D) substrates. Measurements were carried out on HeLa cells transiently transfected with cytLuc, mtLuc, or mtAEQ. (A) Effects of histamine (100 μM, white bar) on [Ca2+]m, [ATP]c (cytLuc), and [ATP]m (mtLuc) in HeLa cells perfused with glucose as metabolic substrate. (B) Inhibition of mitochondrial ATP synthesis with oligomycin (5 μM) decreases [ATP]c and [ATP]m only after inhibition of glycolysis with 2-deoxyglucose (5 mM). (C) When HeLa cells are perfused with pyruvate and lactate instead of glucose, histamine provokes major increases in [ATP]c and [ATP]m. (D) Perfusion with oligomycin (5 μM) suppresses the histamine-dependent [ATP]c and [ATP]m rises observed when HeLa cells are perfused with pyruvate and lactate (see C). (E) Agonist stimulation causes an increase in membrane potential ΔΨm as measured in pyruvate and lactate-perfused HeLa cells loaded with the mitochondrial potential-sensitive dye tetramethylrhodamine ethyl ester (10 nM) through changes in fluorescence (arbitrary units) (26). mtLuc and cytLuc luminescence data are expressed as a percentage of the initial value. Measurements of [Ca2+]m, [ATP]c, and [ATP]m were performed in parallel batches of cells transiently transfected with mtAEQ, cytLuc, and mtLuc.
To increase the contribution of mitochondrial ATP synthesis to cellular ATP homeostasis, we perfused HeLa cells with the mitochondrial substrate pyruvate (0.1 mM) in the absence of glucose; lactate (1 mM) was also included to maintain intracellular NADH levels. Under these conditions, when HeLa cells were challenged with histamine, there was a marked increase of both [ATP]c (peak value: 130 ± 12%, n = 30) and [ATP]m (peak value: 160 ± 30%, n = 30) (Fig. 2C). Pretreatment of the cells with oligomycin (5 μM, 5 min) abolished the agonist-induced increases in [ATP]m (107 ± 4% of the prestimulatory value, n = 10) and in [ATP]c (95 ± 5% of the prestimulatory value, n = 10) (Fig. 2D), indicating that they are the results of mitochondrial ATP synthesis. As noticed in other cell types (28), we also observed a stable rise in ΔΨm after agonist stimulation (Fig. 2E). This suggests that the increase in [ATP]m reflects long-lasting elevation of the mitochondrial energy state.
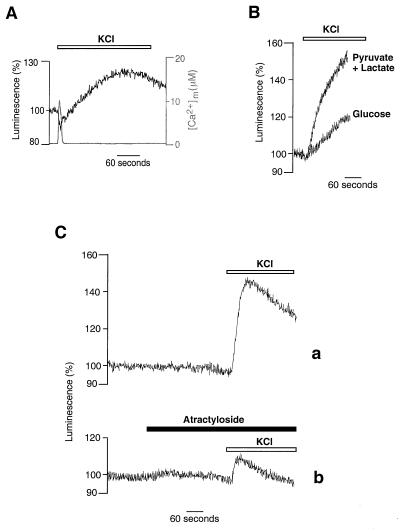
To verify whether the agonist-dependent changes in [ATP]m observed in HeLa cells were a general phenomenon, we carried out similar experiments in other cell types. In particular, we show here those obtained in primary cultures of skeletal myotubes. These cells differ substantially from HeLa cells in their embryological origin, Ca2+ signaling patterns, and mechanisms (29, 30) and are expected to display less glycolytic behavior. Indeed, when myotubes were depolarized by perfusing a high K+ saline solution, and thus a Ca2+ signal was elicited via the opening of both plasma membrane and endoplasmic reticulum Ca2+ channels (22), a major increase in [ATP]m was also observed in the presence of glucose (Fig. 3A). Accordingly, when atractyloside, which blocks the mitochondrial ATP/ADP exchanger, was applied to myotubes (40 μM, 5 min), we observed a significant decrease in [ATP]c, not only when cells were perfused with pyruvate and lactate, but also when glucose was the metabolic substrate ([ATP]c: to 62 ± 5% and 77 ± 3% of the initial value, respectively, n = 5). This result indicates that, in myotubes, in contrast to HeLa cells, mitochondrial oxidative metabolism contributes significantly to cellular ATP homeostasis in growth medium containing glucose. However, as for HeLa cells, the agonist-triggered rises in [ATP]m are more substantial when cells are perfused with pyruvate and lactate (peak maximum = 163 ± 21%, n = 10) (Fig. 3B). Pretreatment of the myotubes with atractyloside reduced the agonist-induced increase in [ATP]m, yielding a peak of only 110 ± 2% above basal (n = 5), while not noticeably modifying resting levels of [ATP]m (Fig. 3C). Taken together, the results obtained in HeLa cells and myotubes allow us to conclude that agonist-induced Ca2+ signals are able to trigger [ATP]m rises, the kinetics and the final value of which are dependent on both cell metabolism and substrate supply to mitochondria.
Figure 3.
[ATP]m increase triggered by KCl challenge of primary cultures of myotubes. (A) Myotubes were perfused with glucose as metabolic substrate. Simultaneous [Ca2+]m changes triggered by KCl are also shown (gray trace). (B) Perfusion of myotubes with pyruvate and lactate instead of glucose increases both kinetics and peak value of the [ATP]m rise. (C) Pretreatment of myotubes with atractyloside (40 μM) reduces the KCl-induced [ATP]m rise. Throughout the experiments shown in this figure, cells were perfused in Krebs–Ringer buffer with pyruvate and lactate as metabolic substrate.
Ca2+ Dependence of the [ATP]m Increases.
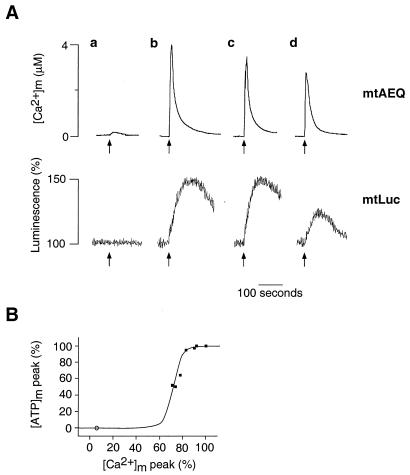
To determine whether the agonist-dependent [Ca2+]m increases represented the essential triggering event of the [ATP]m rises, HeLa cells were loaded with the Ca2+ buffer BAPTA-AM [1,2-bis(2-aminophenoxy)ethane-N,N,N′,N′-tetraacetic acid tetrakis(acetoxymethyl ester)] (31). BAPTA-AM (10 μM, 30 min) loading buffered cytosolic [Ca2+] changes and almost abolished the histamine-dependent [Ca2+]m rise (<300 nM vs. 4.1 ± 0.2 μM in unloaded cells). In these conditions, no [ATP]m increase was observed after histamine stimulation (n = 5, Fig. 4A, trace a).
Figure 4.
[Ca2+]m dependency of the [ATP]m rise induced in HeLa cells by histamine. (A) Histamine-dependent [Ca2+]m and [ATP]m changes at different states of filling of the endoplasmic reticulum store. Throughout the experiments shown, the cells were perfused in Krebs–Ringer buffer with pyruvate and lactate as metabolic substrate, and, where indicated (arrow), challenged with histamine (100 μM). (a) Cells were loaded, before the experiment, with BAPTA-AM, as specified in the text. (b–d) The effects of increased time of incubation with Krebs–Ringer buffer supplemented with EGTA (1 mM) (b, control; c, 90 s; d, 300 s before histamine stimulation) on [Ca2+]m rise (mtAEQ) and [ATP]m rise (mtLuc). (B) Percentage of the [ATP]m peak maximum as a function of the percentage of the [Ca2+]m peak. Values are derived from experiments shown in A. Extension to the origin of the y axis is calculated from the experiments with the Ca2+ buffer BAPTA-AM (○).
To assess quantitatively the response to [Ca2+]m of [ATP]m, the amplitude of the agonist-dependent [Ca2+]m increase was modified less drastically by progressively depleting the Ca2+ content of the intracellular Ca2+ stores. This was accomplished by varying the time of incubation (30 s to 5 min) of the cells in EGTA-containing medium (Krebs–Ringer buffer with no added Ca2+, supplemented with 1 mM EGTA and pyruvate and lactate as metabolic substrate, as specified above) before carrying out the histamine stimulation. By this procedure, the histamine-triggered [Ca2+]m rise could be progressively decreased (Fig. 4A, traces b–d). As for the [ATP]m rise, no difference was observed up to a 20% reduction of the [Ca2+]m spike. However, when [Ca2+]m was depressed further, a marked reduction of the agonist-dependent [ATP]m rise became apparent; after a 5-min incubation in Ca2+-free medium, [Ca2+]m peaked at 2.8 ± 0.2 μM, and the agonist-dependent [ATP] rise was reduced by 50% (peak [ATP]m: 126 ± 5% of the prestimulatory value, n = 6) (Fig. 4A). This sigmoidal behavior is illustrated in Fig. 4B. Taken together, these results indicate that the agonist-dependent [Ca2+]m increase is the trigger for the rise in [ATP]m, the amplitude of which is controlled by the value of the [Ca2+]m spike. On the other hand, the [Ca2+]m rise is necessary, but not sufficient, to activate ATP synthesis. Indeed, although histamine stimulation caused the same [Ca2+]m rise in medium containing either glucose or pyruvate and lactate as metabolic substrates (4.1 ± 0.2 vs. 4.05 ± 0.1 μM, respectively), as described above, the resulting [ATP]m increase was clearly different (compare Fig. 2A and 2C). It can thus be concluded that, together with the amplitude of the [Ca2+] rise in the mitochondrial matrix, the availability of mitochondrial substrates is a key determinant in the capacity of mitochondria to activate ATP production upon cell stimulation.
Evidence for a Mitochondrial Memory Mechanism.
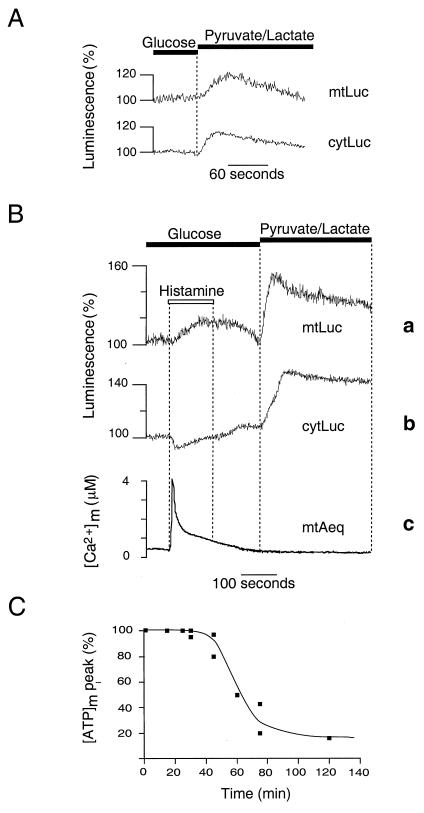
Ca2+ signals are frequently transient in nature, but often give rise to many long-lasting functional consequences in stimulated cells (17, 32, 33). To investigate how mitochondria can meet a persistent increase in cellular energy demand, we studied whether the information conveyed by Ca2+ signals is stored by mitochondria, even after a return of [Ca2+]m to basal levels. If this were the case, one may predict that, even if mitochondrial ATP synthesis is not recruited at the time of the agonist challenge, mitochondria may retain a memory of the Ca2+ stimulation. To test this hypothesis, we took advantage of the dichotomy of HeLa cell metabolism. When glucose was replaced with pyruvate and lactate in the perfusion medium, a transient increase in both [ATP]m (113 ± 3% above basal, n = 5) and [ATP]c (112 ± 2% above basal, n = 5) (Fig. 5A) was observed. When cells were previously exposed to histamine, the rise produced by the subsequent perfusion with mitochondrial substrates was dramatically enhanced. This result is illustrated in Fig. 5B. A cytosolic, and hence mitochondrial, Ca2+ signal was triggered by applying histamine to HeLa cells perfused with glucose. Then, after agonist wash-out, glucose was replaced with pyruvate and lactate. Under these conditions, subsequent perfusion with mitochondrial substrates caused [ATP]m and [ATP]c to reach a peak of 161 ± 17% (n = 15; Fig. 5B, trace a) and 132 ± 13% above basal (n = 10; Fig. 5B, trace b), respectively. When measured under the same conditions, [Ca2+]m increased upon agonist addition (4.05 ± 0.1 μM) but returned to basal level within a few minutes. No further [Ca2+]m increase could be detected upon replacement of glucose with pyruvate and lactate (n = 5) (Fig. 5B, trace c). The substrate-dependent [ATP]m increase was abolished if cells were pretreated with oligomycin (n = 5) and could therefore be accounted for by an activation of mitochondrial ATP synthesis. Strikingly, we found that this substrate-dependent [ATP]m increase in cells previously stimulated with histamine was identical to the [ATP]m rise induced by histamine in the presence of pyruvate and lactate (n = 5). This long-term activation was still observed, with similar amplitude and kinetics, 30 min after agonist stimulation but decreased rapidly after 1 hr (Fig. 5C). Therefore, mitochondria retain a memory of Ca2+-signaling information, which does not involve a sustained [Ca2+]m rise (see Fig. 5B, trace c), allowing them to match an increased ATP demand with an enhanced ATP synthesis. This memory mechanism may involve stable, metabolite-dependent increases in pyruvate dehydrogenase activity, as described recently in hepatocytes (28), or reflect a persistent Ca2+-triggered activation of the respiratory chain (28, 34). Given the prolonged time course of this phenomenon, an alternative possibility would be a Ca2+-dependent activation or deinhibition of one of the steps of oxidative phosphorylation, e.g., an unknown regulatory molecule achieving a long-lasting Ca2+-dependent conformational change. In heart mitochondria, an ATP synthase inhibitory factor, termed calcium binding inhibitor (35), has been described to dissociate into monomers upon Ca2+ binding, leading to an activation of the ATP synthase. However, little is know about its action in vivo and specifically about its kinetics of reassociation with the ATP synthase. Other possibilities include a change in mitochondrial volume, leading to activation of the respiratory chain (34), or other changes in mitochondrial morphology.
Figure 5.
Effects of prestimulation of HeLa cells with histamine on the subsequent response of [ATP]m and [ATP]c to a change in metabolic substrate (A and B). Shift from glucose to pyruvate and lactate as metabolic substrate in the perfusion medium produces a transient rise in [ATP]m (mtLuc) and [ATP]c (cytLuc) (A) that is increased when cells are stimulated previously with histamine (100 μM) (B), while no further changes in [Ca2+]m are observed (mtAEQ). (C) Substrate-induced [ATP]m peak maximum as a function of time after histamine removal.
Conclusions
Our findings demonstrate two fundamental properties of the mitochondrial stimulus–response metabolic coupling to Ca2+ signals. First, mitochondrial Ca2+ accumulation triggers an activation of the mitochondrial metabolic machinery, which increases ATP synthesis in the mitochondria and, hence, ATP levels in the cytosol. Decreasing mitochondrial Ca2+ accumulation decreases the [ATP]m rise, highlighting a dependency of the [ATP]m rise on [Ca2+]m that is reminiscent of, and probably related to, the Ca2+ sensitivity of the matrix dehydrogenases. The strict dependence of ATP synthesis on [Ca2+]m also suggests that, in the complex scenario of calcium signaling, [ATP]m can be finely modulated in response to the different patterns of [Ca2+]c, and hence [Ca2+]m, responses to various extracellular stimuli. Second, the extent of the increase in ATP synthesis depends on the availability of oxidative substrates both in HeLa cells and in myotubes. In glycolytic cells, such as HeLa cells, we could dissociate the “priming” signal, provided by the increase in [Ca2+]m, from the activation of ATP synthesis, which started only when oxidative substrates were supplied to the cells (and could be delayed up to 1 hr after the Ca2+ signal). This long-term priming of mitochondrial activity, which persists longer than the rise of [Ca2+]m, represents a mechanism of cell memory that may serve different functions. By exploiting a transient Ca2+ rise, this process may allow mitochondria to meet the increased energy requirements of a stimulated cell with no risk of futile Ca2+ cycling and/or organelle Ca2+ overload. Moreover, it may allow mitochondrial control over ATP-regulated cell processes, such as ion channel activity or secretion (21), providing an example of how temporally controlled Ca2+ signals may be decoded (32, 33) into prolonged effects inside the cell.
Acknowledgments
We thank L. Filippin for carrying out some of the experiments; I. and D. Bonner, P. Burnett, F. DiLisa, A. Hofer, T. Pozzan, V. Robert, and A. Thomas for critical reading of the manuscript; P. Magalhaes and E. K. Ainscow for helpful collaboration; and G. Ronconi and M. Santato for technical assistance. This work was supported by grants from Telethon (no. 850), the Biomed Program of the European Union (BMH4-96-0181), the Italian University and Health Ministries (to R.R.) and from the British Council, Medical Research Council (U.K.), the Wellcome Trust, and the British Diabetic Association (to G.A.R.).
Abbreviations
- [ATP]m
mitochondrial ATP concentration
- [ATP]c
cytosolic ATP concentration
- BAPTA-AM
1,2-bis(2-aminophenoxy)ethane-N,N,N′,N′-tetraacetic acid tetrakis(acetoxymethyl ester)
- [Ca2+]m
mitochondrial Ca2+ concentration
- cytLuc
cytosolic luciferase
- mtLuc
mitochondrial luciferase
- mtAEQ
mitochondrial aequorin
References
- 1.Brown G C. Biochem J. 1992;284:1–13. doi: 10.1042/bj2840001. [DOI] [PMC free article] [PubMed] [Google Scholar]
- 2.Rizzuto R, Simpson A W, Brini M, Pozzan T. Nature (London) 1992;358:325–327. doi: 10.1038/358325a0. [DOI] [PubMed] [Google Scholar]
- 3.Friel D D, Tsien R W. J Neurosci. 1994;14:4007–4024. doi: 10.1523/JNEUROSCI.14-07-04007.1994. [DOI] [PMC free article] [PubMed] [Google Scholar]
- 4.Jouaville L S, Ichas F, Holmuhamedov E L, Camacho P, Lechleiter J D. Nature (London) 1995;377:348–441. doi: 10.1038/377438a0. [DOI] [PubMed] [Google Scholar]
- 5.Budd S L, Nicholls D G. J Neurochem. 1996;66:403–411. doi: 10.1046/j.1471-4159.1996.66010403.x. [DOI] [PubMed] [Google Scholar]
- 6.Simpson P B, Mehotra S, Lange G D, Russel J T. J Biol Chem. 1997;272:22654–22661. doi: 10.1074/jbc.272.36.22654. [DOI] [PubMed] [Google Scholar]
- 7.Babcock D F, Herrington J, Goodwin P C, Park Y B, Hille B. J Cell Biol. 1997;136:833–844. doi: 10.1083/jcb.136.4.833. [DOI] [PMC free article] [PubMed] [Google Scholar]
- 8.Hoth M, Fanger C M, Lewis R S. J Cell Biol. 1997;137:633–648. doi: 10.1083/jcb.137.3.633. [DOI] [PMC free article] [PubMed] [Google Scholar]
- 9.Ichas F, Jouaville L S, Mazat J-P. Cell. 1997;89:1145–1153. doi: 10.1016/s0092-8674(00)80301-3. [DOI] [PubMed] [Google Scholar]
- 10.Berridge M J. Nature (London) 1993;361:315–325. doi: 10.1038/361315a0. [DOI] [PubMed] [Google Scholar]
- 11.Clapham D E. Cell. 1995;80:259–268. doi: 10.1016/0092-8674(95)90408-5. [DOI] [PubMed] [Google Scholar]
- 12.Hansford R G. Curr Top Bioenerg. 1980;10:217–277. [Google Scholar]
- 13.Denton R M, McCormack J G, Edgell N J. Biochem J. 1980;190:107–117. doi: 10.1042/bj1900107. [DOI] [PMC free article] [PubMed] [Google Scholar]
- 14.Rizzuto R, Pinton P, Carrington W, Fay F S, Fogarty K E, Lifshitz L M, Tuft R A, Pozzan T. Science. 1998;280:1763–1766. doi: 10.1126/science.280.5370.1763. [DOI] [PubMed] [Google Scholar]
- 15.McCormack J G, Denton R M. Dev Neurosci (Basel) 1993;15:165–173. doi: 10.1159/000111332. [DOI] [PubMed] [Google Scholar]
- 16.Hansford R G. J Bioenerg Biomembr. 1994;26:495–508. doi: 10.1007/BF00762734. [DOI] [PubMed] [Google Scholar]
- 17.Hajnóczky G, Robb-Gaspers L D, Seitz M B, Thomas A P. Cell. 1995;82:415–424. doi: 10.1016/0092-8674(95)90430-1. [DOI] [PubMed] [Google Scholar]
- 18.Rutter G A, Burnett P, Rizzuto R, Brini M, Murgia M, Pozzan T, Tavaré J M, Denton R M. Proc Natl Acad Sci USA. 1996;93:5489–5494. doi: 10.1073/pnas.93.11.5489. [DOI] [PMC free article] [PubMed] [Google Scholar]
- 19.Gandelman O, Allue I, Bowers K, Cobbold P. J Biolumin Chemilumin. 1994;9:363–371. doi: 10.1002/bio.1170090603. [DOI] [PubMed] [Google Scholar]
- 20.Allue I, Gandelman O, Dementieva E, Ugarova N, Cobbold P. Biochem J. 1996;319:463–469. doi: 10.1042/bj3190463. [DOI] [PMC free article] [PubMed] [Google Scholar]
- 21.Kennedy H J, Pouli A E, Ainscow E, Jouaville L S, Rizzuto R, Rutter G A. J Biol Chem. 1999;274:13281–13291. doi: 10.1074/jbc.274.19.13281. [DOI] [PubMed] [Google Scholar]
- 22.Brini M, De Giorgi F, Murgia M, Marsault R, Massimino M L, Cantini M, Rizzuto R, Pozzan T. Mol Biol Cell. 1997;8:129–143. doi: 10.1091/mbc.8.1.129. [DOI] [PMC free article] [PubMed] [Google Scholar]
- 23.Kennedy H J, Pouli A E, Jouaville L S, Rizzuto R, Rutter G A. Diabet Med. 1998;15:S13–S14. [Google Scholar]
- 24.De Wet J R, Wood K V, DeLuca M, Helinski D R, Subramani S. Mol Cell Biol. 1987;7:725–737. doi: 10.1128/mcb.7.2.725. [DOI] [PMC free article] [PubMed] [Google Scholar]
- 25.Rutter G A, Kennedy H J, Pouli A E. Diabetologia. 1998;41:A13. [Google Scholar]
- 26.Pozzan T, Rizzuto R, Volpe P, Meldolesi J. Physiol Rev. 1994;74:595–636. doi: 10.1152/physrev.1994.74.3.595. [DOI] [PubMed] [Google Scholar]
- 27.Pedersen P L. Prog Exp Tumor Res. 1978;22:190–274. doi: 10.1159/000401202. [DOI] [PubMed] [Google Scholar]
- 28.Robb-Gaspers L D, Burnett P, Rutter G A, Denton R M, Rizzuto R, Thomas A P. EMBO J. 1998;17:4987–5000. doi: 10.1093/emboj/17.17.4987. [DOI] [PMC free article] [PubMed] [Google Scholar]
- 29.Chacon E, Ohata H, Harper I S, Trollinger D R, Herman B, Lemasters J J. FEBS Lett. 1996;382:31–36. doi: 10.1016/0014-5793(96)00138-x. [DOI] [PubMed] [Google Scholar]
- 30.Trollinger D R, Cascio W E, Lemasters J J. Biochem Biophys Res Commun. 1997;236:738–742. doi: 10.1006/bbrc.1997.7042. [DOI] [PubMed] [Google Scholar]
- 31.Hofer A M, Landolfi B, Debellis L, Pozzan T, Curci S. EMBO J. 1998;17:1986–1995. doi: 10.1093/emboj/17.7.1986. [DOI] [PMC free article] [PubMed] [Google Scholar]
- 32.Dolmetsch R E, Xu K, Lewis R S. Nature (London) 1998;392:933–936. doi: 10.1038/31960. [DOI] [PubMed] [Google Scholar]
- 33.Li W H, Llopis J, Whitney M, Zlokarnik G, Tsien R Y. Nature (London) 1998;392:936–941. doi: 10.1038/31965. [DOI] [PubMed] [Google Scholar]
- 34.Halestrap A P. Biochim Biophys Acta. 1989;973:355–382. doi: 10.1016/s0005-2728(89)80378-0. [DOI] [PubMed] [Google Scholar]
- 35.Harris D A, Das A M. Biochem J. 1991;280:561–573. doi: 10.1042/bj2800561. [DOI] [PMC free article] [PubMed] [Google Scholar]


