Abstract
The time inside the mutant selection window (MSW), TMSW, appears to be less predictive of the selection of fluoroquinolone-resistant Staphylococcus aureus than is the ratio of the area under the concentration-time curve (AUC) to the MIC. This observation might be attributed to the fact that TMSW does not consider the actual position of simulated antibiotic concentrations inside the MSW, which also might influence the amplification of resistant mutants. To test this hypothesis, the enrichment of ciprofloxacin-resistant S. aureus was studied at ciprofloxacin (CIP) concentrations that oscillate near the mutant prevention concentration (MPC), i.e., closer to the top of the MSW (“upper case”), and closer to the MIC, i.e., at the lower limit of the MSW (“lower case”) at the same TMSW. Two methicillin-resistant strains of S. aureus, ATCC 6538 and ATCC 43300 (MICs of 0.25 and 0.5 mg/liter, respectively, and MPCs of 4 and 2 mg/liter, respectively), were exposed to twice-daily CIP treatments for three consecutive days. With S. aureus ATCC 6538, the simulated ratios of the AUC at 24 h (AUC24) to the MIC were 50 and 260 h (TMSW 75% of the dosing interval). With S. aureus ATCC 43300, the simulated AUC24/MICs were 30 and 100 h (TMSW 56%). With each organism, mutants resistant to CIP were enriched in an AUC24/MIC-dependent manner: the higher the AUC24/MIC ratio, the lower the growth on CIP-containing plates. For example, the area under the time-kill curve of mutants resistant to 4× MIC of CIP in the upper case was three times smaller than that in the lower case for both S. aureus strains. Similar differences were seen at the higher (8× MIC) and lower (2× MIC) CIP concentrations. These data highlight differences in the selection of resistant S. aureus, depending on the position of simulated concentrations inside the MSW at a given TMSW. This explains why TMSW-based predictions of resistance are less accurate than those based on AUC/MIC and AUC/MPC.
Emerging bacterial resistance has stimulated a thorough evaluation of novel antibiotics, with a special emphasis on the abilities of these antibiotics to prevent the enrichment of resistant mutants. Over the last 5 years, this phenomenon has been studied intensively in vitro by using dynamic models; the results of these studies have recently been reviewed and discussed in detail elsewhere (9). Previously reported complex relationships between the enrichment of resistant mutants and in vitro-simulated pharmacokinetics of fluoroquinolones (5-7, 16) and glycopeptides (8) support the hypothesis of the mutant selection window (MSW) (14). Based on these studies, both mutant selection and the concomitant loss in susceptibility depend on the simulated ratio of area under the curve (AUC) to the MIC in a bell-shaped manner. Together with AUC/MIC, the time inside MSW (TMSW) has been proposed as a predictor of resistance (5), although it appeared to be less predictive of the selection of fluoroquinolone-resistant and, especially, glycopeptide-resistant Staphylococcus aureus than was the AUC/MIC ratio (1, 6-8, 12). This observation might be attributed to the fact that TMSW does not consider the position of simulated antibiotic concentrations within the MSW, which also might influence the amplification of resistant mutants (15).
To test this hypothesis, the enrichment of ciprofloxacin-resistant S. aureus was studied at ciprofloxacin concentrations oscillating around the mutant prevention concentration (MPC), i.e., closer to the top of the MSW (“upper case”) and closer to the MIC, i.e., at the lower boundary of the MSW (“lower case”) over the same TMSW. To make this comparison more comprehensive, S. aureus strains with distinctly different MPC/MIC ratios were chosen.
(This study was presented at the 47th Interscience Conference on Antimicrobial Agents and Chemotherapy, Chicago, IL, 17 to 20 September 2007.)
MATERIALS AND METHODS
Antimicrobial agents, bacterial strains, and susceptibility testing.
Ciprofloxacin powder was kindly provided by Bayer Corporation (West Haven, CT). Two methicillin-resistant strains of S. aureus were selected for the study, S. aureus ATCC 6538 and S. aureus ATCC 43300. The MICs were determined prior to, during, and after a 3-day-simulated treatment with ciprofloxacin. Susceptibility testing was performed in triplicate by broth microdilution techniques at 24 h postexposure, with the organism grown in Ca2+- and Mg2+-supplemented Mueller-Hinton broth (MHB) at an inoculum size of 5 × 10⁵ CFU/ml. The ciprofloxacin MICs for S. aureus ATCC 6538 and 43300 were 0.25 and 0.5 μg/ml, respectively.
The MPCs were determined as described elsewhere (14). Briefly, the tested microorganisms were cultured in MHB and incubated for 24 h. Then, the suspension was centrifuged (4,000 × g for 10 min) and resuspended in MHB to yield a concentration of 1010 CFU/ml. A series of agar plates containing known ciprofloxacin concentrations was then inoculated with ∼1010 CFU of S. aureus. The inoculated plates were incubated for 48 h at 37°C and screened visually for growth. To estimate the MPC, logarithms of bacterial numbers were plotted against ciprofloxacin concentrations. The MPC was taken as the point where the plot intersected the x axis, i.e., the lowest ciprofloxacin concentration that completely inhibited growth. The MPCs for S. aureus ATCC 6538 and ATCC 43300 were estimated at 4 and 2 μg/ml, respectively.
Thus, in terms of the MPC/MIC ratio, the two organisms differed over a fourfold range, from 4 (for S. aureus ATCC 43300) to 16 (for S. aureus ATCC 6538).
Simulated pharmacokinetic profiles.
A series of monoexponential profiles that mimic twice-daily dosing of ciprofloxacin was simulated with a half-life (T1/2) of 4 h. The simulated T1/2s represented weighted means of the values reported for humans: 3.2 to 5.0 h (13).
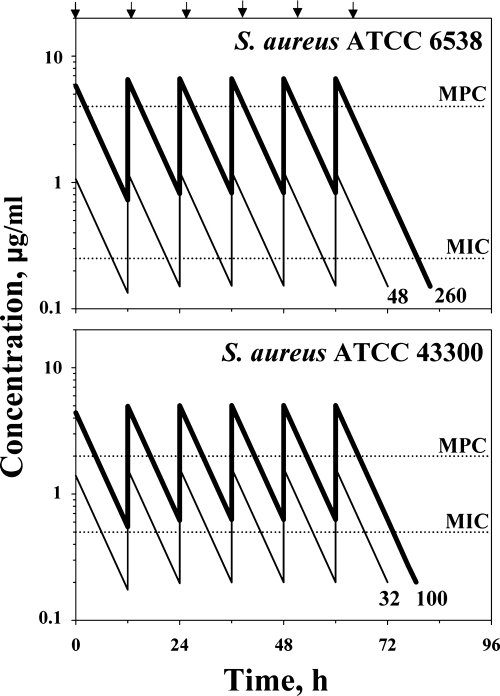
To ensure the selection of resistant mutants that can occur at TMSWs of more than 20 to 50% of the doing interval (1, 5), the simulated TMSWs were designed to be more than 50%. To provide the same TMSWs for the lower and upper cases, simulated ratios of 24-h AUC (AUC24) to MIC were designed at 50 h (lower case) and 260 h (upper case) with S. aureus ATCC 6538 (TMSW 75% of the dosing interval) and at 30 h (lower case) and 100 h (upper case) with S. aureus ATCC 43300 (TMSW 56%). Simulated concentration-time profiles are shown in Fig. 1.
FIG. 1.
Pharmacokinetic profiles of ciprofloxacin simulated in studies with two strains of S. aureus. Lower case CIP concentrations are indicated by thin lines and upper case CIP concentrations are indicated by bold lines. Arrows reflect ciprofloxacin administration. The respective AUC24/MIC ratio (h) is indicated by number at the end of each curve.
In vitro dynamic model.
A previously described dynamic model (3) was used in the study. Briefly, the model consisted of two connected flasks (one containing fresh MHB and the other with a magnetic stirrer, the central unit), with the same broth containing either a bacterial culture alone (control growth experiments) or a bacterial culture plus antibiotic (killing/regrowth experiments). Peristaltic pumps circulated fresh nutrient medium to the flasks and from the central 60-ml unit at a flow rate of 10.4 ml/h. The clearance provided by this flow rate, plus the volume of the central unit, ensured monoexponential elimination of ciprofloxacin bacteria from the system at an elimination rate constant of 0.17 h−1.
The system was filled with sterile MHB and placed in an incubator at 37°C. The central unit was inoculated with an 18-h culture of S. aureus. After a 0.5-h incubation of the bacteria, the resulting exponentially growing cultures reached approximately 108 CFU/ml (6 × 10⁹ CFU per 60-ml central compartment) and ciprofloxacin was injected into the central unit. The duration of the experiment was defined in each case as the time after the last dose when ciprofloxacin-exposed bacteria reached the maximum numbers observed in the absence of antibiotic (108 CFU/ml). All experiments were performed at least in duplicate within a 2-week interval. The reliability of ciprofloxacin pharmacokinetic simulations and the high reproducibility of the time-kill curves provided by the model have previously been reported (4).
Quantitation of the antimicrobial effect and susceptibility changes.
In each experiment, multiple sampling of bacteria-containing medium from the central compartment was performed throughout the observation period. One-hundred-microliter samples were serially diluted as appropriate and plated onto Mueller-Hinton agar plates containing 0×, 2×, 4×, 8×, and 16× MIC of ciprofloxacin. The lower limit of accurate detection was 200 CFU/ml.
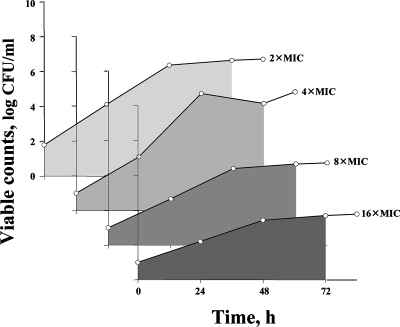
The cumulative effect of each simulated treatment on the susceptible S. aureus subpopulations was expressed by area under the time-kill curve (AUBC [3]) measured from time zero to 72 h. A similar analysis of the time courses of mutants grown on ciprofloxacin-containing plates allowed calculation of the AUBC (AUBCM) over the same time interval. An example of the AUBCM determination is shown in Fig. 2.
FIG. 2.
AUBCM analysis of the time-kill curves with mutants grown on plates containing ciprofloxacin (S. aureus ATCC 43300 exposed to the higher ciprofloxacin concentrations [upper case]). Shaded areas reflect AUBCMs.
To reveal changes in susceptibility, ciprofloxacin MICs of bacterial cultures sampled from the model were determined 24, 48, and 72 h after beginning treatment and at the end of the observation period if it was longer than 72 h. The final MIC (MICfinal) was then related to the initial value (MICinitial).
RESULTS
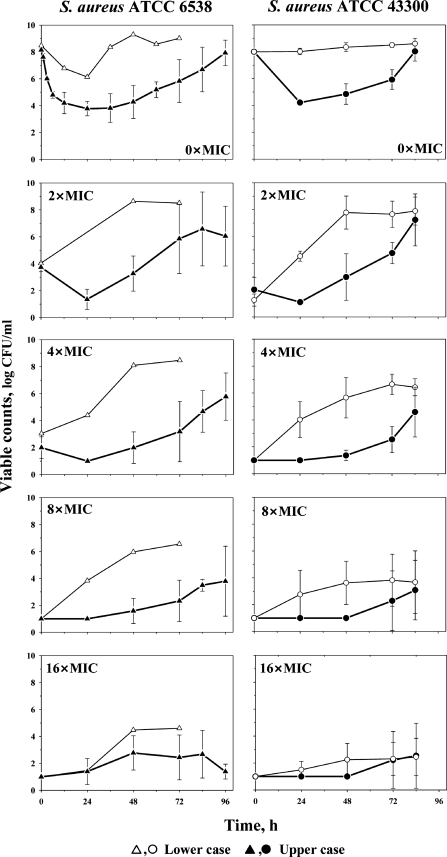
Time courses of ciprofloxacin-exposed S. aureus ATCC 6538 and 43300 grown on antibiotic-free and antibiotic-containing medium are shown in Fig. 3. With each organism, both the extent of killing of the susceptible subpopulation and the time to regrowth (Fig. 3) increased with an increase of the simulated AUC24/MIC ratio. A 5-fold increase in the simulated AUC24/MIC (from 50 to 260 h) led to a 1.7-fold decrease in the AUBC and, by that, to the same increase in the cumulative effect of ciprofloxacin on S. aureus ATCC 6538. With S. aureus ATCC 43300, a 3-fold increase in the simulated AUC24/MIC (from 30 to 100 h) was accompanied by a 1.5-fold increase in the cumulative antimicrobial effect.
FIG. 3.
Time courses of ciprofloxacin-exposed S. aureus ATCC 6538 and 43300 indicated by open symbols with thin lines (lower case) and filled symbols with bold lines (upper case). Total bacterial counts (0× MIC) and subpopulations resistant to ciprofloxacin (from 2× MIC to 16× MIC) in samples collected from the in vitro model. Results are expressed as means ± standard deviations (error bars).
As seen on the lower four plots shown in Fig. 3, mutants resistant to 2×, 4×, and 8× MIC of ciprofloxacin were enriched also in an AUC24/MIC-dependent manner. Bacterial growth on antibiotic-containing plates started earlier and was more pronounced at the smaller AUC24/MICs (lower case) than at the higher AUC24/MICs (upper case). At the highest ciprofloxacin concentrations on plates (16× MIC), the AUC24/MIC-associated differences in the growth of mutants were minimal with S. aureus ATCC 6538 and almost negligible with S. aureus ATCC 43300. In simulations of the lower case, the susceptible subpopulation of S. aureus ATCC 6538 in samples withdrawn from the model after a 48-h exposure was almost completely replaced by mutants resistant to 2× and 4× MIC of ciprofloxacin. By the same time, susceptible cells of S. aureus ATCC 43300 were replaced by mutants resistant to 2× MIC and, by 72 h, these cells were replaced by mutants resistant to 4× MIC of ciprofloxacin. In simulations of the upper case with both organisms, similar replacement occurred only by mutants resistant to 2× MIC.
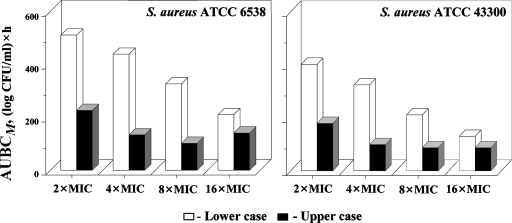
The described differences between the lower and upper case simulations were confirmed by the AUBCM analysis of the time courses of ciprofloxacin-resistant mutants of S. aureus ATCC 6538 and 43300 (Fig. 4). The cumulative production of the mutants resistant to 2×, 4×, and 8× MIC of ciprofloxacin appeared more than twofold greater in the lower case than in the upper case. These differences are consistent with a slightly more pronounced loss in susceptibility of staphylococci in the lower case than in the upper case, although this trend was not statistically significant (data not shown).
FIG. 4.
Enrichment of S. aureus resistant to 2×, 4×, 8×, and 16× MIC of ciprofloxacin expressed by AUBC.
DISCUSSION
This study exposed two strains of S. aureus to ciprofloxacin concentrations that fell into the MSW for more than half of the dosing interval, with TMSWs of 56% with S. aureus ATCC 43300 and 75% with S. aureus ATCC 6538. As expected from the first study of this type (5), resistant mutants were enriched at these conditions, with a concomitant loss in susceptibility. Although the same TMSW was designed with each organism, this enrichment was more pronounced at ciprofloxacin concentrations that were closer to the lower limit of the MSW than to the upper limit. Due to the fact that the numbers of resistant mutants were determined during treatment as well as after treatment, the regimen-associated differences in mutant selection could be presented objectively, by using the areas under the time courses of mutants grown on antibiotic-supplemented plates. For both S. aureus ATCC 6538 and 43300 mutants resistant to 2×, 4×, and 8× MIC of ciprofloxacin, the upper case was associated with AUBCMs more than twofold smaller than those of the lower case. Similar position-associated differences in the selection of mutants of these two strains have recently been reported in a dynamic model study that simulates constant ciprofloxacin concentrations (TMSW 100%) (2). Also, these findings are consistent with in vitro data reported at static conditions, in which many more mutants were observed at antibiotic concentrations in the lower than in the upper portions of the MSW (2, 15).
Overall, the present study with two strains of S. aureus with different MPC/MIC ratios supports the MSW hypothesis and provides an explanation for the limited ability of TMSW to predict the selection of fluoroquinolone-resistant staphylococci. Indeed, the enrichment of ciprofloxacin-resistant mutants depends not only on the TMSW but also on the position of antibiotic concentrations within the MSW, making TMSW-based predictions of resistance less accurate than those based on AUC/MIC or AUC/MPC. Also, this study suggests that together with the population analysis profile method (10, 11), the AUBCM analysis is useful for objective presentation of resistance data.
Acknowledgments
Each author certifies that he or she has no commercial association that might pose a conflict of interest in connection with this article.
Footnotes
Published ahead of print on 31 March 2008.
REFERENCES
- 1.Campion, J. J., P. J. McNamara, and M. E. Evans. 2004. Evolution of ciprofloxacin-resistant Staphylococcus aureus in in vitro pharmacokinetic environments. Antimicrob. Agents Chemother. 48:4733-4744. [DOI] [PMC free article] [PubMed] [Google Scholar]
- 2.Firsov, A., I. Lubenko, M. Smirnova, E. Strukova, and S. Zinner. 2008. Heterogeneity of the mutant selection window: selection of resistant Staphylococcus aureus at ciprofloxacin constant concentrations simulated close to the MIC or the mutant prevention concentration. Clin. Microbiol. Infect. 14(Suppl. 7):S674. [Google Scholar]
- 3.Firsov, A. A., S. N. Vostrov, A. A. Shevchenko, and G. Cornaglia. 1997. Parameters of bacterial killing and regrowth kinetics and antimicrobial effect examined in terms of area under the concentration-time curve relationships: action of ciprofloxacin against Escherichia coli in an in vitro dynamic model. Antimicrob. Agents Chemother. 41:1281-1287. [DOI] [PMC free article] [PubMed] [Google Scholar]
- 4.Firsov, A. A., A. A. Shevchenko, S. N. Vostrov, and S. H. Zinner. 1998. Inter- and intra-quinolone predictors of antimicrobial effect in an in vitro dynamic model: new insight into a widely used concept. Antimicrob. Agents Chemother. 42:659-665. [DOI] [PMC free article] [PubMed] [Google Scholar]
- 5.Firsov, A. A., S. N. Vostrov, I. Y. Lubenko, K. Drlica, Y. A. Portnoy, and S. H. Zinner. 2003. In vitro pharmacodynamic evaluation of the mutant selection window hypothesis using four fluoroquinolones against Staphylococcus aureus. Antimicrob. Agents Chemother. 47:1604-1613. [DOI] [PMC free article] [PubMed] [Google Scholar]
- 6.Firsov, A. A., S. N. Vostrov, I. Y. Lubenko, A. P. Arzamastsev, Y. A. Portnoy, and S. H. Zinner. 2004. ABT-492 and levofloxacin: comparison of their pharmacodynamics and their abilities to prevent the selection of resistant Staphylococcus aureus in an in vitro dynamic model. J. Antimicrob. Chemother. 54:178-186. [DOI] [PubMed] [Google Scholar]
- 7.Firsov, A. A., S. N. Vostrov, I. Y. Lubenko, S. H. Zinner, and Y. A. Portnoy. 2004. Concentration-dependent changes in the susceptibility and killing of Staphylococcus aureus in an in vitro dynamic model that simulates normal and impaired gatifloxacin elimination. Int. J. Antimicrob. Agents 23:60-66. [DOI] [PubMed] [Google Scholar]
- 8.Firsov, A. A., M. V. Smirnova, I. Y. Lubenko, S. N. Vostrov, Y. A. Portnoy, and S. H. Zinner. 2006. Testing the mutant selection window hypothesis with Staphylococcus aureus exposed to daptomycin and vancomycin in an in vitro dynamic model. J. Antimicrob. Chemother. 58:1185-1192. [DOI] [PubMed] [Google Scholar]
- 9.Firsov, A. A., S. H. Zinner, and I. Y. Lubenko. 2007. In vitro dynamic models as tools to predict antibiotic pharmacodynamics, p. 45-78. In C. H. Nightingale, P. G. Ambrose, G. L. Drusano, and T. Murakawa (ed.), Antimicrobial pharmacodynamics in theory and clinical practice, 2nd ed. Informa Healthcare USA, Inc., New York, NY.
- 10.MacGowan, A. P., and K. E. Bowker. 2003. Mechanism of fluoroquinolone resistance is an important factor in determining the antimicrobial effect of gemifloxacin against Streptococcus pneumoniae in an in vitro pharmacokinetic model. Antimicrob. Agents Chemother. 47:1096-1100. [DOI] [PMC free article] [PubMed] [Google Scholar]
- 11.MacGowan, A. P., C. A. Rogers, H. A. Holt, and K. E. Bowker. 2003. Activities of moxifloxacin against, and emergence of resistance in, Streptococcus pneumoniae and Pseudomonas aeruginosa in an in vitro pharmacokinetic model. Antimicrob. Agents Chemother. 47:1088-1095. [DOI] [PMC free article] [PubMed] [Google Scholar]
- 12.Olofsson, S. K., L. L. Marcusson, P. Komp Lindgren, D. Hughes, and O. Cars. 2006. Selection of ciprofloxacin resistance in Escherichia coli in an in vitro kinetic model: relation between drug exposure and mutant prevention concentration. J. Antimicrob. Chemother. 57:1116-1121. [DOI] [PubMed] [Google Scholar]
- 13.Wilson, A. P. R., and R. N. Grüneberg. 1997. Ciprofloxacin: 10 years of clinical experience. Maxim Medical, Oxford, United Kingdom.
- 14.Zhao, X., and K. Drlica. 2001. Restricting the selection of antibiotic-resistant mutants: a general strategy derived from fluoroquinolone studies. Clin. Infect. Dis. 33:147-156. [DOI] [PubMed] [Google Scholar]
- 15.Zhou, J., Y. Dong, X. Zhao, S. Lee, A. Amin, S. Ramaswamy, J. Domagala, J. M. Musser, and K. Drlica. 2000. Selection of antibiotic-resistant bacterial mutants: allelic diversity among fluoroquinolone-resistant mutations. J. Infect. Dis. 182:517-525. [DOI] [PubMed] [Google Scholar]
- 16.Zinner, S. H., I. Y. Lubenko, D. Gilbert, K. Simmons, X. Zhao, K. Drlica, and A. A. Firsov. 2003. Emergence of resistant Streptococcus pneumoniae in an in vitro dynamic model that simulates moxifloxacin concentrations inside and outside the mutant selection window: related changes in susceptibility, resistance frequency and bacterial killing. J. Antimicrob. Chemother. 52:616-622. [DOI] [PubMed] [Google Scholar]


