Abstract
Insulin-stimulated GLUT4 translocation to the plasma membrane constitutes a key process for blood glucose control. However, convenient and robust assays to monitor this dynamic process in real time are lacking, which hinders current progress toward elucidation of the underlying molecular events as well as screens for drugs targeting this particular pathway. Here, we have developed a novel dual colored probe to monitor the translocation process of GLUT4 based on dual color fluorescence measurement. We demonstrate that this probe is more than an order of magnitude more sensitive than the current technology for detecting fusion events from single GLUT4 storage vesicles (GSVs). A small fraction of fusion events were found to be of the “kiss-and-run” type. For the first time, we show that insulin stimulation evokes a ∼40-fold increase in the fusion of GSVs in 3T3-L1 adipocytes, compared with basal conditions. The probe can also be used to monitor the prefusion behavior of GSVs. By quantifying both the docking and fusion rates simultaneously, we demonstrate a proportional inhibition in both docking and fusion of GSVs by a dominant negative mutant of AS160, indicating a role for AS160 in the docking of GSVs but not in the regulation of GSV fusion after docking.
Type II diabetes mellitus is a devastating metabolic disease characterized by insulin resistance and aberrant glucose metabolism. One of the major steps regulated by insulin is the removal of glucose from the blood stream into muscle and fat cells. This is mediated by redistribution of the insulin-responsive glucose transporter GLUT4 (1, 2) from intracellular GLUT4 storage vesicles (GSVs)3 to the plasma membrane (PM) (3). Reduced insulin-stimulated glucose transport has been proposed as one of the earliest metabolic abnormalities observed during the natural course of type 2 diabetes (4, 5). Despite extensive efforts, the mechanism by which insulin signaling stimulates the translocation of GLUT4 remains elusive. This is not only due to the complexity of both the insulin signaling and GLUT4 trafficking pathways but also to the lack of robust, quantitative, and easy-to-use assays to monitor the in vivo GLUT4 translocation process in real time.
Conventional methods used to study GLUT4 distribution include using membrane fractionation and immunoblotting to quantify GLUT4 content in different fractions (6). Alternatively, by inserting an epitope (e.g. hemagglutinin tag) into the extracellular domain of GLUT4, one can visualize the membrane distribution of GLUT4 by anti-hemagglutinin antibody staining employing immunofluorescence microscopy (7). Although samples can be prepared at different time points after insulin stimulation, allowing for some time resolution, these methods are generally tedious to perform, hard to quantify/compare, and not in real time. Recently, total internal reflection fluorescence microscopy (TIRFM) has been employed to investigate GFP-labeled GLUT4 translocation (8–10). The evanescent field generated from a TIRFM selectively illuminates GLUT4-EGFP within a few hundreds of nanometers beneath the PM (11) and thus images those GLUT4-EGFP molecules in the PM or in vesicles very close to the PM. The translocation of GLUT4-EGFP into the PM will result in an increase in the total fluorescence under TIRFM. However, it is not clear whether the fluorescence increase in the total internal reflection fluorescence zone is due to an increase in the insertion of GLUT4 in the PM or to more docked/recruited vesicles close to the PM. To solve this problem, time-resolved TIRFM has been employed to track and analyze the dynamics of single GSVs (8, 12). It has been demonstrated that fusion of GSVs can be monitored by scrutinizing the radial diffusion pattern of fluorescence. Additionally, the docking/tethering of GSVs can be inferred by analyzing the mobility of vesicles (8, 13). However, these methods are not straightforward and require extensive training in TIRFM imaging and image analysis. In conclusion, what is needed is a robust, easy-to-apply real time method that allows the dynamics of GLUT4 translocation to be visualized in their natural context.
AS160 has recently been identified as a substrate of Akt that functions in GLUT4 trafficking (14). AS160 possesses a Rab GTPase-activating protein domain, so it may regulate the activity of a Rab protein that is involved in GLUT4 trafficking. AS160 is phosphorylated at four separate sites by Akt. It has previously been shown that overexpression of an AS160 mutant (AS160-4P) in which each of these phosphorylation sites has been mutated inhibits insulin-stimulated GLUT4 translocation in adipocytes (14). However, the exact site of action of AS160 along the GLUT4 trafficking pathway remains to be identified. Previously, we showed that overexpression of AS160-4P blocked the docking of GSVs to the plasma membrane (13). However, it is not clear whether insulin-induced phosphorylation of AS160 participates in the insulin-regulated later steps after docking. Without a reliable fusion assay for GSVs, we were not able to address this question at that time.
In the current study, we developed a probe by attaching the pH-sensitive fluorescence protein pHluorin (15) to the luminal terminus of IRAP and the red fluorescence protein Tdimer2 (16) to the cytosolic end of IRAP. The resultant dual colored probe (TDimer2-IRAP-pHluorin) co-localizes with GLUT4-EGFP and allows for easy identification of the fusion of single GSVs, as well as their prefusion history. By quantifying both the docking and fusion rates simultaneously, we demonstrate a proportional inhibition in both the docking and fusion of GSVs by AS160-4P, indicating a role for AS160 in the docking of GSVs but not in the control of GSV fusion after docking. Moreover, we demonstrate that this probe can be used to monitor GLUT4 translocation in real time from live cells simply by ratiometric fluorescence measurement.
EXPERIMENTAL PROCEDURES
DNA Construction—To generate the pHluorin-N1 vector, the pH-sensitive fluorescence protein pHluorin (kindly provided by Dr. James Rothman) was used to substitute for EGFP in pEGFP-N1 (Clontech Laboratories, Palo Alto, CA). The pHluorin primers used were: forward, 5′-GATCGGATCCCACCATGAGTAAAGGAGAAGAAC-3′, and reverse, 5′-GATCGCGGCCGCTTATTTGTATAGTTCATCCATG-3′. Plasmid GLUT4-EGFP was constructed as previously described (12). Total 3T3-L1 RNA was extracted with the RNeasy mini kit (Qiagen) following the manufacturer's instructions, and RNA integrity was identified by formaldehyde electrophoresis. The IRAP cDNA was generated using reverse transcriptase. The complete coding sequence of IRAP was obtained by high fidelity PCR amplification with Pfu DNA polymerase (Stratagene, La Jolla, CA). The specific forward and reverse primers used in the experiment were 5′-GATCCTCGAGCATGGAGTCCTTTACCAATGATCGGCTTCAG-3′ (forward) and 5′-GCAAGGATCCTTCAGCCACTGGGAGAGCGTTTTCAGATTC-3′ (reverse). The N-terminal 393-bp fragment of IRAP was then amplified with Pfu DNA polymerase (Stratagen, La Jolla, CA). The primers used were: forward, 5′-GATCCTCGAGCCACCACCATGGAGTCCTTTACCAATGATCGG-3′, and reverse, 5′-GCAAGGATCCGGCAGTAGATAAATCACCATGATTACAGAGACC-3′. For construction of the IRAP-pHluorin fusion protein, the N-terminal 393-bp PCR fragment of IRAP was digested with XhoI and BamHI restriction enzymes and ligated into the subclone vector pHluorin-N1. To generate the IRAP-Tdimer2 fusion protein, the coding sequence for the red fluorescence protein Tdimer2 was digested from the subclone vector pcDNA3.1-TDimer2 (16, 17) and used to substitute for pHluorin in the N1-IRAP-pHluorin vector. For construction of Tdimer2-IRAP-pHluorin, the Tdimer2 coding sequence was amplified and cloned into N1-IRAP-pHluorin. The primers used were as follows: forward, 5′-GAAGCTAGCGACCATGGTGGCCTCCTCCGAGGACG-3′, and reverse, 5′-GCTGGATATCTGCAAGATCTCAGGAACAGGTGGTGG-3′. Construct integrity was verified using DNA sequencing analysis provided by Invitrogen.
Cell Culture and Transfection—3T3-L1 cells were cultured in high glucose Dulbecco's modified Eagle's medium (Invitrogen) supplemented with 10% newborn calf serum (Invitrogen) at 37 °C and 5% CO2. One day after confluence, the cells were switched into differentiation medium containing 10% fetal bovine serum (Invitrogen), 1 μm bovine insulin, 0.5 mm 3-isobutyl-1-methylxanthine, and 0.25 m dexamethasone. Two days later, the medium was replaced with 10% fetal bovine serum and 1 μm insulin for another 2 days. The cells were then maintained in Dulbecco's modified Eagle's medium with 10% fetal bovine serum. Seven days after differentiation, 3T3-L1 adipocytes were treated with 0.05% trypsin-EDTA (Invitrogen) and washed twice with OPTI-MEM (Invitrogen) by centrifugation at 1500 rpm at room temperature. The cells were resuspended in OPTI-MEM and 30 μg of IRAP-pHluorin or TDimer2-IRAP-pHluorin, or 30 μg of TDimer2-IRAP-pHluorin plus 60 μg AS160-4P plasmid were added to a final volume of 800 μl. Electroporation was performed at 360 V for 10 ms using a BTX 830 electroporator (Biocompare, South San Francisco, CA), and the cells were plated on coverslips coated with poly-l-lysine. The experiments were performed 2 days after transfection in KRBB solution containing 129 mm NaCl, 4.7 mm KCl, 1.2 mm KH2PO4, 5 mm NaHCO3, 10 mm Hepes, 3 mm glucose, 2.5 mm CaCl2, 1.2 mm MgCl2, 0.1% bovine serum albumin (pH 7.2). Prior to imaging experiments, adipocytes were serum-starved for at least 2 h and transferred to a home-made closed perfusion chamber. Insulin stimulation was applied at a concentration of 100 nm throughout the study. Unless otherwise stated, all of the drugs were purchased from Sigma.
Western Blotting—Cell extracts were prepared by washing the cells with phosphate-buffered saline and then extracting proteins with lysis buffer (10 mm Tris, 3 mm CaCl2, 2 mm MgCl2, 2.5% Nonidet P-40, pH 7.5). Samples from these cell lysates were denatured and subjected to SDS-PAGE using a 12% (w/v) running gel and analyzed by standard Western blotting techniques. The expression of endogenous IRAP and IRAP-pHluorin were identified and quantified using an anti-IRAP polyclonal antibody (1:1500) (gift from Dr. David James).
Fluorescence Imaging—The cells were viewed with an Olympus FV500 confocal laser scanning biological microscope with a 60× (NA = 1.40) oil objective after transfection. pHluorin and TDimer2 fluorescence were both excited with a 488-nm argon laser. The images were acquired and analyzed using FLUOVIEW (Olympus Optical Co., Tokyo, Japan) and Photoshop 6.0. The TIRFM setup was constructed using an Olympus IX71 microscope based on the prism-less and through-the-lens configuration, as previously described (12). Dual color images were collected at 5 Hz by a PCO EMCCD (PCO, Kelheim, Germany) at the left lateral port of the microscope after using a GFP/DsRed dual view microimager (Optical Insights, Tucson, AZ). The penetration depth of the evanescent field was estimated to be 113 nm by measuring the incidence angle of the 488-nm laser beam with a prism (n = 1.5218). For ratiometric fluorescence measurement under epi-fluorescence illumination, excitation was selected at 480 nm from a TILL monochromator (Polychrome V, TILL Photonics, GmbH).
Calculation of Surface Fraction—We designed experiments to quantify the relative amount of TDimer2-IRAP-pHluorin on the cell surface compared with the total amount. 3T3-L1 adipocytes were first incubated in nonpermeating normal wash solution (pH 7.4) after 48 h of transfection. The external solution was then changed sequentially to nonpermeating pH 5.5 solution, permeating pH 7.4 NH4Cl solution and normal wash solution. The surface fraction of TDimer2-IRAP-pHluorin and the pH of the intracellular compartment (pHi) were determined as previous described (18).
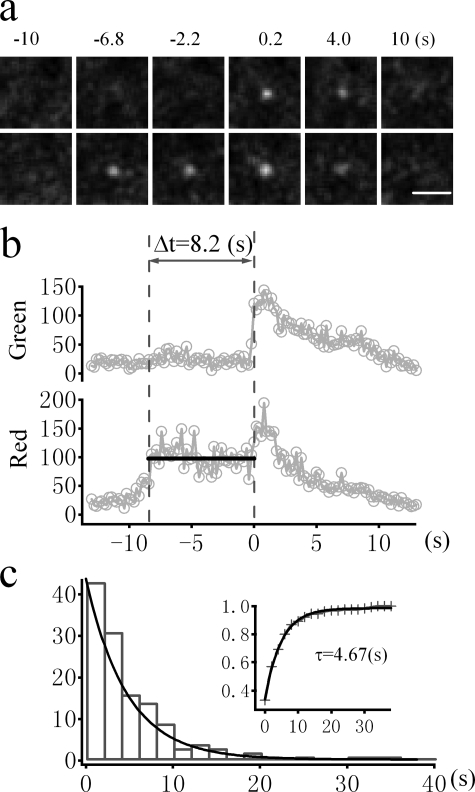
Image Analysis—Image pretreatment and analysis were based on the protocol described previously (13). A fusion event was defined when the fluorescence increase exceeded five times the standard deviation of the background fluorescence (see Fig. 3d). We then counted the number of fusion events that occurred every 20 s and derived the fusion rate. For analyzing the docking state prior to fusion using TDimer2-IRAP-pHluorin, we first identified the fusion events according to the green fluorescence. Subsequently, we tracked back to the first frame when the TDimer2 fluorescence was stabilized. This time was taken as the initial docking time (Fig. 4b). Another criteria imposed as a requirement for docking was that during the interval between initial docking and fusion, the vesicle should remain immobilized with a three-dimensional displacement < 0.067 μm, as previously described (13).
FIGURE 3.
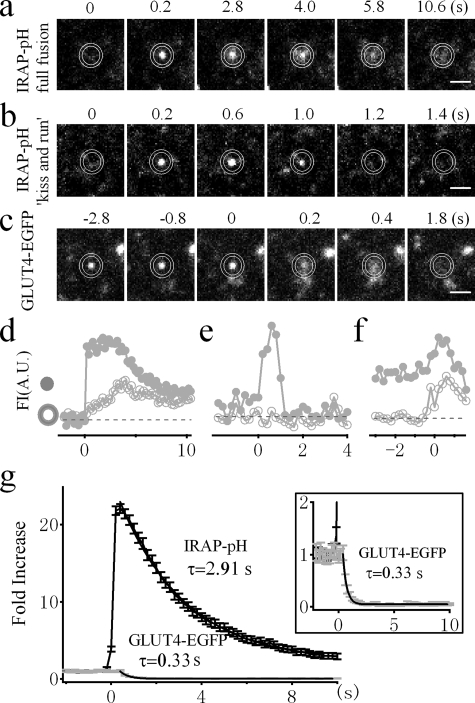
Improved fusion detection by IRAP-pHluorin over GLUT4-EGFP. a, sequential images of a single GSV labeled with IRAP-pHluorin as it fully fuses with the PM. b, sequential images of a single GSV labeled with IRAP-pHluorin undergoing kiss-and-run fusion. c, sequential images of a single GSV labeled with GLUT4-EGFP as it docks at and then fuses with the PM. Bars, 1 μm. d–f, time courses of fluorescence intensity (FI) from the inner circle (gray circles) and annulus (open circles) in arbitrary units (A.U.) for the vesicles shown in a–c, respectively. g, comparison of the average fluorescence changes during fusion detected by either IRAP-pHluorin (black) or GLUT4-EGFP (gray). Fluorescence intensities were normalized to prefusion values. The error bars represent S.E. All of the fusion events were collected in the presence of insulin because spontaneous fusion in the absence of insulin is rare. A single exponential fit to the averaged fluorescence decay after fusion reveals time constants of 2.91 s (n = 290 vesicles from seven cells) and 0.33 s (n = 30 vesicles from nine cells) for IRAP-pHluorin and GLUT4-EGFP, respectively. The fluorescence decay of GLUT4-EGFP is amplified in the inset.
FIGURE 4.
Visualizing prefusion history using the dual colored marker, TDimer2-IRAP-pHluorin (RITS). a, sequential images of a single GSV labeled with TDimer2-IRAP-pHluorin undergoing insulin-stimulated exocytosis. The time indicated is relative to the onset of fusion. Bar, 1 μm. b, the fluorescence intensities of the green and red channels were averaged from 1-μm-diameter circles enclosing the vesicle. The second vertical dashed line marks the time of fusion, and the duration between two vertical dashed lines measures the dwell time in the docking/priming stage prior to fusion. c, histogram distribution of the latencies between docking and fusion for insulin-stimulated fusion events. Superimposed is the exponential fit with a time constant of 4.67s (n = 129 vesicles from 12 cells). The cumulative distribution of the fusion latency is displayed in the inset.
For normally distributed data, population averages are given as the means ± S.E., and statistical significance was tested with Student's t test.
RESULTS
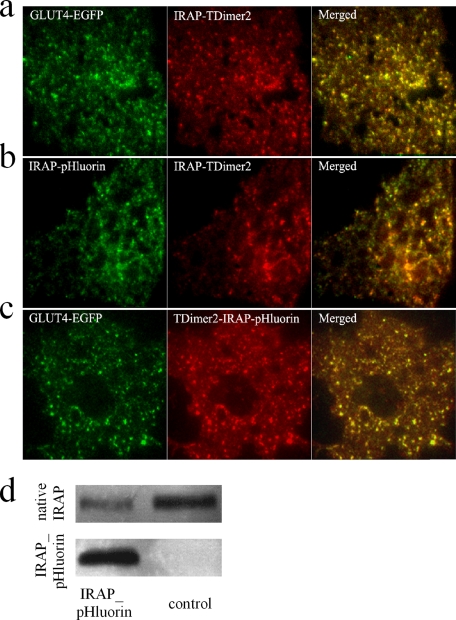
Rationale of the New Fusion Probe—EGFP-labeled GLUT4 (GLUT4-EGFP) has been employed to monitor the movement of single GLUT4-containing vesicles under TIRFM (8, 12). Although fusion of GLUT4 vesicles can be identified by monitoring the lateral diffusion of GLUT4-EGFP in the PM (8), this method is extremely time-consuming and requires extensive training. Moreover, it has been suggested that monitoring fusion events with a sole EGFP reporter protein tends to under-estimate the fusion rate because of the complex diffusion kinetics of released and membrane-bound EGFP following fusion (19, 20). Thus, it is desirable to develop a rather straightforward and easy-to-apply methodology to reliably detect fusion events at the single vesicle level. We thus turned to the ecliptic pHluorin, which displays high contrast fluorescence changes upon environmental pH changes (15). pHluorin is brightly fluorescent at pH 7.4 and is essentially nonfluorescent at an approximate pH of <6.0. Because both the N and C termini of GLUT4 face the cytosol, attaching pHluorin to either end of GLUT4 will not result in a pH-induced fluorescence change. The insulin-regulated aminopeptidase (IRAP) has been identified as a major protein that co-localizes with GLUT4 in insulin-responsive GSVs (21–27) and has been used successfully as a reporter molecule to analyze insulin-regulated GLUT4 trafficking (28, 29). IRAP is a single transmembrane protein with its C terminus facing the vesicle lumen. We thus attached pHluorin to the C terminus of IRAP (IRAP-pHluorin) in the hope that IRAP-pHluorin would label insulin-responsive GSVs and could be used as a reporter for fusion. The idea is that pHluorin will be located in the lumen of GSVs (which is acidic) prior to fusion and will be exposed to the extracellular medium (which is neutral) upon fusion. Hence, we could identify a fusion event simply by abrupt high contrast brightening of pHluorin fluorescence. To ensure that pHluorin-labeled IRAP was correctly sorted, we examined the co-localization of IRAP-pHluorin with GLUT4-containing vesicles. Because a static co-localization assay by confocal microscopy is often masked by large fractions of co-localization in the endoplasmic reticulum and Golgi networks, we employed TIRFM to visualize single IRAP-pHluorin-labeled vesicles and validated whether these vesicles co-localize with GSVs labeled with GLUT4-EGFP. As shown in the snapshots of TIRFM images in Fig. 1, both IRAP-pHluorin and IRAP-TDimer2 co-localize very well with GLUT4-EGFP-labeled vesicles. The percentage of co-localization was estimated to be 99.2% for IRAP-Tdimer2 and GLUT4-EGFP, 98.1% for IRAP-pHluorin and IRAP-Tdimer2, and 99.1% for GLUT4-EGFP and the dual colored probe TDimer2-IRAP-pHluorin.
FIGURE 1.
Co-localization of IRAP and GLUT4 in 3T3-L1 adipocytes. a–c, dual color images of 3T3-L1 adipocytes under TIRFM indicate the co-localization of GLUT4-EGFP and IRAP-TDimer2 (a), IRAP-pHluorin and IRAP-TDimer2 (b), and GLUT4-EGFP and Tdimer2-IRAP-pHluorin (c). The yellow fluorescence in the right panels indicates co-localization. The percentages of co-localization were estimated to be 99.2% for IRAP-Tdimer2 and GLUT4-EGFP, 98.1% for IRAP-pHluorin and IRAP-Tdimer2, and 99.1% for GLUT4-EGFP and TDimer2-IRAP-pHluorin. Please note that adipocytes in a and b were live cells, and the one in c was fixed with 4% paraformaldehyde and permeabilized in phosphate-buffered saline containing 0.25% Triton X-100. During imaging, the adipocyte in c was buffered in pH 5.5 KRBB solution to quench the pHluorin fluorescence. Hence, only EGFP and Tdimer2 fluorescence were imaged for co-localization comparison. Bars, 5 μm. d, Western analysis comparing exogenous IRAP-pHluorin protein levels and native IRAP levels between control adipocytes and cells transfected with IRAP-pHluorin.
The expression level of exogenous IRAP-pHluorin was estimated by Western blotting using anti-IRAP antibody, as shown in Fig. 1d. By normalizing the transfection efficiency for each batch of cells used for Western blotting, we estimated that the IRAP-pHluorin probe was ∼24 ± 6-fold greater than native IRAP proteins.
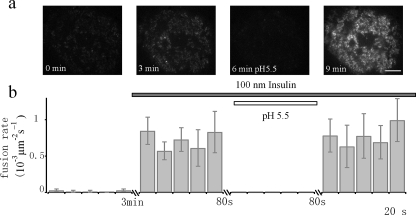
IRAP-pHluorin, a Robust and Reliable Probe for Fusion Detection—Having determined the localization of IRAP-pHluorin within GLUT4-containing vesicles, we next examined whether IRAP-pHluorin can be used to detect fusion. By time lapse TIRFM imaging, adipocytes transfected with IRAP-pHluorin normally display weak immobilized fluorescence dotted with a few moving particles (Fig. 2a). The immobilized fluorescence was distributed and largely quenched by extracellular perfusion of a pH 5.5 solution, suggesting it represents fluorescence from IRAP-pHluorin already in the PM. The moving particles were weak and rarely observed, which is in stark contrast to the bright and numerous GLUT4-EGFP-labeled vesicles (8, 12), indicating that most IRAP-pHluorin is quenched inside the acidic vesicle lumen. Occasionally, we observed a sudden brightening of fluorescent spots. These brightening events increased dramatically after insulin treatment and diminished completely during extracellular perfusion with a pH 5.5 solution (Fig. 2), suggesting that they represent fusion of IRAP-pHluorin-containing vesicles. An example fusion event is shown in Fig. 3a. To quantify the change in fluorescence, we placed two concentric circles centered at the fusion site with inner and outer diameters of ∼0.9 and ∼1.2 μm, respectively. As demonstrated in Fig. 3d, the fluorescence from the inner circle exhibited an abrupt increase. The diffusion of IRAP-pHluorin could be observed as a significant increase in fluorescence followed by an exponential decay within the annulus (Fig. 3d). Occasionally, we observed a transient fluorescence increase in the inner circle without apparent diffusion into the annulus (Fig. 3, b and e). This is analogous to the so-called “kiss-and-run” mode of fusion found during synaptic vesicle fusion (30). The kiss-and-run fusion of GSVs constitutes only a small fraction (∼15%) of the total fusion events.
FIGURE 2.
Insulin responsiveness of fusion events detected by IRAP-pHluorin. a, insulin stimulates the insertion of IRAP-pHluorin into the basal PM. TIRFM images of the footprint of the same adipocyte at different times after insulin perfusion are shown. The increase in fluorescence under TIRFM is largely due to IRAP-pHluorin insertion into the basal PM, because application of a pH 5.5 solution quenched most of the fluorescence. Bar, 5 μm. b, the time-averaged fusion rate/unit area/s (in 10-3 s-1 μm-2) was dramatically increased (∼42-fold) by insulin (n = 400 vesicles from five cells). Application of a pH 5.5 external solution quenched cell surface pHluorin and disabled the detection of fusion events.
The high contrast fluorescence change of IRAP-pHluorin during fusion makes it much easier to detect fusion events even by eye (supplemental Movie S1). As a comparison, we show a fusion event detected by GLUT4-EGFP in Fig. 3c. Fusion was defined by monitoring the radial diffusion of GLUT4-EGFP fluorescence. We considered a fusion event to have occurred when the fluorescence in the annulus between the two concentric circles increased significantly above the background fluorescence (13, 20). Because of the bright fluorescence of the vesicle prior to fusion (Fig. 3c), the fluorescence change during fusion was normally not obvious and was followed by a fast decay after fusion, as shown in Fig. 3f. It was usually not easy to distinguish a fusion and undocking event simply based on the fluorescence change profile. Hence, when using GLUT4-EGFP to detect fusion, one must scrutinize every vesicle based on radial diffusion analysis. This is not only extremely time-consuming but also prone to influence by the local fluorescence change adjacent to the vesicle being analyzed, which probably explains the low detection of fusion using the EGFP probe (20). We now provide a solution to this problem by defining GSV fusion based on a simple parameter, fluorescence change. In Fig. 3g, we compare the averaged fluorescence change (normalized to the prefusion value) of IRAP-pHluorin and GLUT4-EGFP fluorescence during fusion. Whereas no obvious fluorescence increase could be observed for GLUT4-EGFP, there was a ∼20-fold increase in fluorescence for IRAP-pHluorin upon fusion. Hence, we were able to improve the signal-to-noise ratio by more than an order of magnitude by using this new probe for the detection of GSV fusion.
The diffusion of IRAP-pHluorin, which is indicated by the decay of fluorescence after fusion, is considerably slower than that of GLUT4-EGFP. We estimated the averaged diffusion coefficient for IRAP-pHluorin to be 0.018 μm2/s, which is much slower than that of GLUT4-EGFP (0.093 μm2/s) (13). It is not clear why IRAP-pHluorin diffuses much more slowly than GLUT4-EGFP despite its smaller size (42 kDa for IRAP-pHluorin and 82 kDa for GLUT4-EGFP). Nevertheless, the slow diffusion of IRAP-pHluorin makes it advantageous for fusion detection because more frames will be captured during one fusion event.
Quantifying the Fusion Rate in Adipocytes—Although previous studies have monitored fusion events using GLUT4-EGFP, the fusion rate has not been determined (8). This is partly due to the difficulty in assessing fusion events based on the diffusion assay for GLUT4. Taking advantage of the new probe that is highly sensitive to fusion, we now tried to measure the fusion rate in 3T3-L1 adipocytes. Basal fusion events of GSVs in the absence of insulin were rare, at a rate of 0.017 ± 0.013 (10-3 s-1 μm-2). Treatment with 100 nm insulin dramatically increased the fusion rate to 0.72 ± 0.20 (10-3 s-1 μm-2), demonstrating a 42-fold increase (Fig. 2). This fold increase in fusion is greater that reported in our previous study using GLUT4-EGFP (13). The previous study also detected considerably fewer (only 39%) fusion events (13). Apparently, GLUT4-EGFP tends to under-estimate the fusion rate of GSV. Therefore, because the fusion of IRAP-pHluorin is highly insulin-sensitive, it is a better probe to quantify fusion events.
Development of TDimer2-IRAP-pHluorin for Monitoring Both Fusion and Prefusion History—Prior to fusion, GSV undergoes multiple steps, such as docking and priming. Previously, we demonstrated that insulin signaling acts at the docking and priming steps (13). Thus, it is very important to track the history of GSVs prior to fusion. IRAP-pHluorin is not good for this purpose because it is almost nonfluorescent before fusion. Therefore, we attached a pH-insensitive red fluorescent protein, Tdimer2 (16), to the cytosolic end of IRAP and made the fusion protein TDimer2-IRAP-pHluorin. The idea is that we could use the pHluorin fluorescence to report fusion and the red TDimer2 fluorescence to monitor prefusion steps under simultaneous dual color TIRFM imaging. Fig. 4a displays a typical fusion event labeled with TDimer2-IRAP-pHluorin in an insulin-stimulated cell. The fusion time was determined by the abrupt increase of pHluorin fluorescence in the green channel. The vesicle was indeed visible by Tdimer2 fluorescence in the red channel. ∼8.4 s prior to fusion, the vesicle appeared and gradually brightened as it approached the PM. It then stabilized at the fusion site with little movement (Fig. 4b). This docking behavior is consistent with what we previously reported using GLUT4-EGFP (13). The dwell time in the docking state is estimated to be 8.2 s in this case, as shown in Fig. 4b. We have analyzed 129 prefusion docking steps from fusing GSVs in the presence of insulin. The docking dwell time varies from subseconds to a few tens of seconds and follows a monoexponential distribution. The time constant of the distribution, which should be equal to the mean docking dwell time, is 4.67 s, in good agreement with our previous estimate (13).
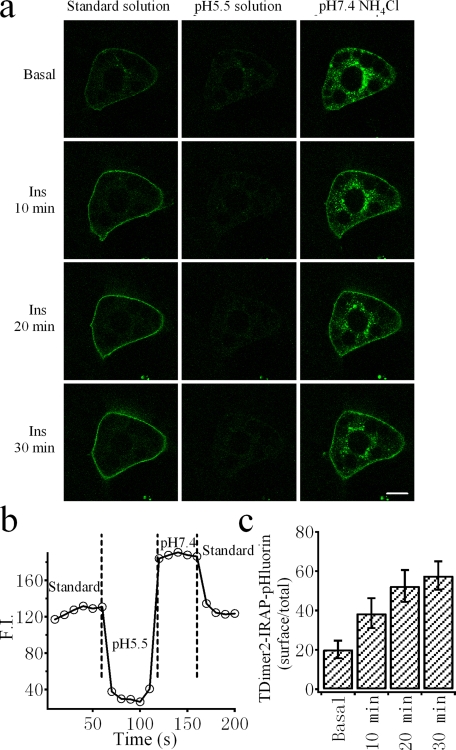
Quantifying the Membrane Fraction of TDimer2-IRAP-pHluorin—Quantifying the distribution of membrane proteins in the PM is very important for characterizing regulated membrane translocation processes such as insulin-stimulated GLUT4/IRAP translocation. The membrane fraction of GLUT4 has been determined by membrane fractionation and Western blotting. It has been estimated that membrane GLUT4 represents only ∼5% of the total under resting conditions and increases to a steady-state value of ∼50% after insulin treatment. We therefore would like to know whether TDimer2-IRAP-pHluorin is suitable for quantifying the membrane fraction of IRAP in real time in live cells. Fig. 5a demonstrates confocal images of the pHluorin fluorescence of TDimer2-IRAP-pHluorin at different time points after insulin stimulation. The peripheral rim-like green fluorescence represents the membrane fraction of TDimer2-IRAP-pHluorin because it is quenched by an acidic extracellular solution (pH 5.5). By comparing the quenched fluorescence with the total fluorescence measured in membrane-permeant NH4Cl solution buffered at pH 7.4 (to dequench all pHluorin molecules), one can estimate the membrane fraction of TDimer2-IRAP-pHluorin, as shown in Fig. 5b. The average membrane fraction of TDimer2-IRAP-pHluorin was ∼20% in the basal state and gradually increased to 60% after insulin perfusion, demonstrating an insulin-stimulated membrane translocation. However, it should be noted that the higher membrane fraction observed under basal conditions could be due to the effect of overexpression.
FIGURE 5.
Quantification of the membrane fraction of RITS upon insulin stimulation. a, confocal images of a representative 3T3-L1 adipocyte expressing RITS in different extracellular solutions at different times after insulin perfusion. Application of an external solution at pH 5.5 quenched cell surface pHluorin, and application of an NH4Cl solution at pH 7.4 brightened the intracellular fluorescence of pHluorin. Bar, 5 μm. b, effects of a pH 5.5 solution and a pH 7.4 NH4Cl solution on the fluorescence intensity (FI) of RITS. The overall cell fluorescence was background-subtracted. The vertical dashed lines indicate solution changes. c, dynamic change of the average surface fraction of RITS at different times after 100 nm insulin stimulation (n = 6 cells).
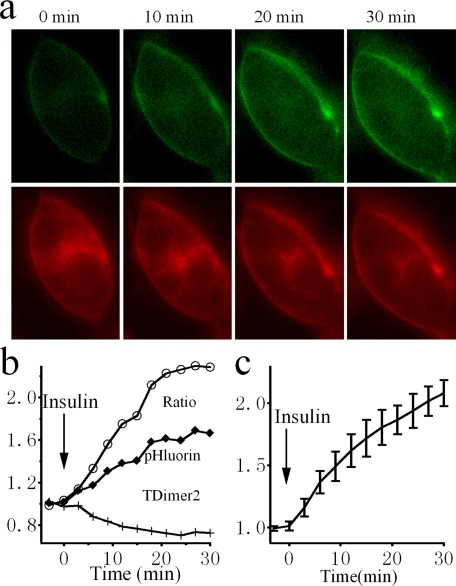
Monitoring the Insulin-stimulated Trafficking Process in Real Time—TDimer2-IRAP-pHluorin should be well suited for real time monitoring of the insulin-stimulated GLUT4 translocation process because it co-translocates with GLUT4 and displays a translocation-dependent high contrast green fluorescence change. The red fluorescence of TDimer2, on the other hand, is not sensitive to subcellular localization and can serve as a reference to normalize for fluorescence fluctuations unrelated to membrane translocation, i.e. excitation power fluctuation and sample movement. Fig. 6 depicts the ratiometric assay using conventional epifluorescence microscopy of TDimer2-IRAP-pHluorin in response to insulin stimulation. It is obvious that insulin induces a significant increase in green fluorescence, whereas the red fluorescence exhibits some photobleaching. The overall ratio between green and red fluorescence increases gradually and reaches a steady-state level of ∼2-fold after 20 min of insulin application (Fig. 6b). An averaged ratiometric measurement from several cells demonstrates a similar increment, as shown in Fig. 6c.
FIGURE 6.
Dynamic monitoring of the insulin-stimulated translocation process in live cells employing ratiometric fluorescence measurement. a, conventional epi-fluorescence images of a 3T3-L1 adipocyte expressing RITS at different times after insulin perfusion. Green and red fluorescence are both excited at 480 nm. Please note that there was a decrease in red fluorescence in the cytosol and an increase in cell surface fluorescence after insulin treatment. In contrast, both the cell surface and the fluorescence within the cell contour showed an increase in the green channel. The fluorescence increases within the cell contour could be due to out-of-focus fluorescence coming from surface pHluorin. b, time courses of green (pHluorin) and red (TDimer2) fluorescence, and the ratio between them, from the example cell shown in a. c, averaged time course of the fluorescence ratio from four cells treated with insulin.
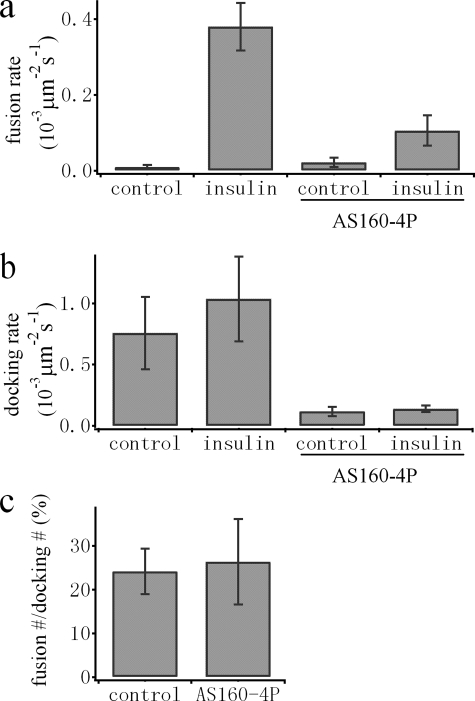
AS160 Is Not Involved in the Control of Fusion after Docking—Insulin-mediated phosphorylation of AS160 has been suggested to play an important role in GLUT4 trafficking (14). We previously identified the preparation of docked GSVs for fusion competence as a key insulin-regulated step. It is not clear whether this step involves insulin signaling to AS160. Testing this hypothesis requires simultaneous quantification of the docking and fusion rates of GSVs, a task that can be performed using the TDimer2-IRAP-pHluorin probe. We co-transfected differentiated 3T3-L1 cells with both TDimer2-IRAP-pHluorin and AS160-4P. Consistent with previous results (13, 14), the overexpressed AS160-4P mutant caused a significant reduction in the insulin-stimulated translocation of GLUT4-EGFP (data not shown). As expected, both the docking and fusion rates of GSVs were largely reduced by AS160-4P (Fig. 7, a and b). If we counted the fraction of fused GSVs out of the total docked GSVs, we estimated that approximately one of four (24 ± 5.2%) docked vesicles underwent fusion in the presence of insulin (Fig. 7c). This fraction is very low under basal conditions (∼ 1%) and is apparently very sensitive to insulin regulation, consistent with our previous conclusion that fusion of GSVs is strictly controlled by insulin. Interestingly, the fraction of fused versus docked GSVs (26 ± 9.8%) in the presence of insulin remained unchanged by overexpressed AS160-4P (Fig. 7c). Thus, inhibition of GLUT4 translocation by AS160-4P can be explained solely by interference of the docking step of GSVs, arguing against a role for AS160 in the steps downstream of docking and prior to fusion.
FIGURE 7.
AS160 is not involved in the control of fusion after docking. a and b, comparison of the average fusion rates (a) and docking rates (b) from control and AS160-4P-overexpressing adipocytes. Please note that the fusion rate is dramatically increased by insulin (100 nm). Overexpression of AS160-4P significantly inhibits docking as well as insulin-stimulated fusion of GSVs. c, the fractions of fused out of total docked GSVs in the presence of insulin were calculated for each cell, averaged, and compared between control and AS160-4P-overexpressing adipocytes. No significant change in this fraction was observed by overexpression of AS160-4P.
DISCUSSION
Insulin-stimulated GLUT4 translocation to the PM in fat tissues and skeletal muscles constitutes a key process for blood glucose control. The insulin-stimulated redistribution of GLUT4/IRAP involves insulin signal transduction and vesicle trafficking pathways, each of which is comprised of multiple steps. Despite recent progress in our understanding of insulin signaling and GLUT4 trafficking, the convergence point between these two pathways has yet to be defined. The answer to this question will require innovative techniques for quickly and reliably monitoring the translocation process in real time from live cells. In the current study, we have developed a probe (TDimer2-IRAP-pHluorin) that will change its emission spectrum upon translocation to the PM. We termed the probe ratiometric-based IRAP translocation sensor (RITS). By single wavelength excitation at 488 nm and dual emission ratiometric measurement, RITS can be easily and noninvasively applied to monitor the process of IRAP/GLUT4 translocation in real time. In contrast to a subcellular distribution assay, which requires either subcellular fractionation or confocal image analysis, assays using RITS are only required to quantify one-dimensional fluorescence change. The measurement can be easily adapted to conventional epi-fluorescence microscopy or even fluorescence spectrophotometers. Hence, RITS could be widely applied for further testing of the function of various molecules in GLUT4 translocation.
Previous studies have implicated the PM as an important target for insulin action in GLUT4 translocation, where insulin increases the docking and fusion of GSVs (8, 13, 31, 32). Although the fusion of GSVs can also be inferred by scrutinizing the radial diffusion of GLUT4-EGFP, this method is tedious and is only effective for dispersed fusion events with low local background fluorescence. When fusing vesicles are surrounded by nearby vesicles or have high background fluorescence, the diffusion of GLUT4-EGFP fluorescence is not always obvious. This may explain why many fewer fusion events were reported in the previous study (8). Here, we show that it is straightforward to use RITS to identify fusion events. Evaluation of fusion is based simply on an abrupt fluorescence increase. As a result, one can easily identify fusion events by eye (supplemental Movie S1). This method, as we show in Fig. 3g, improves the signal-to-noise ratio by an order of magnitude. 3T3-L1 adipocytes have an average capacitance of 60 picofarads. Assuming a conversion factor of 10 femtofarads/μm2 (33), we have determined a first estimate of the fusion rate constant of a single adipocyte, which is 0.1 s-1 at basal levels and is increased to 4.3 s-1 after insulin stimulation. We have also shown that RITS is suitable for monitoring the docking and priming steps prior to fusion, which are also very important steps regulated by insulin (13).
Previously, we have shown that overexpression of AS160-4P blocks most of the docking events of GSVs (13). Because of the lack of a sensitive method to quantify the fusion of GSVs, it was not clear at that time whether AS160-4P affected the steps after docking. Because post-docking steps are strictly controlled by insulin signaling (13), it is important to either accept or reject a role for AS160 in steps downstream of GSV docking. With the development of RITS, which can be used to reliably detect both docking and fusion of GSVs simultaneously, we now demonstrate that AS160-4P does not further inhibit GSV fusion after docking. That is, the inhibitory effect of AS160-4P on insulin-stimulated GLUT4 translocation can be solely explained by its inhibition of the docking of GSVs at the PM. This result suggests that AS160 is probably not involved in the insulin-regulated step downstream of docking.
Fusion detection based on a pH-dependent fluorescence change in pHluorin also enables us to separate fusion pore opening from vesicular membrane protein diffusion. We have observed transient fusion of GSVs without significant diffusion of IRAP-pHluorin into the PM. This kind of fusion event is like the so-called kiss-and-run mode of fusion observed for synaptic vesicles (30). Kiss-and-run fusion preserves the integrity of vesicles and permits fast local reuse of vesicles to support multiple neurotransmission events. Whereas only a small portion of GSVs underwent kiss-and-run fusion, the physiological significance of this form of fusion for GLUT4 translocation is not clear. Although we failed to observe diffusion of IRAP-pHluorin during kiss-and-run fusion, it is not known whether GLUT4 could diffuse into the PM using this mode of fusion. We did observe a significant difference in the diffusion of IRAP-pHluorin and GLUT4-EGFP into the PM. Despite a smaller molecular mass, IRAP-pHluorin diffused much more slowly than GLUT4-EGFP after fusion. It is possible that IRAP-pHluorin migrates together with other proteins in a larger complex.
Finally, a distinct advantage of RITS is its potential application to high throughput screening. Quantification of RITS can be simply performed by ratiometric fluorescence measurement at single wavelength (488 nm) excitation. Given the availability of several systems capable of high throughput dual emission fluorescence measurement, it is thus straightforward to apply RITS to the quantitative analysis of the effect of drugs in stimulating GLUT4/IRAP translocation or in sensitizing the effect of insulin. Indeed, few drugs targeted to stimulate GLUT4 translocation are currently available. Recent evidence has suggested that insulin responsiveness to glucose transport is impaired in first degree relatives of type 2 diabetic patients despite intact insulin signaling, implicating GLUT4 translocation defects as contributing to the insulin resistance phenotype (34). Further application of RITS in high throughput screening not only will accelerate the identification of key molecular players in GLUT4 trafficking but will also help to find new drugs to alleviate insulin-resistant symptoms.
Supplementary Material
Acknowledgments
We thank Dr. James Rothman for pHluorin cDNA and Dr. David James for the anti-IRAP antibody.
This work was supported by National Science Foundation of China Grant 30630020, Major State Basic Research Program of China Grant 2006CB70570, and Chinese Academy of Sciences Project Grant KSCX1-YW-02-1. The costs of publication of this article were defrayed in part by the payment of page charges. This article must therefore be hereby marked “advertisement” in accordance with 18 U.S.C. Section 1734 solely to indicate this fact.
The on-line version of this article (available at http://www.jbc.org) contains supplemental Movies S1 and S2.
Footnotes
The abbreviations used are: GSV, GLUT4 storage vesicle; PM, plasma membrane; TIRFM, total internal reflection fluorescence microscopy; GFP, green fluorescent protein; EGFP, enhanced GFP; RITS, ratiometric-based IRAP translocation sensor.
References
- 1.Birnbaum, M. J. (1989) Cell 57 305-315 [DOI] [PubMed] [Google Scholar]
- 2.James, D. E., Brown, R., Navarro, J., and Pilch, P. F. (1988) Nature 333 183-185 [DOI] [PubMed] [Google Scholar]
- 3.Bryant, N. J., Govers, R., and James, D. E. (2002) Nat. Rev. Mol. Cell Biol. 3 267-277 [DOI] [PubMed] [Google Scholar]
- 4.Henry, R. R., Abrams, L., Nikoulina, S., and Ciaraldi, T. P. (1995) Diabetes 44 936-946 [DOI] [PubMed] [Google Scholar]
- 5.Garvey, W. T., Maianu, L., Zhu, J. H., Brechtel-Hook, G., Wallace, P., and Baron, A. D. (1998) J. Clin. Investig. 101 2377-2386 [DOI] [PMC free article] [PubMed] [Google Scholar]
- 6.Robinson, L. J., Pang, S., Harris, D. S., Heuser, J., and James, D. E. (1992) J. Cell Biol. 117 1181-1196 [DOI] [PMC free article] [PubMed] [Google Scholar]
- 7.Czech, M. P., Chawla, A., Woon, C. W., Buxton, J., Armoni, M., Tang, W., Joly, M., and Corvera, S. (1993) J. Cell Biol. 123 127-135 [DOI] [PMC free article] [PubMed] [Google Scholar]
- 8.Lizunov, V. A., Matsumoto, H., Zimmerberg, J., Cushman, S. W., and Frolov, V. A. (2005) J. Cell Biol. 169 481-489 [DOI] [PMC free article] [PubMed] [Google Scholar]
- 9.Tengholm, A., and Meyer, T. (2002) Curr. Biol. 12 1871-1876 [DOI] [PubMed] [Google Scholar]
- 10.Zeigerer, A., McBrayer, M. K., and McGraw, T. E. (2004) Mol. Biol. Cell 15 4406-4415 [DOI] [PMC free article] [PubMed] [Google Scholar]
- 11.Lang, T., Wacker, I., Steyer, J., Kaether, C., Wunderlich, I., Soldati, T., Gerdes, H. H., and Almers, W. (1997) Neuron 18 857-863 [DOI] [PubMed] [Google Scholar]
- 12.Li, C. H., Bai, L., Li, D. D., Xia, S., and Xu, T. (2004) Cell Res. 14 480-486 [DOI] [PubMed] [Google Scholar]
- 13.Bai, L., Wang, Y., Fan, J., Chen, Y., Ji, W., Qu, A., Xu, P., James, D. E., and Xu, T. (2007) Cell Metab. 5 47-57 [DOI] [PubMed] [Google Scholar]
- 14.Sano, H., Kane, S., Sano, E., Miinea, C. P., Asara, J. M., Lane, W. S., Garner, C. W., and Lienhard, G. E. (2003) J. Biol. Chem. 278 14599-14602 [DOI] [PubMed] [Google Scholar]
- 15.Miesenbock, G., De Angelis, D. A., and Rothman, J. E. (1998) Nature 394 192-195 [DOI] [PubMed] [Google Scholar]
- 16.Campbell, R. E., Tour, O., Palmer, A. E., Steinbach, P. A., Baird, G. S., Zacharias, D. A., and Tsien, R. Y. (2002) Proc. Natl. Acad. Sci. U. S. A. 99 7877-7882 [DOI] [PMC free article] [PubMed] [Google Scholar]
- 17.Yang, X., Xu, P., and Xu, T. (2005) Biochem. Biophys. Res. Commun. 330 914-920 [DOI] [PubMed] [Google Scholar]
- 18.Yang, X., Xu, P., Xiao, Y., Xiong, X., and Xu, T. (2006) J. Biol. Chem. 281 15457-15463 [DOI] [PubMed] [Google Scholar]
- 19.Taraska, J. W., Perrais, D., Ohara-Imaizumi, M., Nagamatsu, S., and Almers, W. (2003) Proc. Natl. Acad. Sci. U. S. A. 100 2070-2075 [DOI] [PMC free article] [PubMed] [Google Scholar]
- 20.Tsuboi, T., and Rutter, G. A. (2003) Curr. Biol. 13 563-567 [DOI] [PubMed] [Google Scholar]
- 21.Ross, S. A., Scott, H. M., Morris, N. J., Leung, W. Y., Mao, F., Lienhard, G. E., and Keller, S. R. (1996) J. Biol. Chem. 271 3328-3332 [DOI] [PubMed] [Google Scholar]
- 22.Abel, E. D., Graveleau, C., Betuing, S., Pham, M., Reay, P. A., Kandror, V., Kupriyanova, T., Xu, Z., and Kandror, K. V. (2004) Mol. Endocrinol. 18 2491-2501 [DOI] [PubMed] [Google Scholar]
- 23.Martin, S., Rice, J. E., Gould, G. W., Keller, S. R., Slot, J. W., and James, D. E. (1997) J. Cell Sci. 110 2281-2291 [DOI] [PubMed] [Google Scholar]
- 24.Kandror, K., and Pilch, P. F. (1994) J. Biol. Chem. 269 138-142 [PubMed] [Google Scholar]
- 25.Kandror, K. V., and Pilch, P. F. (1994) Proc. Natl. Acad. Sci. U. S. A. 91 8017-8021 [DOI] [PMC free article] [PubMed] [Google Scholar]
- 26.Keller, S. R., Scott, H. M., Mastick, C. C., Aebersold, R., and Lienhard, G. E. (1995) J. Biol. Chem. 270 23612-23618 [DOI] [PubMed] [Google Scholar]
- 27.Sumitani, S., Ramlal, T., Somwar, R., Keller, S. R., and Klip, A. (1997) Endocrinology 138 1029-1034 [DOI] [PubMed] [Google Scholar]
- 28.Lampson, M. A., Racz, A., Cushman, S. W., and McGraw, T. E. (2000) J. Cell Sci. 113 4065-4076 [DOI] [PubMed] [Google Scholar]
- 29.Subtil, A., Lampson, M. A., Keller, S. R., and McGraw, T. E. (2000) J. Biol. Chem. 275 4787-4795 [DOI] [PubMed] [Google Scholar]
- 30.Sudhof, T. C. (2000) Neuron 28 317-320 [DOI] [PubMed] [Google Scholar]
- 31.Koumanov, F., Jin, B., Yang, J., and Holman, G. D. (2005) Cell Metab. 2 179-189 [DOI] [PubMed] [Google Scholar]
- 32.Gonzalez, E., and McGraw, T. E. (2006) Mol. Biol. Cell 17 4484-4493 [DOI] [PMC free article] [PubMed] [Google Scholar]
- 33.Cole, K. S. (1968) J. Gen. Physiol. 51 (suppl.) 1S-7S [PubMed] [Google Scholar]
- 34.Karlsson, H. K., Ahlsen, M., Zierath, J. R., Wallberg-Henriksson, H., and Koistinen, H. A. (2006) Diabetes 55 1283-1288 [DOI] [PubMed] [Google Scholar]
Associated Data
This section collects any data citations, data availability statements, or supplementary materials included in this article.


