Abstract
An mRNA differential display comparison of mouse JB6 promotion-sensitive (P+) and -resistant (P−) cells identified a novel gene product that inhibits neoplastic transformation. The JB6 P+ and P− cells are genetic variants that differ in their transformation response to tumor promoters; P+ cells form anchorage-independent colonies that are tumorigenic, and P− cells do not. A differentially displayed fragment, A7-1, was preferentially expressed in P− cells at levels ≥10-fold those in P+ cells, making its mRNA a candidate inhibitor of neoplastic transformation. An A7-1 cDNA was isolated that was identical to murine Pdcd4 gene cDNAs, also known as MA-3 or TIS, and analogous to human H731 and 197/15a. Until now, the function of the Pdcd4 protein has been unknown. Paralleling the mRNA levels, Pdcd4 protein levels were greater in P− than in P+ cells. Pdcd4 mRNA was also expressed at greater levels in the less progressed keratinocytes of another mouse skin neoplastic progression series. To test the hypothesis that Pdcd4 inhibits tumor promoter-induced transformation, stable cell lines expressing antisense Pdcd4 were generated from parental P− cells. The reduction of Pdcd4 proteins in antisense lines was accompanied by acquisition of a transformation-sensitive (P+) phenotype. The antisense-transfected cells were reverted to their initial P− phenotype by overexpression of a Pdcd4 sense fragment. These observations demonstrate that the Pdcd4 protein inhibits neoplastic transformation.
Comparison of cellular gene expression profiles, by using techniques such as differential display (1), is a valuable tool for elucidating genes that cause disease. Cancer is the result of multiple genetic alterations, many of which act coordinately to contribute to the disease process. Identification of the rate-limiting molecular events of tumor promotion is crucial to providing targets for cancer prevention. Tumor promoters such as phorbol esters and growth factors cause transient changes in gene expression (2). The effects of tumor promoters are pleiotropic, influencing biological processes such as mitogenesis, differentiation, and cell death. Only a subset of tumor promoter-induced gene expression changes are thought to be relevant to tumorigenesis.
The JB6 murine epidermal model of neoplastic transformation is a unique cell culture model in which cells are trapped in a promotable state (reviewed in ref. 3). Analogous to postinitiated cells in in vivo mouse skin carcinogenesis, promotion-sensitive (P+) JB6 cells undergo neoplastic transformation in response to tumor promoters, forming anchorage-independent colonies in soft agar (4). Cell lines established from these anchorage-independent colonies are tumorigenic. Promotion-resistant (P−) variants that do not undergo anchorage-independent transformation were isolated without selection from the same original population of BALB/c epidermal cells (5). Quiescent P+ and P− cells exhibit similar mitogenic responses to tumor promoters (5). Therefore, the JB6 variants provide a means to distinguish transformation-relevant differences in gene expression, both transient and sustained, from those related to stimulation of proliferation. Genes that mediate neoplastic transformation may be preferentially expressed in P+ cells, and genes that inhibit the process may be preferentially expressed in the P− cells. The JB6 model was the first to suggest the key role of transcription factor AP-1 in the promotion of neoplastic transformation (6), a hypothesis confirmed in the JB6 model (7–9), in mouse and human keratinocyte progression models (10, 11), and in mouse skin in vivo (12).
We compared the mRNA expression patterns of JB6 P+ and P− cells in over-agar culture by using differential display to find critical molecular effectors of tumor promoter-induced transformation. We have identified a gene, Pdcd4, that is preferentially expressed in P− cells and encodes a protein product that inhibits neoplastic transformation.
Materials and Methods
Cell Culture and Transformation Assays.
The JB6 P− (Cl 30–2a and Cl SC21) and P+ (Cl 41 and Cl 22) cell lines were derived from BALB/c mouse primary epidermal cell cultures (3–5, 13) and were cultured as previously described. For differential display analysis, JB6 Cl41 and SC21 cells were cultured over agar based on the method of Dong et al. (14). Briefly, ≈5 × 10⁵ cells suspended in 7.5 ml of Eagle’s minimal essential medium supplemented with 1% glutamine and antibiotics were layered over 20 ml of 0.5% agar medium in 150-mm dishes. Both liquid and agar layers contained 10% fetal bovine serum, 10 ng/ml (16 nM) 12-O-tetradecanoylphorbol 13-acetate (TPA; Chemicals for Cancer Research, Eden Prairie, MN), and 0.1% DMSO. The top cell medium layer was removed after 8 h, and the bottom agar layer was washed twice with 10 ml of PBS. Cells were recovered for RNA isolation by centrifugation at ≈500 × g. Anchorage-independent transformation assays in soft agar were carried out as previously described (14). Murine keratinocyte lines (15–18) were maintained as previously described, in medium containing 0.04 mM Ca2+ for line 291 and 1.4 mM Ca2+ for lines 03C, 03RAT, 05RAT, and 09RAT. The initiated and tumorigenic cells were switched to low-calcium medium 2 days before they reached 70% confluence.
Preparation of Total RNA and Northern Blot Analysis.
Total RNA was prepared from subconfluent monolayer cell cultures or cells recovered from over-agar with RNA STAT-60 (Tel-Test, Friendswood, TX) or Trizol Reagent (GIBCO/BRL, Rockville, MD). RNA concentration was determined spectrophotometrically. Northern analysis was carried out as described previously (19). mRNA size was estimated by comparison with standard markers (GIBCO/BRL) or the 28S and 18S ribosomal bands. Equal loading was assessed by hybridization with a 7S RNA probe. Relative band intensities were quantitated with a scanner (Microtek, Redondo Beach, CA) and Kodak Digital Science 1D software.
Differential Display and cDNA Isolation.
RNAmap kits (GenHunter, Nashville, TN) with T12MN primers and arbitrary oligomers 10 nucleotides in length (AP primers) were used for differential-display reverse-transcription (RT)–PCR, carried out according to the manufacturer’s protocol on total RNA prepared from JB6 cells cultured over agar as described above. A total of 18 primer sets were used, and differential expression of seven differentially displayed fragments has been confirmed to date (unpublished data). The reamplified PCR product of differential-display fragment A7-1, generated with primers T12MA and AP-7, was subcloned with the TA Cloning Kit (Invitrogen, Carlsbad, CA). Several TA subclones of A7-1 were tested by Northern blot analysis to identify one that hybridized with the P−-preferential ≈2.3-kb mRNA. This subclone was sequenced and used as a probe to screen a P− cDNA library [constructed by Stratagene (La Jolla, CA)], and a 1.1-kb A7-1 cDNA was sequenced. Comparisons to the GenBank database were made by using Wisconsin Package Version 9.1 (Genetics Computer Group, Madison, WI) and blast (National Center for Biotechnology Information, Bethesda, MD) software.
Preparation of Cellular Proteins and Immunoblotting.
Anti-H731 polyclonal rabbit antibody was raised against bacterial recombinant H731 protein (20). Before use, anti-Escherichia coli antibodies were removed from the antisera by incubation with E. coli lysate (Promega, Madison, WI) bound to nitrocellulose filters. JB6 cells were washed twice with cold PBS, harvested by scraping in 1.5 ml of PBS, and pelleted in a microcentrifuge at 4°C. The pellet was lysed in 150 μl of 60 mM Tris buffer (pH 6.8) containing 2% SDS/100 mM DTT/leupeptin (5 mM)/aprotinin (1.5 mM)/PMSF (2 mM)/pepstatin A (3 mM)/benzamidine (1 mM). Lysed samples at 4°C were sheared by passage through a 22-gauge needle. Protein concentration was determined by the bicinchoninic acid protein assay (Pierce, Rockford, IL). Aliquots containing 12 μg of protein were separated on 10% NuPage Bis-Tris polyacrylamide gels (Novex, San Diego, CA) and were transferred to nitrocellulose membranes. Protein filters were incubated in blocking agent [1× Tris-buffered saline (pH 7.5)/5% nonfat dried milk/0.05% Tween 20] overnight at 4°C, then with anti-H731 antibody for 1 h at room temperature. The filters were washed with 1× Tris-buffered saline containing 0.05% Tween 20, incubated with horseradish peroxidase-linked anti-rabbit Ig (Amersham, Piscataway, NJ) for 1 h at room temperature, washed, and visualized with the enhanced chemiluminescence kit (Amersham). Protein molecular weights were estimated by comparison with SeeBlue standards (Novex). Equal loading and efficacy of transfer were evaluated by Coomassie blue staining of residual proteins in the gel after transfer. Relative band intensities were quantitated as described for Northern blot analysis.
Plasmid Constructs.
A fragment of Pdcd4 spanning the translation start site corresponding to nucleotides 23–246 of MA-3 (GenBank accession no. D50465) was generated by RT-PCR. RT was carried out by using a primer corresponding to nucleotides 1234–1259 of MA-3, TAATAGTAGAAGACTTCCACAAGGAT, P− cell total RNA, and avian myeloblastosis virus reverse transcriptase (Promega). The upstream PCR primer sequence was TGCATTTAGTAAGTTGTG, and the downstream primer sequence was GCTTTTGCATTGATTCTA. Forty cycles of PCR with denaturation at 94°C for 30 s, annealing at 45°C for 60 s, and extension at 72°C for 90 s were carried out with Pfu polymerase (Stratagene, La Jolla, CA). The 224-bp PCR product was cloned by using the TA cloning kit (Invitrogen). For antisense expression, the fragment was subcloned into the EcoRI site of the neomycin-resistant pMM vector under control of the metallothionein promoter, to generate plasmid pMM.asA7-1. The pMM vector yields moderate levels of constitutive expression without metal induction in the JB6 system (21). For sense expression, the fragment was subcloned into the EcoRI site of pcDNA3.1(−) (Invitrogen) to generate pC.A7-1. Orientations were verified by restriction digestion and sequencing. Plasmid DNA was prepared with QIAfilter maxi plasmid kits (Qiagen, Chatsworth, CA).
Establishment of Transfectant Cell Lines.
Cells were transfected in 60-mm dishes with 4–10 μg of total DNA, by using Lipofectamine or Lipofectamine PLUS (GIBCO/BRL), according to the manufacturer’s protocol. Cells transfected with the antisense pMM.asA7-1 plasmid (or pMM as a control) were selected in ≈170-μg/ml of geneticin (G418), and independent clones were isolated by ring cloning and subsequent expansion. Stable antisense clones AS11 and AS28 were cotransfected with the Pdcd4 sense fragment plasmid pC.A7-1 [or pcDNA3.1(−) as a control] and pCEP4 (Invitrogen) to confer hygromycin resistance. Cells were selected in ≈80 units/ml of hygromycin, and all stable clones on a dish were subcultured together and considered to be an independent pool of transfectants.
Results
Pdcd4 mRNA Is Preferentially Expressed in Transformation-Resistant JB6 Cells.
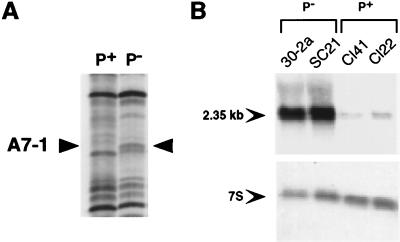
To identify genes preferentially expressed either in P+ or in P− JB6 cells that might be mediators or inhibitors of transformation, total RNA from P+ and P− cells was compared by using mRNA differential display (1). Total RNA was prepared from P+ and P− cells treated with the tumor promoter TPA over agar, culture conditions under which the P+ cells efficiently undergo anchorage-independent transformation (14). Comparison of multiple primer sets revealed that P− and P+ cells have ≥93% of expressed mRNAs in common. Differential display revealed a band, A7-1 (amplified with primers T12MA and AP-7, 1st differentially expressed band), that appeared to be preferentially expressed in the P− cells (Fig. 1A). Northern blot analysis with the differentially displayed fragment after subcloning identified an mRNA ≈2.35 kb in size. The A7-1 mRNA is expressed at levels ≥10-fold higher in two independent P− cell lines than in two independent P+ cell lines (Fig. 1B). The A7-1 mRNA is moderately down-regulated in P− cells by TPA at 8 h and returns to basal levels by 24 h; the level in P− cells remains substantially greater than that in P+ cells at all times (data not shown). The preferential expression of A7-1 mRNA in P− cells renders it a candidate for inhibiting the process of tumor promoter-induced transformation.
Figure 1.
Differential display fragment A7-1 is preferentially expressed in JB6 P− cells. (A) Differential display with T12MA and AP-7 primers was carried out on total RNA from P+ and P− cells and separated on a 6% denaturing polyacrylamide gel as described in Materials and Methods. Arrowheads indicate the position of a band, A7-1, reproducibly visible only in the P− lane. One set of duplicate samples is shown. (B) Northern analysis of total RNA (20 μg) prepared from untreated monolayer cultures of two independently derived P− cell lines (30–2a and SC21) and two independently derived P+ cell lines (Cl41 and Cl22) was carried out by using a 32P-labeled A7-1 probe (upper panel). The arrow indicates the approximate size of the A7-1 band. The blot was stripped and reprobed with a 32P-labeled 7S RNA probe to assess equivalent loading (lower panel).
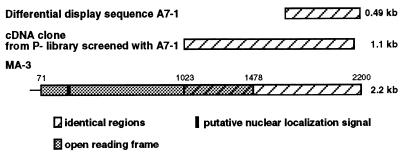
The subclone of the A7-1 fragment was sequenced, and a comparison of the 489-bp sequence with the GenBank database yielded no matches with the sequence of any known gene. The A7-1 fragment was used to screen a P− cell cDNA library, and a 1.1-kb cDNA clone was isolated and sequenced. The sequence was nearly identical (1073/1098 nucleotides) to that of a gene called MA-3 reported by Shibahara et al. (22).‖ The alignments of the original differentially displayed A7-1 fragment, the P− library cDNA, and the MA-3 sequence are illustrated in Fig. 2. The murine cDNA has an ORF of 1407 nucleotides. The A7-1 sequence was also nearly identical to that in three later reports of a topoisomerase inhibitor-suppressed sequence (23) and of human cDNAs H731 (20) and 197/15a (24). The gene has subsequently been assigned the symbol Pdcd4. No function of the Pdcd4 protein has been reported. The predicted mouse and human amino acid sequences are 96% identical.
Figure 2.
Alignment of A7-1 differential display fragment and cDNAs. Identical regions of the A7-1 fragment, the P− cDNA clone, and the sequence of MA-3 reported by Shibahara et al. (22) are indicated by the hatched regions. The A7-1 P− clone starts at nucleotide 1023 of MA-3. The ORF of the full-length clone is indicated by the shaded region and extends from nucleotides 71 to 1478. The black box near the 5′-end of the full-length clone indicates the putative nuclear localization signal.
Immunoblotting Detects Greater Levels of Pdcd4 Proteins in P− Than P+ Cells.
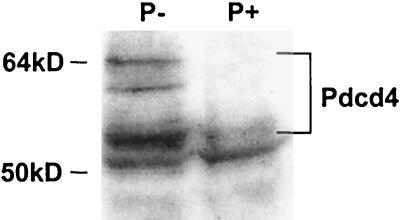
Owing to the close sequence identity of the mouse and human sequences, we used an anti-human H731 antibody to compare levels of the Pdcd4 protein in JB6 cells. Anti-H731 detected in vitro-translated mouse Pdcd4 by immunoblotting (data not shown), indicating that the antibody against the human protein also detects mouse protein. The predicted size of the 469-aa Pdcd4 protein is 51.7 kDa. In JB6 cells, the antibody detected proteins of approximate molecular masses from 51 to 64 kDa (Fig. 3). The signal of each of these bands as well as that of the in vitro-translated protein was specifically diminished by preincubation of the antibody with in vitro-translated Pdcd4 protein (data not shown), demonstrating that the proteins present in these bands contain Pdcd4 epitopes. The ≈54- to 64-kDa bands were expressed at levels four- to sevenfold higher in P− cells than in the P+ cells, as shown in the representative experiment in Fig. 3. Coomassie blue staining of residual protein in the gel after transfer verified similar protein loading. In a separate experiment, we confirmed that the enhanced chemiluminescent detection of the Pdcd4 proteins is proportional to the amount of total protein loaded (data not shown). In contrast to the Pdcd4 mRNA level and in contrast to the higher-molecular-size protein bands, the band at 51 kDa generally appears at similar intensity in the P+ and P− lysates, and it migrates with slightly greater mobility than in vitro-translated Pdcd4 (data not shown). Therefore, the 51-kDa band is likely to be a protein other than Pdcd4 that contains similar epitopes. Based on observation of the 54- to 64-kDa bands, the Pdcd4 protein, like the Pdcd4 mRNA, is preferentially expressed in transformation-resistant cells, consistent with the hypothesis that Pdcd4 is an inhibitor of neoplastic transformation.
Figure 3.
Preferential expression of Pdcd4 proteins in P− cells. Lysates were prepared from 30–2a P− cells and Cl22 P+ cells. Proteins (12 μg) were separated on 10% Bis-Tris NuPage gels, transferred to nitrocellulose, and subjected to immunoblotting with anti-H731 polyclonal antibody with visualization by chemiluminescent detection. The migration of molecular weight standards is indicated.
Pdcd4 mRNA Expression Decreases with Progression in a Mouse Keratinocyte Model.
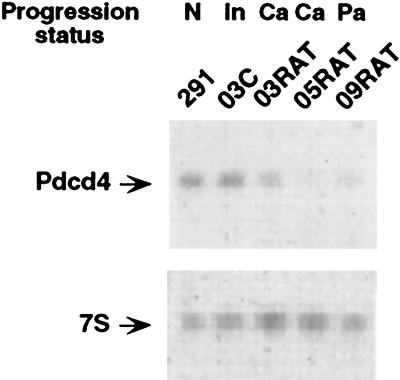
To test this hypothesis, we extended our studies to another model of murine epidermal carcinogenesis, by using a series of mouse keratinocyte cell lines (15–18). The 291 cells are normal keratinocytes, 03C is a 7,12-dimethylbenz[a]anthracene-initiated 291 cell line, and 03RAT is a tumorigenic line derived from 03C that forms poorly differentiated squamous cell carcinomas. 05RAT and 09RAT are tumorigenic lines that form moderately differentiated squamous cell carcinomas and benign papillomas, respectively, derived from independent 7,12-dimethylbenz[a]anthracene–initiated 291 cell lines. As shown in the representative autoradiogram in Fig. 4, the Pdcd4 mRNA is expressed at higher levels in the preneoplastic 291 and initiated 03C cell lines than in the further progressed 05RAT and 09RAT cells and at slightly higher levels than in the 03RAT line. These results are consistent with our observations in the JB6 model and suggest a role for Pdcd4 in the prevention of neoplastic transformation and consequently a requirement for down-regulation of Pdcd4 during neoplastic progression.
Figure 4.
Preferential expression of Pdcd4 mRNA in preneoplastic lines of mouse keratinocyte progression series. Northern analysis of total RNA (10 μg) prepared from normal (N) cell line 291, initiated (In) cell line 03C, carcinoma (Ca) cell line 03RAT, Ca cell line 05RAT, and papilloma (Pa) cell line 09RAT was carried out by using a 32P-labeled Pdcd4 probe (upper panel). The blot was stripped and reprobed with a 32P-labeled 7S RNA probe to assess equivalent loading (lower panel).
Decreasing the Endogenous Pdcd4 Protein Level Is Accompanied by Acquisition of Transformation-Sensitive Phenotype.
If Pdcd4 does inhibit transformation, its expression alone may be sufficient to block transformation, or its activity may be conditional on the expression of other factors. We attempted to test whether Pdcd4 expression is necessary, sufficient, or both for inhibiting transformation. If Pdcd4 is necessary to inhibit transformation of the P− cells, then lowering the Pdcd4 protein concentration of P− cells below some critical required level should render the cells susceptible to tumor promotion and allow them to undergo anchorage-independent transformation in response to tumor promoters. If Pdcd4 is sufficient to block transformation in P+ cells, then increasing the Pdcd4 protein level in P+ cells should convert them to the P− phenotype. To lower the Pdcd4 protein level and test the necessity of Pdcd4 for inhibiting transformation, P− cell lines stably transfected with a Pdcd4 antisense expression vector were established. The Pdcd4 protein level in stably transfected clones was decreased in comparison with vector-transfected controls and with nontransfected P− cells (Fig. 5). Decreases of approximately two- to fivefold were observed for the 54-to 64-kDa Pdcd4 bands. In contrast, the 51-kDa band was not consistently decreased, further supporting the conclusion that it is not a Pdcd4 protein band. It is of interest that, although antisense Pdcd4 RNA was detectable in the transfected cell lines by RT-PCR (data not shown), there was no clear correlation between the level of antisense expression, the level of endogenous Pdcd4 mRNA detected by RT-PCR, and the level of Pdcd4 protein observed in the transfected cell lines. This may reflect the multiple mechanisms by which antisense might affect protein level, including the blocking of interactions required for translation and the degradation of antisense-sense RNA duplexes (25, 26).
Figure 5.
Antisense expression reduces Pdcd4 protein levels. Lysates were prepared from independent transfectant cell line clones (vector controls V16 and V4 and Pdcd4 antisense transfectants AS11, AS23, and AS28) and 30–2a P− cells, and immunoblotting was carried out as described for Fig. 3. The migration of molecular weight standards is indicated.
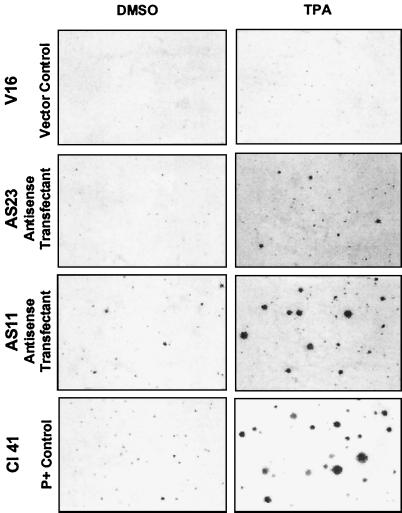
The effect of antisense Pdcd4 on the transformation response of P− cells is shown in Fig. 6. In contrast to the vector-transfected control cells, the antisense lines formed anchorage-independent colonies in response to TPA in soft agar. In multiple experiments, the AS23, AS28, and AS11 antisense-transfected lines yielded ≈200–480, ≈200–650, and ≈1400–1700 colonies per 104 cells, respectively, compared with the typical P+ and P− cell response of ≈1000–4000 and <100 colonies per 104 cells, respectively. Some colonies were also observed on solvent control plates of AS11, indicating that this antisense-transfected cell line was transformed. The V4 and V16 vector control cell lines yielded <70 colonies per 104 cells, a typical P− cell response. The same acquisition of transformation response was observed after exposure to the tumor promoter epidermal growth factor (data not shown) as to TPA.
Figure 6.
Gain of transformation response in P− cells expressing antisense Pdcd4. Cell lines were exposed to the solvent control 0.1% DMSO or to 10 ng/ml (16 nM) of TPA for 14 days in soft agar. Dishes were stained with 2-(4-iodophenyl)-3-(4-nitrophenyl)-5-phenyltetrazolium chloride and photographed at 25× magnification. Examples representative of several experiments are shown.
The monolayer growth rates of the control and antisense lines were compared. Although there was no significant difference between the doubling time of AS23 or AS28 and the vector controls (i.e., ≈21–24 h), the doubling time of the transformed AS11 line was ≈16 h, similar to other tumorigenic cell lines.
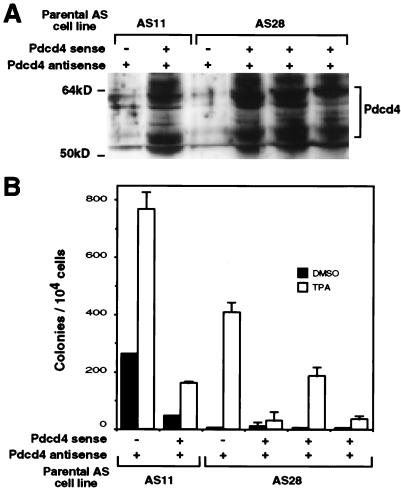
To demonstrate the specificity of the Pdcd4 antisense effect, stable antisense lines AS28 and AS11 were transfected with a construct expressing a Pdcd4 fragment in the sense orientation. Compared with Pdcd4 antisense derivatives transfected with an empty vector, multiple pools of sense-plus-antisense transfectants showed an increase in Pdcd4 protein level (Fig. 7A) and a substantial decrease in TPA-induced anchorage-independent transformation (Fig. 7B), recapitulating the original transformation-resistant phenotype.
Figure 7.
Pdcd4 sense fragment abrogates antisense effect. Pooled transfectant cell lines with or without the Pdcd4 sense fragment were established from the parental antisense lines AS11 and AS28. (A) Immunoblotting with anti-H731 was carried out as described for Fig. 3. The migration of molecular weight standards is indicated. Coomassie blue staining indicated that the protein amount in each lane varied by <20%. (B) An anchorage-independent transformation assay was carried out as described for Fig. 6, and the colony number was determined with a computerized image analyzer. Error bars indicate the range of values of duplicate dishes.
We tested whether Pdcd4 is sufficient to inhibit tumor promoter-induced transformation by overexpression in P+ cells. No increase in Pdcd4 expression was detected in any of four pooled or nine clonal stably transfected cell lines after selection for neomycin resistance. Overexpressed protein was detected in transiently transfected cells. Together, these results do not address the question of sufficiency; they do establish the necessity of down-regulating Pdcd4 for the transformation response.
Discussion
Cloning by differential display has identified a number of genes potentially involved in cancer or other disease processes (27). A7-1 was originally detected as a differential display band preferentially expressed in less progressed, P− JB6 cells, providing the first clue that it might play a role in inhibiting cancer induction. Consistent with the differential display, A7-1 mRNA is expressed at higher levels in JB6 P− cells. The potential significance of A7-1 was enhanced by the observation that, in a separate murine keratinocyte progression model, the mRNA was expressed at higher levels in preneoplastic and initiated cells than in further progressed tumorigenic cells. The results showing that the A7-1 protein inhibits neoplastic transformation are the first to demonstrate a role for this novel protein in a cellular process. This is the first endogenous gene demonstrated to function as an inhibitor in the JB6 model of tumor promoter-induced transformation.
Sequencing the A7-1 cDNA revealed identity with another cDNA, MA-3 (gene Pdcd4), found to be up-regulated with apoptosis in several model systems (22). More recently, the identical sequence was reported to be down-regulated by certain topoisomerase inhibitors in mouse lymphoma cells (23). No causal relationship to apoptosis or to topoisomerase inhibitor-induced cytotoxicity has been established. The human cDNA was identified independently by screening with an antibody against a nuclear antigen, and this cDNA is called H731 (20). The human H731 ORF encodes a protein of 458 aa with a predicted molecular size of 50.6 kDa, compared with 469 aa and 51.7 kDa, respectively, for the mouse protein. The human and mouse proteins exhibit 96% amino acid sequence identity. A second human cDNA, 197/15a, was reported as down-regulated by interleukin-2 treatment of natural killer and T cells (24). 197/15a is identical to H731 except that, similar to mouse Pdcd4, it has an additional 11 amino acids in the N-terminal region. When the anti-H731 antibody was used to detect recombinant H731 expressed in E. coli, a band with an apparent molecular size of 56 kDa was previously reported (20); under our current electrophoretic conditions, a recombinant H731 protein band of 51 kDa was detected (data not shown), validating the predicted ORF. The Pdcd4 and H731 sequences include potential sites of phosphorylation by protein kinase C, casein kinase II, and proline-directed protein kinase, as well as a probable nuclear localization signal (20, 22). Cytosolic and nuclear forms of the protein have been identified in HeLa (28) and in JB6 cells (H.M., unpublished data). The Pdcd4 protein does not have motifs characteristic of transcription factors, nor does it show significant similarity to other known proteins (20, 22). The mRNA has been found in all tissues tested thus far (22, 29), and a cross-hybridizing signal was detected by Southern blot analysis in chicken and Xenopus cells and even weakly in Drosophila (22). The widespread distribution and probable conservation of the Pdcd4 protein coupled with our demonstration of its ability to inhibit neoplastic transformation argue for an important physiological role for this protein. It will be of interest to ascertain its biochemical activity.
With antibody against the human H731 (PDCD4) protein in JB6 P− cells, anti-H731 detected several bands ranging from 51 to 64 kDa. The 51-kDa band is not likely to be the Pdcd4 gene product because (i) it migrates with greater mobility than in vitro-translated Pdcd4 protein, (ii) unlike the mRNA, it is present at similar levels in P− and P+ cell lines, and (iii) the level of the 51-kDa band is generally not decreased in stable antisense transfectant lines. The observation of multiple bands of higher molecular sizes than that predicted for Pdcd4 is in agreement with observations of the human H731 protein in HeLa cells (28) and may be caused by alternative mRNAs, as found for the human sequence (24), or by posttranslational modification such as phosphorylation. The H731 protein was found to be phosphorylated in HeLa cells (28). Some or all of the 54- to 64-kDa bands identified with anti-H731 in JB6 cells may be Pdcd4 proteins. Because these bands are present at levels two- to sevenfold lower in P+ than in P− cells, the Pdcd4 protein levels concur with the preferential expression of the mRNA in P− cells, supporting the hypothesis that the Pdcd4 protein inhibits neoplastic transformation and must be down-regulated for progression to occur.
The use of antisense constructs to show a causal role for genes whose expression inhibits transformation has also proven effective in other cases (30, 31). We demonstrated a causal role in transformation of Pdcd4 down-regulation by using antisense expression in P− cells to produce a gain of tumor promoter-induced transformation response. Pdcd4 does not block transformation by a general inhibition of cell growth, because the doubling times of vector controls and two of the stable antisense lines did not differ significantly. Compared with the clones that acquired a P+ phenotype, additional changes apparently occurred in the AS11 clone that acquired a transformed phenotype either independent of or as a result of the reduction in Pdcd4 protein level. The specificity of the Pdcd4 antisense effect was shown by overexpressing a Pdcd4 sense fragment and reversing the phenotypic switch. Pdcd4 sense expression reduced or ablated the P+ or transformed phenotype acquired in the antisense expressors. We therefore conclude that the Pdcd4 protein does inhibit tumor promoter-induced neoplastic transformation.
Our attempt to test whether overexpression of Pdcd4 alone is sufficient to block tumor promoter-induced transformation in P+ cells failed to yield any transfectants stably expressing Pdcd4 after selection for neomycin resistance, despite the ability to detect introduced Pdcd4 expression in transient transfection assays. This result was unexpected because the P− cells tolerate higher levels of Pdcd4; differences in the genetic background of the P+ and P− cells must account for the apparent difference in the responses to Pdcd4. Constitutive expression of high levels of Pdcd4 in P+ cells may be detrimental, possibly inhibiting growth or inducing apoptosis. It may be possible to test the sufficiency of Pdcd4 to inhibit transformation in JB6 P+ cells by regulating the overexpression of Pdcd4 with an inducible promoter. Nevertheless, the antisense experiments clearly demonstrate the necessity of decreasing Pdcd4 levels in the P− cells to permit tumor promoter-induced transformation.
Tumor promoter-induced transformation in the JB6 model is known to be dependent on activation of transcription factors AP-1 and NF-κB (7–9). Several additional differences in specific gene expression have also been identified, e.g., TIS21, TIS1, and a Fra-related protein are preferentially induced in promotion-resistant cells (19, 32), whereas architectural transcription factor HMG-Y is preferentially induced in promotion-sensitive cells (33), and TIMP-3 is expressed in preneoplastic but not transformed JB6 variants (34). Pdcd4 is the first differentially expressed gene, however, demonstrated to play a causal role in the inhibition of neoplastic transformation. Pdcd4, a constitutively expressed protein in P− cells, may negatively regulate signal transduction pathways triggered by tumor promoters. Phosphorylation by protein kinase C or other kinases might activate Pdcd4 such that it could regulate gene expression either directly or through controlling the activation of various transcription factors such as AP-1, NF-κB, or HMG-I(Y). Pdcd4 might either suppress mediators or activate inhibitors of transformation in P− cells. Understanding the biochemical function of Pdcd4 will help to elucidate the mechanism by which it inhibits neoplastic transformation and to address its potential use in cancer prevention.
Acknowledgments
The pAG insert complementary to 7S RNA was a gift from G. Tim Bowden, and the pMM vector from Michael Birrer. We thank Matthew Young, Yi Sun, and John W. Nelson for helpful discussions, and Hsin-Sheng Yang and Rajalakshmi Nair, as well as Yuangang Liu and Elizabeth Horn at Roswell Park Cancer Institute, for their assistance. This project has been funded in part by the National Cancer Institute, National Institutes of Health, under Contract NO1-CO-56000.
Abbreviations
- P+
promotion-sensitive
- P−
promotion-resistant
- TPA
12-O-tetradecanoylphorbol 13-acetate
- RT
reverse transcription
Footnotes
The release date of the MA-3 sequence occurred between the sequencing of the initial 489-bp fragment and the 1.1-kb cDNA clone of A7-1.
References
- 1.Liang P, Pardee A B. Science. 1992;257:967–971. doi: 10.1126/science.1354393. [DOI] [PubMed] [Google Scholar]
- 2.Herschman H R. In: Advances in Regulation of Cell Growth, Volume 2; Cell Activation: Genetic Approaches. Mond J J, Cambier J C, Weiss A, editors. New York: Raven; 1991. pp. 83–117. [Google Scholar]
- 3.Cmarik J L, Colburn N H. In: Food Factors for Cancer Prevention. Ohigashi H, Osawa T, Terao J, Watanabe S, Yoshikawa T, editors. Tokyo: Springer-Verlag; 1997. pp. 67–76. [Google Scholar]
- 4.Colburn N H, Former B F, Nelson K A, Yuspa S H. Nature (London) 1979;281:589–591. doi: 10.1038/281589a0. [DOI] [PubMed] [Google Scholar]
- 5.Colburn N H, Wendel E, Abruzzo G. Proc Natl Acad Sci USA. 1981;78:6912–6916. doi: 10.1073/pnas.78.11.6912. [DOI] [PMC free article] [PubMed] [Google Scholar]
- 6.Bernstein L, Colburn N H. Science. 1989;244:566–569. doi: 10.1126/science.2541502. [DOI] [PubMed] [Google Scholar]
- 7.Dong Z, Birrer M, Watts R, Matrisian L, Colburn N H. Proc Natl Acad Sci USA. 1994;91:609–614. doi: 10.1073/pnas.91.2.609. [DOI] [PMC free article] [PubMed] [Google Scholar]
- 8.Li J-J, Dong Z, Dawson M I, Colburn N H. Cancer Res. 1996;56:483–489. [PubMed] [Google Scholar]
- 9.Li J-J, Westergaard C, Ghosh P, Colburn N H. Cancer Res. 1997;57:3569–3576. [PubMed] [Google Scholar]
- 10.Dong Z, Crawford H C, Lavrovsky V, Taub D, Watts R, Matrisian L M, Colburn N H. Mol Carcinog. 1997;19:204–212. doi: 10.1002/(sici)1098-2744(199707)19:3<204::aid-mc8>3.0.co;2-d. [DOI] [PubMed] [Google Scholar]
- 11.Li J-J, Rhim J S, Schlegel R, Vousden K H, Colburn N H. Oncogene. 1998;16:2711–2721. doi: 10.1038/sj.onc.1201798. [DOI] [PubMed] [Google Scholar]
- 12.Young M R, Li J-J, Rincon M, Flavell R A, Sathyanarayana B K, Hunziker R, Colburn N H. Proc Natl Acad Sci USA. 1999;96:9827–9832. doi: 10.1073/pnas.96.17.9827. [DOI] [PMC free article] [PubMed] [Google Scholar]
- 13.Colburn N H, Vorder-Bruegge W F, Bates J R, Gray R H, Rossen J D, Kelsey W H, Shimada T. Cancer Res. 1978;38:624–634. [PubMed] [Google Scholar]
- 14.Dong Z, Cmarik J L, Wendel E J, Colburn N H. Carcinogenesis. 1994;15:1001–1004. doi: 10.1093/carcin/15.5.1001. [DOI] [PubMed] [Google Scholar]
- 15.Kulesz-Martin M, Yoshida M A, Prestine L, Yuspa S H, Bertram J S. Carcinogenesis. 1985;6:1245–1254. doi: 10.1093/carcin/6.9.1245. [DOI] [PubMed] [Google Scholar]
- 16.Kulesz-Martin M, Blumenson L, Lisafeld B. Carcinogenesis. 1986;7:1425–1429. doi: 10.1093/carcin/7.9.1425. [DOI] [PubMed] [Google Scholar]
- 17.Kulesz-Martin M F, Penetrante R, East C J. Carcinogenesis. 1988;9:171–174. doi: 10.1093/carcin/9.1.171. [DOI] [PubMed] [Google Scholar]
- 18.Liu Y, Kulesz-Martin M F. Carcinogenesis. 1998;19:683–686. doi: 10.1093/carcin/19.4.683. [DOI] [PubMed] [Google Scholar]
- 19.Cmarik J L, Herschman H, Colburn N H. Mol Carcinog. 1994;11:115–124. doi: 10.1002/mc.2940110209. [DOI] [PubMed] [Google Scholar]
- 20.Matsuhashi S, Yoshinaga H, Yatsuki H, Tsugita A, Hori K. Res Commun Biochem Cell Mol Biol. 1997;1:109–120. [Google Scholar]
- 21.Sun Y, Nakamura K, Wendel E, Colburn N. Proc Natl Acad Sci USA. 1993;90:2827–2831. doi: 10.1073/pnas.90.7.2827. [DOI] [PMC free article] [PubMed] [Google Scholar]
- 22.Shibahara K, Asano M, Ishida Y, Aoki T, Koike T, Honjo T. Gene. 1995;166:297–301. doi: 10.1016/0378-1119(95)00607-9. [DOI] [PubMed] [Google Scholar]
- 23.Onishi Y, Kizaki H. Biochem Biophys Res Commun. 1996;228:7–13. doi: 10.1006/bbrc.1996.1609. [DOI] [PubMed] [Google Scholar]
- 24.Azzoni L, Zatsepina O, Abebe B, Bennett I M, Kanakaraj P, Perussia B. J Immunol. 1998;161:3493–3500. [PubMed] [Google Scholar]
- 25.Nellen W, Sczakiel G. Mol Biotechnol. 1996;6:7–15. doi: 10.1007/BF02762319. [DOI] [PubMed] [Google Scholar]
- 26.Curcio L D, Bouffard D Y, Scanlon K J. Pharmacol Ther. 1997;74:317–332. doi: 10.1016/s0163-7258(97)00005-3. [DOI] [PubMed] [Google Scholar]
- 27.Liang P, Pardee A B, editors. Methods in Molecular Biology: Differential Display Methods and Protocols. Totowa, NJ: Humana; 1997. [Google Scholar]
- 28.Yoshinaga H, Matsuhashi S, Ahaneku J, Masaki Z, Hori K. Res Commun Biochem Cell Mol Biol. 1997;1:121–131. [Google Scholar]
- 29.Onishi Y, Hashimoto S, Kizaki H. Gene. 1998;215:453–459. doi: 10.1016/s0378-1119(98)00313-8. [DOI] [PubMed] [Google Scholar]
- 30.Khokha R, Waterhouse P, Yagel S, Lala P, Overall C, Norton G, Denhardt D T. Science. 1989;244:947–950. doi: 10.1126/science.2465572. [DOI] [PubMed] [Google Scholar]
- 31.Speed C J, Little P J, Hayman J A, Mitchell C A. EMBO J. 1996;15:4852–4861. [PMC free article] [PubMed] [Google Scholar]
- 32.Bernstein L R, Bravo R, Colburn N H. Mol Carcinog. 1992;6:221–229. doi: 10.1002/mc.2940060308. [DOI] [PubMed] [Google Scholar]
- 33.Cmarik J L, Li Y, Ogram S A, Min H, Reeves R, Colburn N H. Oncogene. 1998;16:3387–3396. doi: 10.1038/sj.onc.1201888. [DOI] [PubMed] [Google Scholar]
- 34.Sun Y, Hegamyer G, Colburn N H. Cancer Res. 1994;54:1139–1144. [PubMed] [Google Scholar]


