

Abstract
The role of the proteasome in neurodegenerative diseases is controversial. On the one hand, there is evidence that a dysfunction of proteasome activity can lead to neurodegeneration but there is also data showing that proteasome inhibition can protect nerve cells from a variety of insults. In an attempt to clarify this issue, we studied the effects of four different proteasome inhibitors in a well characterized model of oxidative stress-induced nerve cell death. Consistent with the hypothesis that proteasome inhibition can be neuroprotective, we found that low concentrations of proteasome inhibitors were able to protect nerve cells from oxidative stress-induced death. Surprisingly, the neuroprotective effects of the proteasome inhibitors appeared to be at least partially mediated by the induction of NF-κB since protection was significantly reduced in cells expressing a specific NF-κB repressor. The activation of NF-kB by proteasome inhibitors was mediated by IκBα and IKK and was blocked by antioxidants and inhibitors of mitochondrial reactive oxygen species production. These data suggest that low concentrations of proteasome inhibitors induce a moderate level of mitochondrial oxidative stress which results in the activation of neuroprotective pathways.
Keywords: reactive oxygen species, NF-κB, mitochondria, phosphorylation, glutathione
1. Introduction
The ubiquitin-proteasome pathway mediates the majority of the proteolysis seen in the cytoplasm and nucleus of mammalian cells. As such it plays an important role in the regulation of a variety of physiological and pathophysiological processes including tumorigenesis, inflammation and cell death [for reviews see 1, 2]. Of particular importance, the ubiquitin-proteasome pathway regulates the levels and/or activity of a variety of transcription factors, including NF-κB. However, despite the numerous studies over the last few years that have examined the role of the ubiquitin-proteasome pathway in cell death, the role of this pathway remains controversial. This is particularly true in the nervous system where proteasome inhibition has been implicated in both the development of Parkinson’s disease [for review see 3], and protection from nerve cell death in models of Alzheimer’s disease [4] and stroke [5].
All of the CNS pathologies in which the role of the ubiquitin-proteasome pathway has been investigated share the common feature of oxidative stress [for review see 6]. Oxidative stress results when there is an imbalance between the production and disposal of reactive oxygen species (ROS) and, when severe, it can lead to the oxidation of critical cellular components culminating in cell death. Over the last few years, we have characterized the molecular and cellular events underlying nerve cell death induced by oxidative stress using the mouse hippocampal cell line HT-22 and cortical neurons [for review see 7]. This pathway of programmed cell death, termed oxytosis [7], is initiated by the addition of glutamate or other compounds such as homocysteic acid (HCA) to the extracellular medium. Glutamate or HCA then inhibit the uptake of cystine, which is required for GSH synthesis, resulting in the depletion of GSH in neurons. Subsequently, this decrease in cellular GSH results in the production of ROS by mitochondria. The importance of mitochondria in ROS production is supported by the observation that the mitochondrial uncoupler cyanide p-trifluoromethoxyphenylhydrazone (FCCP) and other mitochondrial inhibitors protect neuronal cells from glutamate toxicity [8]. ROS accumulation gives rise to Ca2+ influx from the extracellular medium, which leads to a form of cell death with characteristics of both apoptosis and necrosis. In addition to the elucidation of the steps involved in oxytosis, HT-22 cells have been used to screen potentially therapeutic drugs for the treatment of clinical conditions involving oxidative stress [for review see 7].
In the work reported here, the HT-22 cell model was used in conjunction with four mechanistically and structurally distinct proteasome inhibitors [2] to address the role of the ubiquitin-proteasome pathway in oxidative stress-induced nerve cell death. The different proteasome inhibitors used interact via distinct mechanisms with the catalytic N-terminal threonine in the active site of the proteasome. In addition, as distinct from the other inhibitors used, the interaction of MG132 with this site is reversible. The results show that at low concentrations, proteasome inhibitors are neuroprotective. Surprisingly, much of their neuroprotective activity appears to be dependent on their ability to activate the transcription factor NF-κB. Confirmation that NF-κB plays a role in the protective effect elicited by treatment with proteasome inhibitors came from studies utilizing a variant line of HT22 cells that stably expresses an NF-κB super-repressor and is unable to activate NF-κB in response to either TNF-κ, a classical inducer of NF-κB or the proteasome inhibitors. NF-κB activation in the HT22 cells is a result of the mild oxidative stress, as defined by increases in ROS production and decreases in GSH levels, induced by treatment with the proteasome inhibitors. Together, these studies demonstrate a novel activity for proteasome inhibitors that may have clinical relevance.
2. Materials and Methods
2.1 Chemicals
2′, 7′-dichlorodihydrofluorescein diacetate (H2DCF-dA) was purchased from Molecular Probes (Eugene, OR). Proteasome inhibitors (MG132, lactacystin, ALLN and epoxomicin), Bay11-7082 and TNFα were purchased from Calbiochem (San Diego, CA). All other chemicals were from Sigma (St. Louis, MO).
2.2 Cell Culture and Viability Assays
HT22 cells were grown on tissue culture dishes in DMEM-high glucose supplemented with 10% FCS as described [9]. A variant line of HT22 cells that stably expresses an NF-kB super-repressor was generated as described [10]. MEF cells containing either wild-type eIF2α (S/S) or a mutant version containing Ala substituted for the phosphorylated Ser-51 residue (A/A) were obtained from Randall Kaufman (University of Michigan) and grown as described [11]. Primary rat cortical neurons were prepared and grown as described [12]. Cell viability was determined by a modified version of the 3-(4,5-dimethylthiazol-2-yl)-2,5-diphenyl tetrazolium bromide (MTT) assay based on the standard procedure [13]. The cells were plated into 96 well dishes at 5 × 10³ cells/dish in complete medium and 18 hr later the medium was replaced with DMEM-high glucose supplemented with 7.5% dialyzed FCS (DFCS) and the experimental agents were added. In some experiments, cystine-free DMEM-high glucose supplemented with 7.5% DFCS was used in order to deplete cysteine from cells. HT-22 cells were exposed to H2O2 for 2 hr following a 30 min pretreatment with the proteasome inhibitors and cell viability was determined 24 hr later by the MTT assay. 24 hr after the addition of the experimental agents, the cell culture medium in each dish was aspirated and replaced with 100 μl DMEM-high glucose with 7.5% DFCS containing 2.5 μg/ml MTT. After 4 hours of incubation at 37 C, the cells were solubilized by the addition of 100 μl of a solution containing 50% dimethylformamide and 20% SDS (pH 4.7). The absorbance at 560 nm was measured on the following day with a microplate reader. Results obtained from the MTT assay correlated directly with the extent of cell death as confirmed visually. Controls employing wells without cells and cells without the experimental agents were used to determine the effects of agents upon the assay chemistry or cell viability, respectively.
2.3 Microscopy
A light microscope (Inverted Microscope Diaphot-TMD, Nikon, Japan) equipped with a phase contrast condenser (Phase contrast-2 ELWD 0.3, Nikon, Japan), 10X objective lens, and a digital camera (Coolpix 990, Nikon, Japan) was used to capture the images with the manual setting.
2.4 Total Intracellular GSH/GSSG
Cells were washed twice with ice-cold PBS, collected by scraping, and lysed with 3% sulfosalicylic acid. Lysates were incubated on ice for 10 minutes and supernatants were collected after centrifugation in an Eppendorf microfuge. Upon neutralization of the supernatant with triethanolamine, the concentration of total glutathione (reduced and oxidized) was determined by the method of Tietze [14] with modifications [15]. The protein content of each sample was determined using the BCA Protein Assay kit from Pierce (Rockford, IL) with BSA as a standard.
2.5 Reactive Oxygen Species (ROS) Level
The intracellular accumulation of ROS in the HT22 cells was determined with H2DCF-dA in combination with flow cytometry as described previously [12]. This non-fluorescent compound accumulates within cells upon de-acetylation. H2DCF then reacts with ROS to form fluorescent dichlorofluorescein (DCF).
2.6 Immunoblotting
For immunoblotting, cells from the same density cultures as used for the cell death assays were washed twice in cold phosphate-buffered saline (PBS) then scraped into lysis buffer containing 50 mM HEPES, pH 7.4, 150 mM NaCl, 50 mM NaF, 1.5 mM MgCl2, 1 mM EGTA, 10% glycerol, 1% Triton X-100, 10 mM sodium pyrophosphate, 1 mM Na3VO4, 1 mM phenylmethylsulfonyl fluoride (PMSF), 15 μg/ml aprotinin, 1 μg/ml pepstatin, and 5 μg/ml leupeptin. Lysates were incubated at 4 °C for 30 min, then cleared by centrifugation at 14,000 rpm for 10 min. For immunoblotting of nuclear p65 and IκBα, nuclear extracts were prepared as described [16]. Briefly, HT22 cells in 60 mm dishes at the same density as used for the cell death assays were washed twice in ice-cold TBS, then gently scraped into 400 μl of cold homogenization buffer (10 mM HEPES, pH 7.9, 10 mM KCl, 0.1 mM EDTA, 0.1 mM EGTA, 1 mM DTT, 0.5 mM PMSF) and allowed to swell on ice for 15 min. Cells were lysed by addition of 25 μl of a 10% solution of NP-40 followed by 10 s vigorous vortexing. Nuclei were pelleted by centrifugation at 14,000 rpm for 30 s. The cytoplasmic fraction was removed, and nuclei were washed twice in homogenization buffer with NP-40 and resuspended in 100 μl of the same buffer. Nuclei were solubilized by sonication. Protein concentrations were determined using the BCA protein assay (Pierce, Rockford, IL). Equal amounts of protein were solubilized in 2.5X SDS-sample buffer, separated on 10% SDS-polyacrylamide gels and transferred to nitrocellulose [12] Transfers were blocked for 2 hours at room temperature with 5% nonfat milk in TBS/0.1% Tween 20 and then incubated overnight at 4°C in the primary antibody diluted in 5% BSA in TBS/0.05% Tween 20. The primary antibodies used were: anti-IκBα (#SC13032; 1/1000) and anti-p65 (#SC-372; 1/1000) from Santa Cruz and anti-phosphoIκBα (Ser32) (#9241;1/1000) and anti-phosphoIKKα/β (Ser176/180) (#2694;1/1000) from Cell Signaling. The transfers were rinsed with TBS/0.05% Tween 20 and incubated for 1 hour at room temperature in horseradish peroxidase-goat anti-rabbit or goat anti-mouse (Biorad) diluted 1/5000 in 5% nonfat milk in TBS/0.1% Tween 20. The immunoblots were developed with the Super Signal reagent (Pierce).
2.7 Immunoprecipitation
For immunoprecipitation of IκBα [12], cells in 60 mm dishes from the same density cultures as used for the cell death assays were washed twice in cold phosphate-buffered saline (PBS) then scraped into lysis buffer containing 50 mM HEPES, pH 7.4, 150 mM NaCl, 50 mM NaF, 1.5 mM MgCl2, 1 mM EGTA, 10% glycerol, 1% Triton X-100, 10 mM sodium pyrophosphate, 1 mM Na3VO4, 1 mM phenylmethylsulfonyl fluoride (PMSF), 15 μg/ml aprotinin, 1 μg/ml pepstatin, and 5 μg/ml leupeptin. In some cases, cells were treated with 200 μM pervanadate, prepared as described [17], for 15 min. Lysates were incubated at 4 °C for 30 min, then cleared by centrifugation at 14,000 rpm for 10 min. Equal amounts of protein were immunoprecipitated overnight with anti-IκBα and collected with protein A-Sepharose. After washing, the immunoprecipitates were solubilized in 2.5X SDS-sample buffer and analyzed by SDS-polyacrylamide gel electrophoresis and immunoblotting as described above. The primary antibodies used were: anti-IκBα (#SC13032; 1/1000) and anti-phosphotyrosine (#9411;1/2000) from Cell Signaling.
2.8 Electrophoretic Mobility Shift Assays (EMSAs)
For the EMSAs, cells in 60 mm dishes from the same density cultures as used for the cell death assays were washed twice in cold Tris-buffered saline (TBS) and nuclei prepared as described [16]. The nuclei were extracted by 15 min vigorous shaking at 4°C in 20 mM HEPES, pH 7.9, 0.4 M NaCl, 1 mM EDTA, 1 mM EGTA, 1 mM DTT and 1 mM PMSF and the supernatant collected following centrifugation and stored at −70°C [16]. EMSA analysis was performed using a kit from Promega according to the manufacturer’s instructions. Briefly, equal amounts of protein (5–10 μg) were pre-incubated for 10 min at room temperature in gel shift binding buffer (10 mM Tris-HCl, pH 7.5, 50 mM NaCl, 1 mM MgCl2, 0.5 mM EDTA, 0.5 mM DTT, 4% glycerol, 0.05 mg/ml poly(dI-dC)•poly (dI-dC)) and then 1 μl of 32P-labeled NF-κB probe (Promega) (50–75,000 cpm/μl) was added for 20 min. The complexes were analyzed by electrophoresis through a Novex 6% DNA retardation gel and autoradiography. In some experiments, antibodies to either p50 or p65 (#SC-1190 and SC-7151; Santa Cruz) were included in the preincubation mix.
2.9 Proteasome Activity Assay
To assay the effects of the proteasome inhibitors on proteasome activity, cells in 60 mm dishes from the same density cultures as used for the cell death assays were treated with varying concentrations of the proteasome inhibitors for 6 hr. The cells were then scraped into assay buffer (50 mM HEPES, pH 7.8, 10 mM NaCl, 1.5 mM MgCl2, 1 mM EDTA, 1 mM EGTA, 250 mM sucrose, 5 mM DTT and 2 mM ATP), sonicated and centrifuged at 16,000 x g for 10 min at 4°C [18]. The supernatants were assayed for proteasome activity using 100 μM Suc-LLVY-AMC in a final volume of 250 μl. The mixture was incubated for at 37°C for 60 min and then the released fluorogenic AMC was measured at 360 nm excitation and 460 nm emission using a fluorometric plate reader. Relative fluorescence units (RFU) were normalized to protein values determined using the Bradford protein assay kit.
Statistical Analysis
Experiments presented were repeated at least three times with duplicate or triplicate samples. The data are presented as means ± SD. Statistical differences were analyzed using the unpaired Student’s t test.
3.0 Results
3.1 Effect of Proteasome Inhibitors on Oxidative Stress-Induced Cell Death
To determine if proteasome inhibitors can protect nerve cells from oxidative glutamate toxicity, HT22 cells were treated with 5 mM glutamate for 24 hr in the presence of lactacystin, a well characterized proteasome inhibitor and cell survival was determined by light microscopy. As shown in Figure 1A, 1 μM lactacystin significantly reduced cell death.
Figure 1. The cytotoxic response of HT-22 cells to glutamate and protection by proteasome inhibitors.
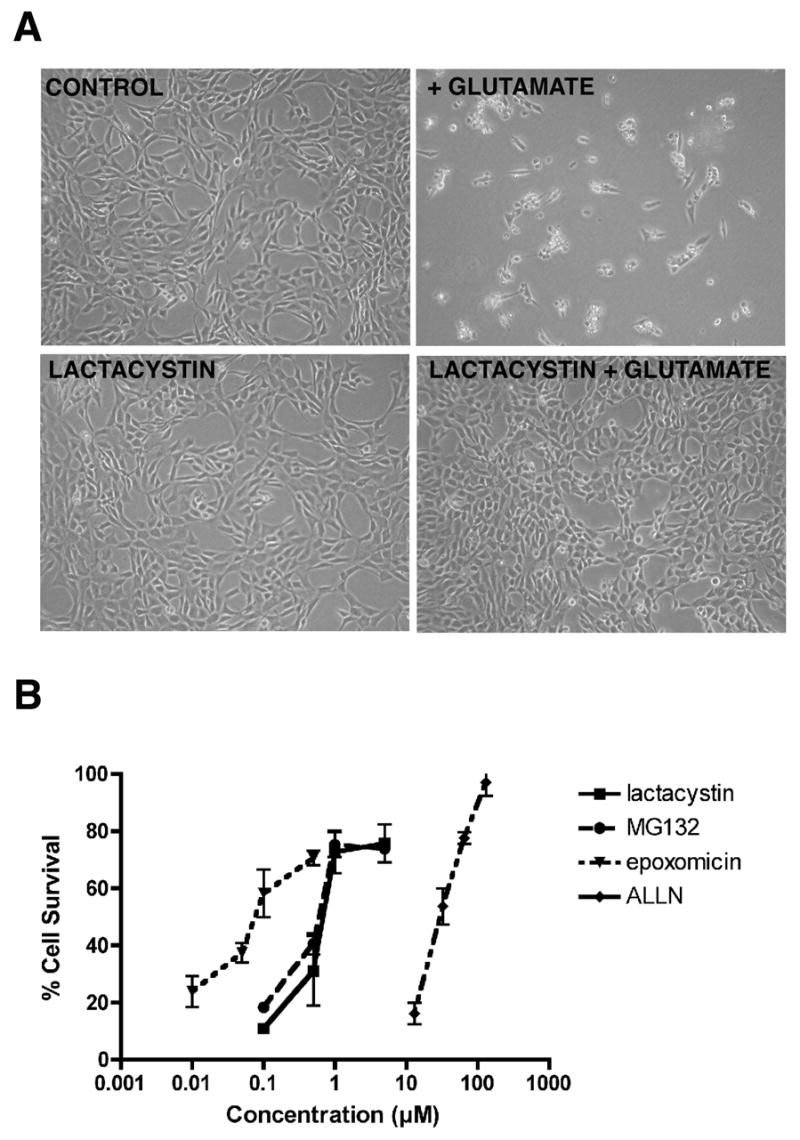
(A) HT-22 cells were exposed to either no glutamate or 5 mM glutamate alone or in the presence of 1 μM lactacystin. 24 hours later the cells were examined and photographed by phase contrast microscopy. (B) HT22 cells were treated with 5 mM glutamate alone (0) or in the presence of epoxomicin, MG132, lactacystin or ALLN. 24 hr later cell survival was measured by the MTT assay. The results presented are the average ± S.D. of 3–5 independent experiments. Survival in the absence of proteasome inhibitors was 11.8 ± 7.5%.
To quantify the protection provided by lactacystin as well as other, structurally distinct proteasome inhibitors, the HT22 cells were treated with glutamate and a range of concentrations of each proteasome inhibitor and cell survival measured after 24 hr by the MTT assay. As shown in Figure 1B, epoxomicin provided some protection at concentrations as low as 50 nM with maximal protection seen at 500 nM. Both lactacystin and MG132 required ~10 fold higher concentrations with some protection seen at 0.5 μM and maximal protection at 1–5 μM. ALLN required significantly higher concentrations for protection, consistent with its higher Ki [2].
Many of the compounds that protect cells against glutamate toxicity also protect cells from other agents that induce oxidative stress. To determine if this was also the case with the proteasome inhibitors, HT-22 cells were incubated with HCA, cystine-free medium, H2O2, or rotenone in the presence of various concentrations of the proteasome inhibitors and cell viability was determined as before. In the presence of 2.5 mM HCA, cell viability decreased to 10% of control (Fig. 2A). All of the proteasome inhibitors tested protected the HT-22 cells from HCA, even though somewhat higher concentrations were required for maximal protection as compared with glutamate. In the absence of cystine, cell viability decreased to 5% of control (Fig. 2A). All of the proteasome inhibitors tested also protected the HT-22 cells from cystine depletion, even though again somewhat higher concentrations were required for maximal protection (Fig. 2A). In contrast, none of the proteasome inhibitors tested provided any protection against H2O2 at any concentration tested (Fig. 2A), even when the pretreatment period was extended up to 6 hr (data not shown). In contrast, the proteasome inhibitors did provide protection against the mitochondrial toxin, rotenone (Fig. 2A).
Figure 2. (A) Proteasome inhibitors protect nerve cells from multiple oxidative insults.
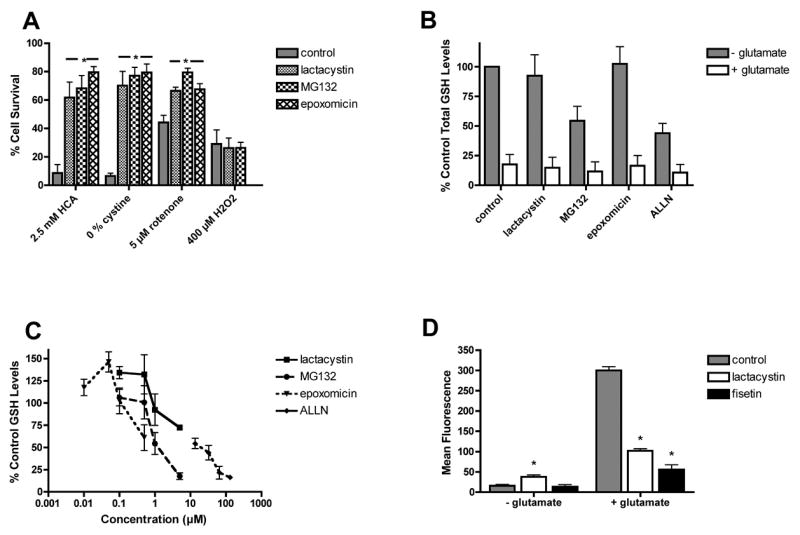
HT-22 cells were treated with 2.5 mM HCA, cystine-free medium (0 cystine), 5 μM rotenone or 400 μM H2O2 alone or in the presence of 5 μM MG132, 5 μM lactacystin or 0.5 μM epoxomicin. 24 hr later cell survival was measured by the MTT assay. The results presented are the average ± S.D. of three independent experiments. (B–D) Effects of proteasome inhibitors on cellular levels of glutathione (GSH) and reactive oxygen species (ROS). (B) HT22 cells were untreated (control) or treated with 5 mM glutamate alone or in the presence of 1 μM lactacystin and MG132, 0.1 μM epoxomicin or 35 μM ALLN for 8 hr. After 8 hr, cell extracts were prepared and assayed for total glutathione using a chemical assay. The total glutathione levels were normalized to protein content and are expressed as the % of total glutathione in untreated cells (57.8 ± 15 nmoles/mg protein). The results presented are the average ± S.D. of three independent experiments. (C) HT22 cells were treated with different concentrations of the proteasome inhibitors epoxomicin, lactacystin, MG132 or ALLN for 8 hr. After 8 hr, cell extracts were prepared and assayed for total glutathione using a chemical assay. The total glutathione levels were normalized to protein content and are expressed as the % of total glutathione in untreated cells. The results presented are the average ± S.D. of two independent experiments. (D) HT22 cells were untreated or treated with 5 mM glutamate in the absence or presence of 1 μM lactacystin or 10 μM fisetin as a positive control. After 11 hr, the cells were loaded with H2DCF-dA and processed for FACS analysis. The cellular levels of ROS were measured using DCF fluorescence and the fold increase in the median DCF fluorescence intensity with respect to that of the control was plotted. The results are the means of duplicate determinations ± SD. Similar results were obtained in 2–3 independent experiments. * indicates significantly different from control or glutamate alone (P < 0.001).
3. 2 Effect of Proteasome Inhibitors on Markers of Oxidative Stress
The results with H2O2 suggested that the proteasome inhibitors might act at an early step in the cell death process, prior to the generation and accumulation of ROS. To determine if the proteasome inhibitors affect cellular GSH levels, the HT22 cells were treated for 8 hr with the most effective doses of each proteasome inhibitor alone or in the presence of 5 mM glutamate. As shown in Figure 2B, none of the proteasome inhibitors blocked the decrease in GSH seen following glutamate treatment. Furthermore, treatment of cells for 8 hr with increasing concentrations of the proteasome inhibitors in the absence of glutamate resulted in dose dependent effects on GSH levels (Fig. 2C). Low doses of all of the proteasome inhibitors except ALLN, which provided little or no protection, increased GSH levels. In contrast, higher, neuroprotective doses decreased GSH levels although the decreases were more dramatic for MG132 than for lactacystin or epoxomicin. ALLN decreased GSH levels at all doses tested.
To determine if proteasome inhibitors can block ROS production, HT-22 cells were treated with 5 mM glutamate in the presence of the proteasome inhibitor lactacystin for 11 hours. The mean DCF fluorescence increased dramatically in the HT-22 cells treated with glutamate (Fig. 2D). Treatment of the cells with lactacystin alone also resulted in a moderate but significant increase in basal ROS levels. However, co-treatment of the cells with glutamate and lactacystin (Fig. 2D) prevented the massive accumulation of ROS normally seen following glutamate treatment (Fig. 2D). Fisetin, a flavonoid with antioxidant properties [15], was used as a positive control.
3.3 Effect of Neuroprotective Doses of Proteasome Inhibitors on Proteasome Activity
To determine if the protective effect of the proteasome inhibitors on oxidative stress-induced cell death correlated with the inhibition of proteasome activity, the concentration-dependent effects of the inhibitors on proteasome activity were assayed. As shown in Figure 3, there did not appear to be a good correlation between the level of inhibition of proteasome activity and the amount of neuroprotection provided by each of the proteasome inhibitors suggesting that the protective action of the proteasome inhibitors might not be directly related to their inhibition of proteasome enzymes.
Figure 3. Effects of proteasome inhibitors on proteasome activity.
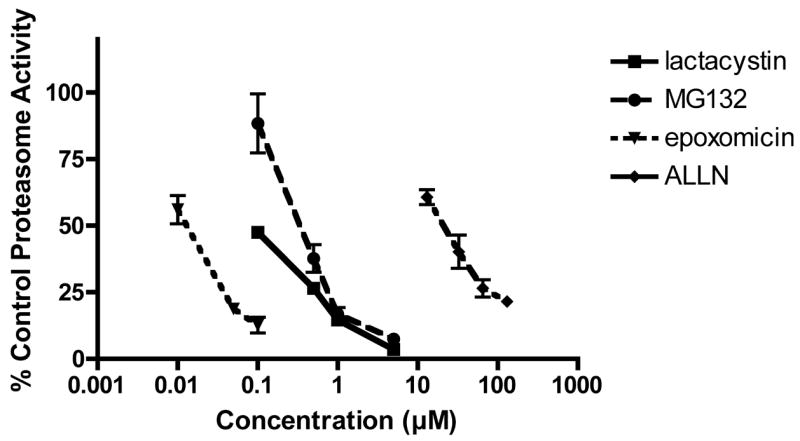
HT22 cells were untreated or treated for 6 hr with increasing concentrations of lactacystin, MG132, epoxomicin or ALLN. The cells were scraped into lysis buffer, sonicated and assayed for proteasome activity using Suc-LLVY-AMC. Relative fluorescence units (RFU) were normalized to protein values. Results are the average of 3 independent experiments.
3.4 Effect of Proteasome Inhibitors on NF-κB Activity
Because proteasome inhibition per se may not explain the neuroprotective effects of the proteasome inhibitors, a variety of different agents that inhibit intracellular signaling pathways were used to determine if they could be involved in the neuroprotection caused by proteasome inhibitors. Based on the outcome from these experiments, the ability of proteasome inhibitors to activate NF-κB was examined using electrophoretic mobility shift assays (EMSAs). As shown in Figure 4A and B, lactacystin activates NF-κB in a dose- and time-dependent fashion. Similar results were seen with the other proteasome inhibitors (Fig. 5C, 8B and data not shown). The specificity of the NF-κB binding was confirmed by adding nonradiolabeled competitor DNA to the EMSA reaction mixture (Fig. 4C). The subunit composition of the proteasome-induced NF-κB complex was assessed using antibodies directed against either the p50 or p65 subunits of NF-κB in combination with the EMSA. Antibodies to both subunits supershifted the NF-κB band indicating that the proteasome-induced complex contains both p50 and p65 (Fig. 4C). The ability of the proteasome inhibitors to induce NF-κB activation is not limited to HT22 cells. Similar results were obtained with primary cultures of cortical neurons (Fig. 7C) and with mouse fibroblasts (Fig. 6A). Thus, the activation of NF-κB by proteasome inhibitors is not a unique property of HT22 cells nor is it specific to nerve cells.
Figure 4. Proteasome inhibitors activate NF-κB HT22 cells were treated with lactacystin at different doses for 4 hr.

(A) or with 1 μM lactacystin for different time periods (B). Nuclear extracts were prepared from the cells and equal amounts of protein were used in each EMSA mixture containing radiolabeled DNA with an NF-κB binding site. EMSA mixtures were separated by electrophoresis and bound DNAs were visualized by autoradiography. Similar results were obtained in 3–5 independent experiments. (C) Specificity of NF-κB activation by proteasome inhibitors. HT22 cells were treated with 5 μM lactacystin for 4 hr, nuclear extracts were prepared from the cells and equal amounts were used in each EMSA mixture containing radiolabeled DNA with an NF-κB binding site. EMSA mixtures were separated by electrophoresis and bound DNAs were visualized by autoradiography. Competition: To determine the specificity for the NF-κB binding site, nonradiolabeled DNA containing either the NF-κB binding site or the unrelated Oct1 binding site was added to the EMSA binding mixtures at a 10x or 100x molar excess. Supershift: To determine which NF-κB subunits interact with the radiolabeled DNA containing the NF-κB binding site, antibodies that specifically recognize p50 or p65 were included in the EMSA mixture. Similar results were obtained in three independent experiments.
Figure 5. (A) & (B) Proteasome inhibitors increase the levels of MnSOD which is dependent on NF-κB activity.
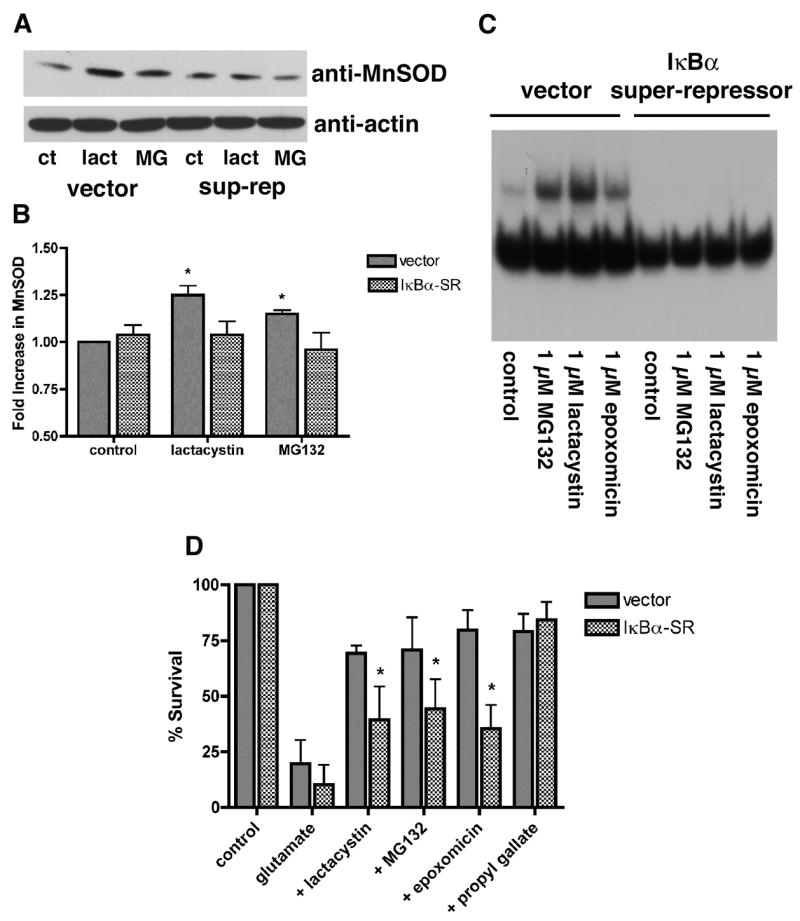
(A) HT22 cells were stably transfected with vector alone or with vector containing a super-repressor form of IκBα, which is resistant to both phosphorylation and degradation and therefore permanently prevents the nuclear translocation of NF-κB. Vector- and IκBα-super-repressor-transfected (sup-rep) cells were untreated (control) or treated with 1 μM MG132 or lactacystin for 24 hr. The cells were scraped into lysis buffer, sonicated and equal amounts of protein were analyzed by SDS-gel electrophoresis and immunoblotting with an anti-MnSOD antibody and an anti-actin antibody as a loading control. Similar results were obtained in two independent experiments. (B) The results from the two independent experiments, one of which is shown in (A), were quantified by scanning and analysis with NIH Image. * indicates significantly different from control (P<0.05). An IκBα super-repressor blocks activation of NF-κB by proteasome inhibitors (C) and reduces the protection from oxidative stress-induced death (D). (C) HT22 cells were stably transfected with vector alone or with vector containing the super-repressor form of IκBα Vector- and IκBα-super-repressor-transfected cells were untreated (control) or treated with 1 μM MG132 or lactacystin or 0.1 μM epoxomicin for 4 hr. Nuclear extracts were prepared from the cells and equal amounts were used in each EMSA mixture containing radiolabeled DNA with an NF-κB binding site. EMSA mixtures were separated by electrophoresis and bound DNAs were visualized by autoradiography. Similar results were obtained in three independent experiments. (D) HT22 cells were stably transfected with vector alone or with vector containing the super-repressor form of IκBα. Vector- and IκBα-super-repressor-transfected (IκBα-SR) cells were untreated (control), treated with 5 mM glutamate alone (glutamate) or treated with 5 mM glutamate in the presence of 1 μM MG132, 1 μM lactacystin, 0.1 μM epoxomicin or 10 μM propyl gallate. 24 hr later cell survival was measured by the MTT assay. The results presented are the average ± S.D. of five independent experiments.
Figure 8. The IKK inhibitor Bay11-7082 blocks activation of IκBα and NF-κB by proteasome inhibitors.
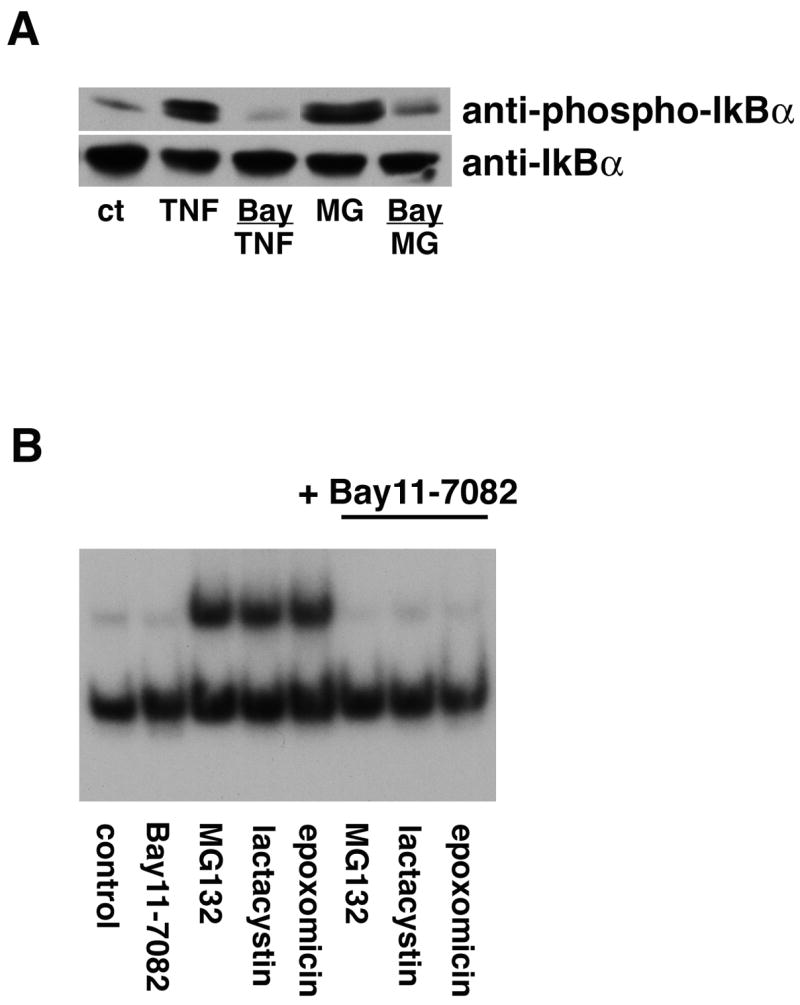
(A) HT22 cells were untreated (ct) or treated with 10 μg/ml TNF-α for 5 min or 1 μM lactacystin for 4 hr alone or in the presence of Bay11-7082. Cell extracts were prepared and equal amounts of protein were analyzed by immunoblotting with antibodies to phosphorylated IκBα (anti-P-IκBα) and total IκBα (anti-IκBα). Similar results were obtained in two independent experiments. (B) HT22 cells were treated with 1 μM lactacystin or MG132 or 0.1 μM epoxomicin for 4 hr alone or in the presence of Bay11-7082. Nuclear extracts were prepared from the cells and equal amounts were used in each EMSA mixture containing radiolabeled DNA with an NF-κB binding site. EMSA mixtures were separated by electrophoresis and bound DNAs were visualized by autoradiography. Similar results were obtained in 2 independent experiments.
Figure 7. Proteasome inhibitors induce the phosphorylation of IκBα and IKK.

(A) HT22 cells were untreated (ct) or treated with 0.50 to 25 μM lactacystin for 4 hr. Cell extracts were prepared and equal amounts of protein were analyzed by immunoblotting with antibodies to phosphorylated IκBα (anti-P-IκBα), total IκBα (anti-IκBα) and phosphorylated IKKα/β (anti-IKKα/β). Similar results were obtained in two independent experiments. (B) HT22 cells were untreated (ct) or treated with 1 μM lactacystin for 30 min to 6 hr. Cell extracts were prepared and equal amounts of protein were analyzed by immunoblotting with antibodies to phosphorylated IκBα (anti-P-IκBα), total IκBα (anti-IκBα) and phosphorylated IKKα/β (anti-IKKα/β). Similar results were obtained in three independent experiments. (C) Primary rat cortical neurons were untreated (ct) or treated with 1 μM or 5 μM lactacystin for 2 to 6 hr. Cell extracts were prepared and equal amounts of protein were analyzed by immunoblotting with antibodies to phosphorylated IκBα (anti-P-IκBα), total IκBα (anti-IκBα) and phosphorylated IKKα/β (anti-IKKα/β). Similar results were obtained in two independent experiments. (D) HT22 cells were untreated (ct), treated with 1 μM lactacystin for 30 min to 6 hr or treated with 10 μg/ml TNF-α for 20 min as a positive control. Cells were fractionated and equal amounts of protein from the nuclear fractions were analyzed by immunoblotting with antibodies to p65 (anti-p65) and IκBα (anti-IκBα). The cytoplasmic fraction (cyto) from the controls was run as a positive control for the immunoblotting. Similar results were obtained in three independent experiments.
Figure 6. Activation of NF-kB by proteasome inhibitors does not involve novel pathways.
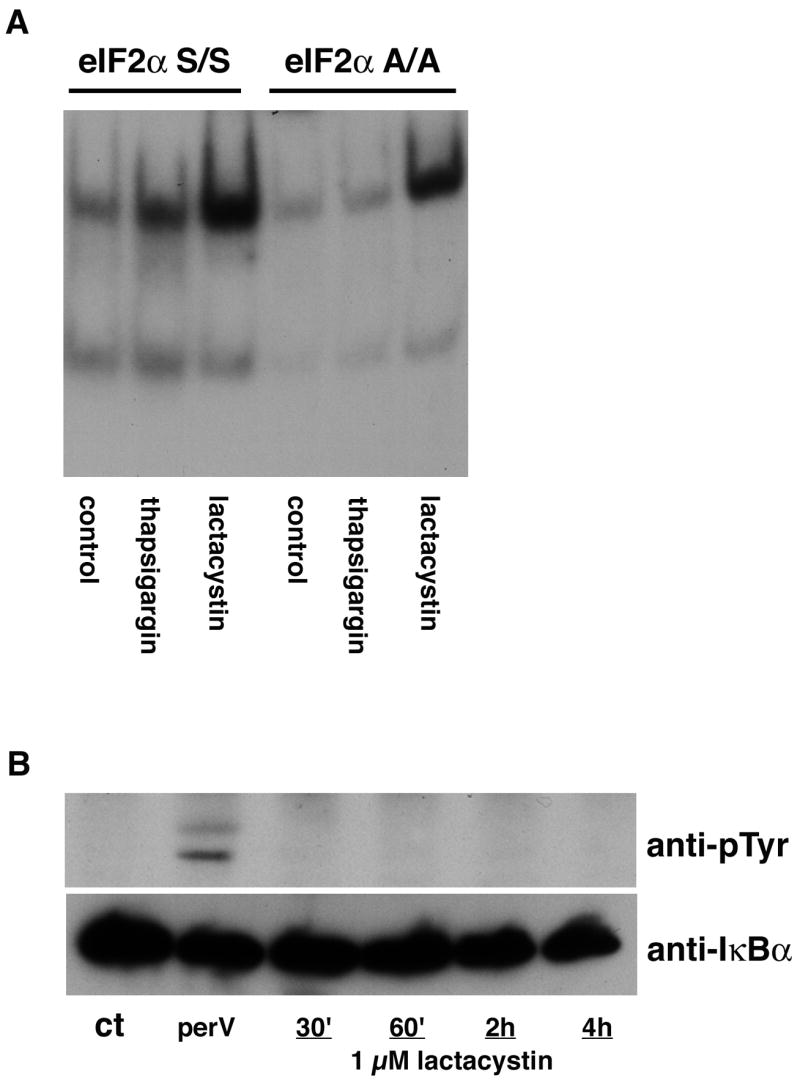
(A) MEF expressing wild type (S/S) or mutant, nonphosphorylatable (A/A) eIF2α were untreated (control) or treated with 1 μM lactacystin for 4 hr or thapsigargin as a positive control. Nuclear extracts were prepared from the cells and equal amounts were used in each EMSA mixture containing radiolabeled DNA with an NF-κB binding site. EMSA mixtures were separated by electrophoresis and bound DNAs were visualized by autoradiography. Similar results were obtained in two independent experiments. (B) HT22 cells were untreated (ct), treated with pervanadate for 15 min or treated with 1 μM lactacystin for 30 min to 4 hr. Cell extracts were prepared and IκBα immunoprecipitated from the extracts followed by immunoblotting with an antibody to phosphotyrosine (anti-pTyr) and IκBα (anti-IκBα as a loading control. Similar results were obtained in three independent experiments.
To demonstrate that the activation of NF-κB by the proteasome inhibitors is functionally significant, the ability of the proteasome inhibitors to increase the levels of Mn superoxide dismutase (Mn SOD), a protein that is downstream of NF-κB activation [19], was examined. As shown in Figures 5A and B, untreated HT-22 cells express moderate levels of MnSOD which is significantly increased after treatment for 24 hr with lactacystin or MG132. This upregulation is blocked in cells expressing a super-repressor of NF-κB activation (Fig. 5A and B).
To confirm that NF-κB plays a role in the protective effect elicited by treatment of the HT22 cells with proteasome inhibitors, mutant HT22 cells expressing an NF-κB super-repressor were used. The proteasome inhibitors are significantly less effective at protecting the mutant cells from oxidative glutamate toxicity while cells expressing vector alone show a similar level of protection as wild type cells (Fig. 5D). In contrast, protection by the antioxidant propyl gallate was not affected in the cells expressing the NF-κB super-repressor (Fig. 5D).
3.5 Mechanisms Underlying Activation of NF-κB by Proteasome Inhibitors
To address the mechanisms underlying the activation of NF-κB by the proteasome inhibitors two non-traditional pathways of NF-kB activation, ER stress-dependent activation via the translation initiation factor eIF2α and activation by tyrosine phosphorylation of IκB were investigated first. To address ER stress-dependent activation, MEF containing either wild type (S/S) or mutant (A/A) eIF2α were used. As reported [20], classical ER stress inducers such as thapsigargin fail to induce NF-κB activation in the A/A cells (Fig. 6A) while proteasome inhibitors can still activate NF-κB in these cells. Similarly, proteasome inhibitors did not induce the tyrosine phosphorylation of IκBα although this was readily detectable after treatment of the cells with pervanadate (Fig. 6B).
Given that non-traditional pathways did not appear to play a role in NF-κB activation by proteasome inhibitors, it was next asked if the activation involved part of the classical pathway. To this end, the phosphorylation of IκB on serines 32 and 36 after treatment of the HT22 cells with proteasome inhibitors was examined using an antibody specific to the phosphorylated form of the protein. Lactacystin (Fig. 7A–C), as well as the other proteasome inhibitors (data not shown), induced a dose and time dependent increase in IκB phosphorylation in both HT22 cells (Fig. 7A and B) and primary rat cortical neurons (Fig. 7C). In addition, a similar increase in the activation of the upstream kinases IKKα/β was also seen (Fig. 7A and B) indicating that proteasome inhibitors increase IκBα phosphorylation by a classical mechanism. Furthermore, consistent with the EMSA data, lactacystin induced the nuclear accumulation of p65 with a similar time course (Fig. 7D). In contrast, little or no nuclear accumulation of IκBα was seen (Fig. 7D).
Bay 11-7082 is an inhibitor of IκBα phosphorylation at serines 32 and 36 and can block TNF-α-induced NF-κB activation [21]. To determine if phosphorylation of IκB on serines 32 and 36 by proteasome inhibitors is required for NF-κB activation, cells were pretreated with 10 μM Bay 11-7082 before treatment with lactacystin and then IκBα phosphorylation was determined by immunoblotting and NF-κB activation assessed by EMSA. As shown in Figure 8, Bay 11-7082 significantly reduced IκB phosphorylation and blocked NF-κB activation by lactacystin and other proteasome inhibitors. Treatment with TNF-α was used as a positive control. Taken together, these data demonstrate that proteasome inhibitors activate NF-κB through the classical pathway involving phosphorylation of IκB on serines 32 and 36. The effect of Bay 11-7082 on the protection of cells from oxidative glutamate toxicity by the proteasome inhibitors could not be determined because Bay 11-7082 itself exhibited significant levels of toxicity.
To test the possibility that oxidative stress was involved in the activation of NF-κB by proteasome inhibitors, the effect of a number of different antioxidants on IKKα/β and IκBα phosphorylation and NF-κB activation by lactacystin was examined. While some antioxidants such as propyl gallate and vitamin E had no effect on any of these parameters (data not shown), a number of others dose dependently blocked IKKα/β and IκBα phosphorylation and NF-κB activation (Fig. 9A–C). The effective antioxidants included N-acetylcysteine, resveratrol, and GSH (not shown). Since all of the antioxidants themselves protect cells from oxidative glutamate toxicity, their effects on the protection by the proteasome inhibitors could not be examined.
Figure 9. Antioxidants block IκBα and IKKα/β activation by proteasome inhibitors.
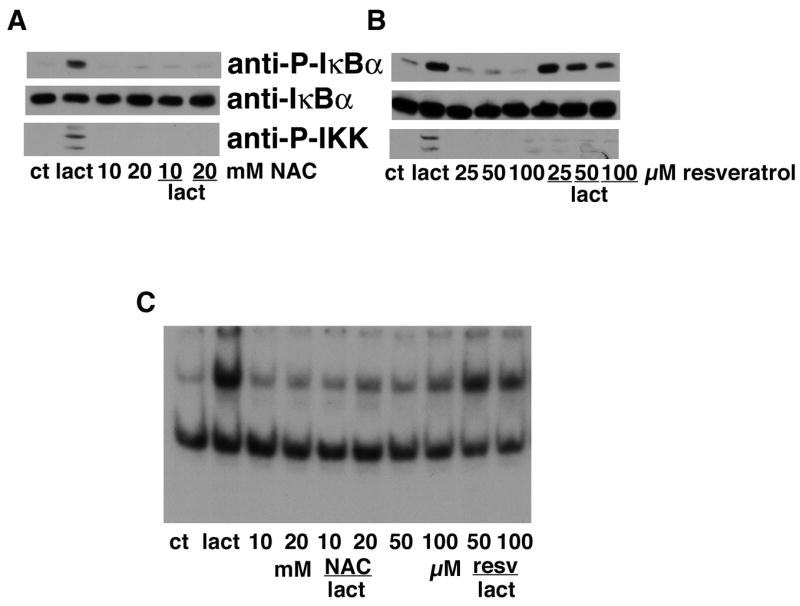
(A) HT22 cells were untreated (ct) or treated with 1 μM lactacystin for 4 hr alone or in the presence of 10 or 20 mM N-acetylcysteine (NAC). Cell extracts were prepared and equal amounts of protein were analyzed by immunoblotting with antibodies to phosphorylated IκBα (anti-PIκBα), total IκBα (anti-IκBα) and phosphorylated IKKα/β (anti-IKKα/β). Similar results were obtained in four independent experiments. (B) HT22 cells were untreated (ct) or treated with 1 μM lactacystin for 4 hr alone or in the presence of 25, 50 or 100 μM resveratrol. Cell extracts were prepared and equal amounts of protein were analyzed by immunoblotting with antibodies to phosphorylated IκBα (anti-P-IκBα) and total IκBα (anti-IκBα). Similar results were obtained in two independent experiments. (C) HT22 cells were treated with 1 μM lactacystin for 4 hr alone or in the presence of 10 or 20 mM NAC or 50 or 100 μM resveratrol. Nuclear extracts were prepared from the cells and equal amounts were used in each EMSA mixture containing radiolabeled DNA with an NF-κB binding site. EMSA mixtures were separated by electrophoresis and bound DNAs were visualized by autoradiography. Similar results were obtained in 2 independent experiments.
A major source of ROS within the cell is the mitochondria [22] and proteasome inhibitors can induce mitochondrial oxidative stress [23, 24]. To test the idea that ROS produced by the mitochondria were responsible for the oxidant-induced activation of NF-κB by proteasome inhibitors, two pharmacological agents that reduce mitochondrial ROS production, DPI and FCCP, were used. As shown in Figure 10, both compounds dose dependently blocked IKKα/β and IκBα phosphorylation and NF-κB activation by lactacystin providing strong evidence for a critical role of mitochondrial ROS in the activation of NF-κB by proteasome inhibitors. Since both DPI and FCCP themselves protect cells from oxidative glutamate toxicity, their effects on protection by the proteasome inhibitors could not be examined.
Figure 10. Inhibitors of mitochondrial ROS production block IκBα and IKKα/β activation by proteasome inhibitors.

(A) HT22 cells were untreated (ct) or treated with 1 μM lactacystin for 4 hr alone or in the presence of 5 or 10 μM diphenyliodinium (DPI). Cell extracts were prepared and equal amounts of protein were analyzed by immunoblotting with antibodies to phosphorylated IκBα (anti-P-IκBα), total IκBα (anti-IκBα) and phosphorylated IKKα/β (anti-IKKα/β). Similar results were obtained in two independent experiments. (B) HT22 cells were untreated (ct) or treated with 1 μM lactacystin for 4 hr alone or in the presence of 1, 2.5 or 5 μM FCCP. Cell extracts were prepared and equal amounts of protein were analyzed by immunoblotting with antibodies to phosphorylated IκBα (anti-P-IκBα) and total IκBα (anti-IκBα). Similar results were obtained in two independent experiments. (C) HT22 cells were treated with 1 μM lactacystin for 4 hr alone or in the presence of 10 μM DPI or 1 or 2.5 μM FCCP. Nuclear extracts were prepared from the cells and equal amounts were used in each EMSA mixture containing radiolabeled DNA with an NF-κB binding site. EMSA mixtures were separated by electrophoresis and bound DNAs were visualized by autoradiography. Similar results were obtained in 2 independent experiments.
4.0 Discussion
As indicated in the Introduction, there are published data showing that proteasome inhibitors can both protect nerve cells from oxidative stress-induced cell death or induce death on their own. One of the features that distinguishes the anti-death versus pro-death papers is the concentrations of proteasome inhibitors used in the studies [23, 25–28]. This is a critical feature because not only are high doses of the proteasome inhibitors toxic but they appear to be toxic through a mechanism involving severe oxidative stress [26]. Furthermore, the dose-dependent toxicity of the proteasome inhibitors varies among the different inhibitors with high doses of MG132 showing more severe effects than high doses of lactacystin [18, 27]. These results are entirely consistent with the data presented here demonstrating that MG132 has much more dramatic effects on intracellular GSH levels than lactacystin. A second feature that distinguishes the anti-death from the pro-death papers is the mechanism used to induce oxidative stress. As shown in this manuscript, proteasome inhibitors protect from endogenously generated ROS but not from exogenous ROS [25].
Several pieces of evidence suggest that the protection by proteasome inhibitors is mediated by their effects on mitochondrial function. First, low concentrations of the inhibitors block glutamate-induced increases in ROS which arise from the mitochondria. Second, proteasome inhibitors do not protect from exogenous ROS such as H2O2 which are added directly to cells but they do protect from both rotenone which inhibits mitochondrial complex I thereby inducing mitochondrial ROS production [29] and glutamate which also stimulates mitochondrial ROS production [8]. Consistent with these results is a study on proteasome inhibitors and glucocorticoid-induced apoptosis in thymocytes [30]. However, while the low doses of proteasome inhibitors are able to block toxic increases in mitochondrial ROS production, they themselves induce a low level of mitochondrial ROS production which appears to be responsible for the induction of a protective response, including the activation of the transcription factor NF-κB. This conclusion is supported by the inhibition of lactacystin-induced NF-κB activation by DPI and FCCP. DPI inhibits superoxide production by complex I [22] and FCCP reduces ROS production by uncoupling the mitochondria [31]. Although DPI can also inhibit other oxidases such as NADPH oxidase, inhibition of ROS production by both DPI and FCCP is specific to mitochondrial ROS production [32]. Higher doses of the proteasome inhibitors are toxic because they can induce severe oxidative stress which apparently overwhelms this protective response [26].
Although we found that low doses of proteasome inhibitors can increase intracellular GSH levels, several pieces of data suggest that this action is not involved in their neuroprotective activity. First, the doses of proteasome inhibitors that increase GSH levels only induce modest levels of neuroprotection. For example, while 50 nM epoxomicin increases GSH levels ~50% above control, this dose only protects ~35% of the cells. A similar increase in GSH levels stimulated by low doses of proteasome inhibitors was previously observed in PC12 cells [33]. Second, the neuroprotective doses of the proteasome inhibitors do not prevent the loss of GSH induced by glutamate treatment. Third, although all of the proteasome inhibitors tested exhibited neuroprotective activity at an appropriate dose, not all of the inhibitors increased GSH levels, even at much lower doses.
The transcription factor NF-κB is widely expressed in nerve cells and exists in both inducible and constitutively active forms [for review see 34]. NF-κB normally resides in the cytoplasm of cells in an inactive form comprised of three subunits: p65 and p50 and the inhibitory subunit IκB. Although other forms of NF-κB exist, the p50/p65 dimer is the predominant form activated in nerve cells, as well as a variety of other cell types [34, 35]. Signals that activate NF-κB cause the dissociation of IκB from p50/p65 thereby allowing its translocation to the nucleus where it binds to specific κB DNA consensus sequences in the enhancer region of a variety of NF-κB responsive genes, including MnSOD. Although several pathways for activation of NF-κB have been described, the pathway mediated by classical activators such as TNF-α is the best studied and most well understood [35]. Treatment of cells with TNF-α results in the rapid phosphorylation of IκB on serines 32 and 36 by the IκB kinases (IKKs), IKKα and IKKβ. Phosphorylation of IκB on these serine residues targets it for ubiquitination and degradation by the proteasome. Indeed, treatment with proteasome inhibitors can block NF-κB activation by TNF-α [36]. However, the time course for IκBα phosphorylation and degradation by TNF-α is very different from that for IκBα phosphorylation and NF-κB activation by proteasome inhibitors. TNF-α induces phosphorylation of IκB within 5 min and degradation within 20–30 min whereas cells must be treated with proteasome inhibitors for 4 hr to induce significant IκB phosphorylation and NF-κB activation. Thus, the activation of NF-κB by proteasome inhibitors may not have been detected previously because cells were not treated for a long enough time period.
It was initially assumed that NF-κB activation by the proteasome inhibitors must be through a novel pathway that does not rely upon the proteasome-dependent degradation of IκB. Several novel pathways for NF-κB have been described including ER stress-dependent activation by a mechanism that involves release of IκB but not its degradation [20] and phosphorylation of IκB on tyrosine [37]. However, neither of these pathways appeared to play a role in the activation of NF-κB by proteasome inhibitors.
Since IκB is not degraded in the presence of proteasome inhibitors, how does NF-κB get to the nucleus? Early studies on NF-κB activation suggested that phosphorylation of IκB was not sufficient to induce the activation of NF-κB because IκB appeared to remain associated with NF-κB following treatment with compounds which rapidly activate NF-κB [36, 38]. Although most of the NF-κB in proteasome inhibitor-treated cells remains associated with IκB (data not shown), a portion of the NF-κB clearly translocates to the nucleus and is able to bind DNA and activate transcription. This result is in agreement with several studies which showed that (1) NF-κB-IκBα complexes undergo constitutive nuclear translocation [39, 40] but a nuclear export signal in IκBα prevents the accumulation of a high level of these complexes in the nucleus [41] and (2) at any given time, 17% of cellular NF-κB is free of IκB [42]. This latter study also provided evidence that alterations in the dynamics of the NF-κB-IκB interaction could have a profound effect on free nuclear NF-κB levels. Thus, while phosphorylation of IκB may not induce the dissociation of NF-κB [36, 38], it could change the dynamics of its interaction with NF-κB and thereby lead to the substantial increases in nuclear NF-κB levels observed following treatment with proteasome inhibitors. Since the effect on nuclear NF-κB levels is associated primarily with a change in the kon rate [42] and the role of IκB is thought to be the facilitation of NF-κB export from the nucleus [41], the data presented here are consistent with phosphorylation of IκB reducing the reassociation of IκB with NF-κB in the nucleus. This in turn would lead to the accumulation of NF-κB in the nucleus in the absence of an accumulation of IκBα which is exactly what is shown here.
Proteasome inhibitors appear to induce the phosphorylation of IκBα by an oxidative stress-dependent activation of IKKs. The activation of IKKs is required for proteasome inhibitor-induced NF-κB activation since inhibition by either Bay 11-7082 or specific antioxidants blocks NF-κB activation by the proteasome inhibitors. Although mild oxidative stress has been previously shown to activate IKKs, the mechanism underlying this activation is not yet clear [43, 44].
The majority of the data on NF-κB suggest that it is important for both normal nerve cell survival and the survival of nerve cells exposed to oxidative stress [for review see 34]. Proteasome inhibitors have shown some success in animal models of stroke for the prevention of nerve cell loss [5]. The results presented here suggest that for therapeutic use, the careful titration of doses will be essential because doses that are too high may exacerbate rather than prevent nerve cell loss. Furthermore, the assumption has been that the neuroprotection seen with proteasome inhibitors results from a reduction in inflammation due to the inhibition of NF-κB activation. However, given the data shown here, this assumption should be re-evaluated. Indeed, consistent with the documented role of NF-κB in neuroprotection, it is likely that at least part of the protection arises from the activation of NF-κB by the proteasome inhibitors. This will be an important point to evaluate in future studies on the therapeutic use of proteasome inhibitors because it suggests that other inhibitors of NF-κB activation which directly target IKK activation or nuclear translocation of NF-κB may not prove to be as useful as neuroprotective agents.
In summary, in contrast to previous assumptions, the results presented here demonstrate that proteasome inhibitors can be effective activators of NF-κB and appear to do so through their ability to induce mild oxidative stress which leads to the activation of IKKs. The activation of NF-κB, in turn, plays a critical role in the neuroprotective effects of low doses of proteasome inhibitors.
Acknowledgments
This work was supported by NIH (NS28121). I would like to thank Yutaka Sagara for the HT22 cells expressing the NF-κB super-repressor, Randall Kaufman, University of Michigan for the eIF2α wild type and mutant fibroblasts and David Schubert for reading the manuscript.
Footnotes
Publisher's Disclaimer: This is a PDF file of an unedited manuscript that has been accepted for publication. As a service to our customers we are providing this early version of the manuscript. The manuscript will undergo copyediting, typesetting, and review of the resulting proof before it is published in its final citable form. Please note that during the production process errors may be discovered which could affect the content, and all legal disclaimers that apply to the journal pertain.
References
- 1.Ciechanover A. Proteolysis: from the lysosome to ubiquitin and the proteasome. Nature Rev Mol Cell Biol. 2005;6:79–86. doi: 10.1038/nrm1552. [DOI] [PubMed] [Google Scholar]
- 2.Kisselev AF, Goldberg AL. Proteasome inhibitors: from research tools to drug candidates. Chem Biol. 2001;8:739–58. doi: 10.1016/s1074-5521(01)00056-4. [DOI] [PubMed] [Google Scholar]
- 3.Olanow CW, McNaught KSP. Ubiquitin-proteasome system and Parkinson’s disease. Movement Dis. 2006;21:1806–23. doi: 10.1002/mds.21013. [DOI] [PubMed] [Google Scholar]
- 4.Favit A, Grimaldi M, Alkon DL. Prevention of β-amyloid neurotoxicity by blockade of the ubiquitin-proteasome proteolytic pathway. J Neurochem. 2000;75:1258–63. doi: 10.1046/j.1471-4159.2000.0751258.x. [DOI] [PubMed] [Google Scholar]
- 5.Di Napoli M, McLaughlin B. The proteasome ubiquitin system as a drug target in cerebrovascular disease: The therapeutic potential of proteasome inhibitors. Curr Opin Invest Drugs. 2005;6:686–99. [PMC free article] [PubMed] [Google Scholar]
- 6.Barnham KJ, Masters CL, Bush AI. Neurodegenerative diseases and oxidative stress. Nat Rev Drug Discov. 2004;3:205–14. doi: 10.1038/nrd1330. [DOI] [PubMed] [Google Scholar]
- 7.Tan S, Schubert D, Maher P. Oxytosis: a novel form of programmed cell death. Curr Top Med Chem. 2001;1:497–506. doi: 10.2174/1568026013394741. [DOI] [PubMed] [Google Scholar]
- 8.Tan S, Sagara Y, Liu Y, Maher P, Schubert D. The regulation of reactive oxygen species production during programmed cell death. J Cell Biol. 1998;141:1423–32. doi: 10.1083/jcb.141.6.1423. [DOI] [PMC free article] [PubMed] [Google Scholar]
- 9.Davis JB, Maher P. Protein kinase C activation inhibits glutamate-induced cytotoxicity in a neuronal cell lines. Brain Res. 1994;652:169–73. doi: 10.1016/0006-8993(94)90334-4. [DOI] [PubMed] [Google Scholar]
- 10.Lezoualc’h F, Sagara Y, Holsboer F, Behl C. High constitutive NF-B activity mediates resistance to oxidative stress in neuronal cells. J Neurosci. 1998;18:3224–32. doi: 10.1523/JNEUROSCI.18-09-03224.1998. [DOI] [PMC free article] [PubMed] [Google Scholar]
- 11.Scheuner D, Song B, McEwan E, Liu C, Laybutt R, Gillespie P, et al. Translational control is required for the unfolded protein response and in vivo glucose homeostasis. Mol Cell. 2001;7:1165–76. doi: 10.1016/s1097-2765(01)00265-9. [DOI] [PubMed] [Google Scholar]
- 12.Maher P. How protein kinase C activation protects nerve cells from oxidative stress-induced cell death. J Neurosci. 2001;21:2929–38. doi: 10.1523/JNEUROSCI.21-09-02929.2001. [DOI] [PMC free article] [PubMed] [Google Scholar]
- 13.Hansen MB, Nielsen SE, Berg K. Re-examination and further development of a precise and rapid dye method for measuring cell growth/cell kill. J Immunol Methods. 1989;119:203–10. doi: 10.1016/0022-1759(89)90397-9. [DOI] [PubMed] [Google Scholar]
- 14.Tietze F. Enzymic method for quantitative determination of nanogram amounts of total and oxidized glutathione:applications to mammalian blood and other tissues. Anal Biochem. 1969;106:207–12. doi: 10.1016/0003-2697(69)90064-5. [DOI] [PubMed] [Google Scholar]
- 15.Ishige K, Schubert D, Sagara Y. Flavonoids protect neuronal cells from oxidative stress by three distinct mechanisms. Free Radic Biol Med. 2001;30:433–46. doi: 10.1016/s0891-5849(00)00498-6. [DOI] [PubMed] [Google Scholar]
- 16.Schreiber E, Matthias P, Muller MM, Schaffner W. Rapid detection of octamer binding proteins with ‘mini-extracts’, prepared from a small number of cells. Nuc Acids Res. 1989;17:6419. doi: 10.1093/nar/17.15.6419. [DOI] [PMC free article] [PubMed] [Google Scholar]
- 17.Livolsi A, Busuttil V, Imbert V, Abraham RT, Peyron J-F. Tyrosine phosphorylation-dependent activation of NF-kB. Eur J Biochem. 2001;268:1508–15. doi: 10.1046/j.1432-1327.2001.02028.x. [DOI] [PubMed] [Google Scholar]
- 18.van Leyen K, Siddiq A, Ratan RR, Lo EH. Proteasome inhibition protects HT22 neuronal cells from oxidative glutamate toxicity. J Neurochem. 2005;92:824–30. doi: 10.1111/j.1471-4159.2004.02915.x. [DOI] [PMC free article] [PubMed] [Google Scholar]
- 19.Pahl HL. Activators and target genes of Rel/NF-kB transcription factors. Oncogene. 1999;18:6853–66. doi: 10.1038/sj.onc.1203239. [DOI] [PubMed] [Google Scholar]
- 20.Jiang H-Y, Wek SA, McGrath BC, Scheuner D, Kaufman RJ, Cavener DR, et al. Phosphorylation of the α subunit of eukaryotic initiation factor 2 is required for activation of NF-kB in response to diverse cellular stresses. Mol Cell Biol. 2003;23:5651–63. doi: 10.1128/MCB.23.16.5651-5663.2003. [DOI] [PMC free article] [PubMed] [Google Scholar]
- 21.Pierce JW, Schoenleber R, Jesmok G, Best J, Moore SA, Collins T, et al. Novel inhibitors of cytokine-induced IκBα phosphorylation and endothelial cell adhesion molecule expression show anti-inflammatory effects in vivo. J Biol Chem. 1997;272:21096–103. doi: 10.1074/jbc.272.34.21096. [DOI] [PubMed] [Google Scholar]
- 22.Liu Y, Fiskum G, Schubert D. Generation of reactive oxygen species by the mitochondrial electron transport chain. J Neurochem. 2002;80:780–7. doi: 10.1046/j.0022-3042.2002.00744.x. [DOI] [PubMed] [Google Scholar]
- 23.Kim J-M, Bae HR, Park BS, Lee JM, Ahn HB, Rho JH, et al. Early mitochondrial hyperpolarization and intracellular alkalinization in lactacystin-induced apoptosis of retinal pigment epithelial cells. J Pharm Exp Ther. 2003;305:474–81. doi: 10.1124/jpet.102.047811. [DOI] [PubMed] [Google Scholar]
- 24.Sullivan PG, Dragicevic NB, Deng J-H, Bai Y, Dimayuga E, Ding Q, et al. Proteasome inhibition alters neural mitochondrial homeostasis and mitochondria turnover. J Biol Chem. 2004;279:20699–707. doi: 10.1074/jbc.M313579200. [DOI] [PubMed] [Google Scholar]
- 25.Ding Q, Keller JN. Proteasome inhibition in oxidative stress neurotoxicity: implications for heat shock proteins. J Neurochem. 2001;77:1010–7. doi: 10.1046/j.1471-4159.2001.00302.x. [DOI] [PubMed] [Google Scholar]
- 26.Lee M, Hyun D-H, Jenner P, Halliwell B. Effect of proteasome inhibition on cellular oxidative damage, antioxidant defences and nitric oxide production. J Neurochem. 2001;78:32–41. doi: 10.1046/j.1471-4159.2001.00416.x. [DOI] [PubMed] [Google Scholar]
- 27.Stanciu M, DeFranco DB. Prolonged nuclear retention of activated extracellular signal-regulated protein kinase promotes cell death generated by oxidative toxicity or proteasome inhibition. J Biol Chem. 2002;277:4010–7. doi: 10.1074/jbc.M104479200. [DOI] [PubMed] [Google Scholar]
- 28.Kikuchi S, Shinpo K, Tsuji S, Takeuchi M, Yamagishi S, Makita Z, et al. Effect of proteasome inhibitor on cultured mesencephalic dopaminergic neurons. Brain Res. 2003;964:228–36. doi: 10.1016/s0006-8993(02)04030-1. [DOI] [PubMed] [Google Scholar]
- 29.Sherer TB, Betarbet R, Testa CM, Seo BB, Richardson JR, Kim JH, et al. Mechanism of toxicity in rotenone models of Parkinson’s disease. J Neurosci. 2003;23:10756–64. doi: 10.1523/JNEUROSCI.23-34-10756.2003. [DOI] [PMC free article] [PubMed] [Google Scholar]
- 30.Tonomura N, McLaughlin K, Grimm L, Goldsby RA, Osborne BA. Glucocorticoid-induced apoptosis of thymocytes: requirement of proteasome-dependent mitochondrial activity. J Immunol. 2003;170:2469–78. doi: 10.4049/jimmunol.170.5.2469. [DOI] [PubMed] [Google Scholar]
- 31.Voet D, Voet JG. Biochemistry. New York: John Wiley and Sons; 1990. [DOI] [PubMed] [Google Scholar]
- 32.Abramov AY, Jacobson J, Wientjes F, Hothersall J, Canevari L, Duchen MR. Expression and modulation of an NADPH oxdiase in mammalian astrocytes. J Neurosci. 2005;25:9176–84. doi: 10.1523/JNEUROSCI.1632-05.2005. [DOI] [PMC free article] [PubMed] [Google Scholar]
- 33.Yamamoto N, Sawada H, Izumi Y, Kume T, Katsuki H, Shimohama S, et al. Proteasome inhibition induces glutathione synthesis and protects cells from oxidative stress. J Biol Chem. 2007;282:4364–72. doi: 10.1074/jbc.M603712200. [DOI] [PubMed] [Google Scholar]
- 34.Kaltschmidt B, Widera D, Kaltschmidt C. Signaling via NF-kB in the nervous system. Biochim Biophys Acta. 2005;1745:287–99. doi: 10.1016/j.bbamcr.2005.05.009. [DOI] [PubMed] [Google Scholar]
- 35.Moynaugh PN. The NF-κB pathway. J Cell Sci. 2005;118:4589–92. doi: 10.1242/jcs.02579. [DOI] [PubMed] [Google Scholar]
- 36.DiDonato JA, Mercurio F, Karin M. Phosphorylation of IκBα precedes but is not sufficient for its dissociation from NF-κB. Mol Cell Biol. 1995;15:1302–11. doi: 10.1128/mcb.15.3.1302. [DOI] [PMC free article] [PubMed] [Google Scholar]
- 37.Imbert V, Rupec RA, Livolsi A, Pahl HL, Traenckner EBM, Mueller-Kieckmann C, et al. Tyrosine phosphorylation of IκB-α activates NF-κB without proteolytic degradation of IκB-α. Cell. 1996;86:787–98. doi: 10.1016/s0092-8674(00)80153-1. [DOI] [PubMed] [Google Scholar]
- 38.Lin Y-C, Brown K, Siebenlist U. Activation of NF-κB requires proteolysis of the inhibitor IκB-α: Signal-induced phosphorylation of IκB-α alone does not release active NF-κB. Proc Natl Acad Sci USA. 1995;92:552–6. doi: 10.1073/pnas.92.2.552. [DOI] [PMC free article] [PubMed] [Google Scholar]
- 39.Malek S, Chen Y, Huxford T, Ghosh G. IκBβ, but not IκBα, functions as a classical inhibitor of NF-κB dimers by masking both NF-κB nuclear localization sequences in resting cells. J Biol Chem. 2001;276:45225–35. doi: 10.1074/jbc.M105865200. [DOI] [PubMed] [Google Scholar]
- 40.Birbach A, Gold P, Binder BR, Hofer E, de Martin R, Schmid JA. Signaling molecules of the NF-κB pathway shuttle constitutively between cytoplasm and nucleus. J Biol Chem. 2002;277:10842–51. doi: 10.1074/jbc.M112475200. [DOI] [PubMed] [Google Scholar]
- 41.Huang TT, Kudo N, Yoshida M, Miyamoto S. A nuclear export signal in the N-terminal regulatory domain of IκBα controls cytoplasmic localization of inactive NF-κB/IκBα complexes. Proc Natl Acad Sci USA. 2000;97:1014–9. doi: 10.1073/pnas.97.3.1014. [DOI] [PMC free article] [PubMed] [Google Scholar]
- 42.Carlotti F, Dower SK, Qwarnstrom EE. Dynamic shuttling of nuclear factor κB between the nucleus and cytoplasm as a consequence of inhibitor dissociation. J Biol Chem. 2000;275:41028–34. doi: 10.1074/jbc.M006179200. [DOI] [PubMed] [Google Scholar]
- 43.Yamamoto Y, Gaynor RB. IκB kinases: key regulators of the NF-κB pathway. Trends Biochem Sci. 2004;29:72–9. doi: 10.1016/j.tibs.2003.12.003. [DOI] [PubMed] [Google Scholar]
- 44.Bubici C, Papa S, Dean K, Franzoso G. Mutual croos-talk between reactive oxygen species and nuclear factor-kappa B: molecular basis and biological significance. Oncogene. 2006;25:6731–48. doi: 10.1038/sj.onc.1209936. [DOI] [PubMed] [Google Scholar]