

Abstract
Though the bacterial transcription regulation apparatus is distinct in terms of several structural and functional features from its eukaryotic counterpart, the gross structure of the transcription regulatory network (TRN) is believed to be similar in both superkingdoms. Here, we explore the fine structure of the bacterial TRN and the underlying “co-regulatory network (CRN)” to show that despite the superficial similarities to eukaryotic networks, the bacterial networks display entirely different organizational principles. In particular unlike in eukaryotes, the hubs of bacterial networks are both global regulators and integrators of diverse disparate transcriptional responses. These and other organizational differences might correlate with the fundamental differences in gene and promoter organization in the two superkingdoms, especially the presence of operons and regulons in bacteria. Further we explored to find the interplay, if any, between network structures, mode of regulatory interactions and signal sensing of TFs in shaping up the bacterial transcriptional regulatory responses. For this purpose, we first classified TFs according to their regulatory mode (activator, repressor or dual regulator) and sensory mechanism (one-component systems responding to internal or external signals, TFs from 2-component systems and chromosomal structure modifying TFs) in the bacterial model organism E. coli and then we studied the overall evolutionary optimization of network structures. The incorporation of TFs in different hierarchical elements of the TRN appears to involve on a multi-dimensional selection process depending on regulatory and sensory modes of TFs in motifs, co-regulatory associations between TFs of different functional classes and transcript half-lives. As result it appears to have generated circuits that allow intricately regulated physiological state changes. We identified the biological significance of most of these optimizations, which can be further used as the basis to explore similar controls in other bacteria. We also show that, though on the larger evolutionary scale, unrelated TFs have evolved to become hubs, within lineages like γ-proteobacteria there is strong tendency to retain hubs, as well as certain higher-order network modules that have emerged through lineage specific paralog duplications.
1.0 Introduction
Organisms maintain homeostasis by constantly sensing both environmental changes and intracellular fluxes. Some of the most fundamental responses to the sensed changes occur via alterations of gene expression. Key steps in such responses are: (i) the process of sensing environmental or internal changes and (ii) deployment of relevant specific transcription factors (TFs) to bring about the necessary change in gene expression. Some specific TFs use sensory domains fused to the DNA-binding domains to directly detect the said changes (e.g. AraC, which combines a double-stranded β-helix type sugar-binding domain with a winged HTH DNA-binding domain). Such systems are called one-component systems as they involve a single component, which is the transcription factor 1; 2. Alternatively, the communication of the sensed changes might occur via a signaling cascade that finally activates a specific TF. In prokaryotes the dominant signaling cascades involve histidine kinases that catalyze phosphotransfer via histdines to an aspartate in the receiver domain of a downstream protein. Several prokaryotic TFs combining receiver domains with DNA-binding domains are downstream of such signaling cascades. They are known as 2-component systems as they involve at least 2-components, namely the sensory histidine kinase and the downstream TF 1; 3; 4; 5; 6; 7; 8; 9; 10.
A compendium of E. coli TFs based on their mode of signal-sensing has been recently created 11. This collection contains five categories of TFs: (i) TFs which respond to changes in internal conditions (i.e. endogenous ligand-, redox, or pH sensing TFs), (ii) TFs which respond to changes in the external metabolites transported into the cell via a transporter, (iii) the hybrid class (i.e. those that can sense both external metabolites and their internal derivatives). The above 3 classes are typically one-component systems, (iv) Chromosomal proteins that are associated with DNA-curvature status and (v) TFs in 2-component signal transduction systems sensing external stimuli. TFs can activate or repress expression of genes and are accordingly categorized as activators or repressors. Some TFs might function both as activators or repressors, depending on different factors such as the presence or absence of signal, the target sites and interaction with other regulatory proteins. Such TFs might be termed dual regulators.
Numerous experimental studies over the years on E. coli have accumulated data on interactions of regulatory proteins, the mechanism and mode of transcriptional control by specific TFs (activation or repression) and their target genes 10; 12; 13. Taken together, this has resulted in accumulation of genome-scale information regarding transcription regulatory processes in the prokaryotic model organism E. coli K12. This information is usually represented as a directed graph, commonly referred to as the transcriptional regulatory network (TRN) 14; 15. In such networks, nodes represent TFs and their target genes (TGs) and directed edges represent transcriptional regulation of a TG by a TF. In recent years, the TRN has been exploited to decipher various general principles of system level processes in prokaryotes such as: (i) presence of scale-free structure, revealing the existence of global regulators (hubs) 16; 17; 18, (ii) presence of distinct functional units or motifs that recursively make up the TRN 19, (iii) an evolutionary model for the interplay between lineage-specific duplications, expansion and loss of TFs in generating the observed network structure of an organism 20; 21; 22, (iv) dynamical condition-specific changes in the deployed network 23; 24; 25; 26; 27 (v) insights into combinatorial regulation of genes by multiple TFs in TRN 28; 29.
The genome-scale principles of the associations between transcription factors, their response to external or internal changes and the mode of alteration of gene expression (activation or repression of gene), however, remain largely unexplored, with an exception of few earlier studies which focused on certain aspects of these principles 11; 30; 31. The availability of detailed information on the sensory and regulatory mode of a notable fraction of TFs in E. coli 11; 32 allowed us to investigate the above issues. To this end we carried out a systematic study of the transcriptional regulatory network of E. coli, exploring the potential interplay between network structures and associations between TFs, mode of regulation and signal-sensing. We present here results of this analysis and provide evidence for some fundamental differences between bacterial and eukaryotic regulatory networks and the manner in which the former have been optimized for diverse functional capabilities.
2.0 Results and discussion
2.1 Transcriptional regulatory network and the co-regulatory network in E. coli
2.1.1 Structure of the transcriptional and co-regulatory network in E. coli
The availability of transcriptional regulatory information on E. coli from several focused experiments over the many years has been systematically documented in the RegulonDB 12. This regulatory network is represented as a graph (Fig 1A,B) and consists of 146 specific transcription factors and 1175 target genes (the nodes) involving a total of 2,489 regulatory interactions (the edges of the graph). Of the 146 TFs, 58 are activators, 47 are repressors and 41 are dual regulators (see materials and methods).
Fig 1.

Network structure of E. coli TRN and CRN. (A, D) Schematic representation illustrating the network transformation procedure involved in constructing the CRN (D) from the TRN (A). The two types of nodes, TFs and TGs, of the TRN are denoted by red and green circles respectively and edges between them by lines. In the CRN network, an edge is made between TFs in the CRN if they regulate at least one common target gene. (B, E) A network representation of the E. coli TRN, involving 146 TFs, 1175 TGs and 2489 regulatory interactions between them. Similarly, the network representation of the E. coli CRN is shown in Fig 1E, consisting of 124 TFs and 409 edges between them. The few TFs shown at the center of these two networks make high regulatory or co-regulatory associations in the E. coli TRN and CRN, suggestive of a scale-free topology. These figures were generated using Pajek (http://vlado.fmf.uni-lj.si/pub/networks/pajek/). (C, F) Degree distributions (out-degree) of TFs in the E. coli TRN and CRN (respectively C and F), whose trends are best approximated by power-law decays (y = 1301.2*×−1.5952 for the TRN and y = 542.23*×−1.6546 for the CRN on a log-log plot; p-values < 10−3). This suggests the existence of scale-free topology in the networks and is consistent with earlier studies on the E. coli TRN. (G) Plot of the number of target genes regulated (x-axis) versus the number of co-regulatory associations made (y-axis) by a TF. For the majority of TFs (117 of 146 TFs), represented by blue points, the rate of linear increase of co-regulatory associations is lower, as indicated by the slope value of 0.29 in the best-fitted linear trend (R2 = 0.9221; p-value < 10−3). This suggests that these TFs are largely autonomous in their behavior. However, the remaining TFs (29 of 146 TFs), represented by red points, have a lower number of regulatory interactions and posses a significantly higher rate of linear increase of co-regulatory associations, indicated by the slope value of 0.97 in the best-fitted linear trend (R2 = 0.8404; p-value < 10−3). This suggests that these TFs perform prominent integrative roles.
Analysis of the structure and organization of this network revealed several notable features: (i) on average, each transcription factor regulates 17 target genes and (ii) the distribution of out-going connectivity of the TFs (out-degree) can be best approximated by a power-law equation (Fig 1C). There were 29 regulatory hubs in the E.coli TRN, which we defined as the top 20% of the TFs (with more than 15 target genes; e.g. Crp, which regulates 359 target genes). Similarly, the analysis of the number of transcription factors regulating a target gene (in-coming connectivity) revealed that (i) on an average, each target gene is regulated by 2 transcription factors and (ii) the distribution of in-coming connectivity (in-degree) can be best approximated by an exponential fit as was previously reported on smaller networks 17; 18. The highest in-degree (9 TFs) was noted for the genes of flhdc operon consisting of genes - flhd and flhc. This suggests that in E. coli, flagellar biosynthesis responds to numerous distinct inputs, or requires coordination between multiple TFs for appropriate expression. The observed distribution of in-degrees for target genes, in part, possibly reflect the limits on the number of TFs binding to a promoter region due to steric-hindrance between bound TFs 33 or the restrictions imposed by length of the inter-operonic spacers available for embedding TF-binding sites. Thus, transcription regulation of a given gene could involve serial or simultaneous control of gene expression by multiple TFs. Herein, this situation of multiple TFs sharing common TGs is referred to as a “co-regulatory association” between TFs.
To study the nature of these co-regulatory associations we used a network transformation procedure 28; 29 to construct, from the E. coli TRN, the co-regulation network (CRN), which is a representation of the total set of co-regulatory associations between TFs. In this network all nodes are TFs and the edges are co-regulatory associations (the regulation of a shared target gene) between TFs. In simple terms, the procedure, which is schematically represented in Figure 1A,D works as follows: using the information in the transcriptional regulatory network, we add an edge between a pair of TFs, denoting a co-regulatory association, if they regulate the same target gene. As a result we obtained 409 pair-wise associations between 124 transcription factors (Fig 1B,E). In order to confirm the validity of the network transformation, we subjected CRN to a normalization procedure (see Supplementary information). And we found 90% of the co-regulatory associations and all the hubs, except one, have been retained.
2.1.2 Degree distributions in TRN and its co-regulatory network (CRN) display strikingly similar power-law distribution
Degree distributions of TFs in the TRN (out-degree) and CRN could be best modeled as a power-law decay (Fig 1C and 1F, R2-values 0.95 in both cases) which suggests that there are few regulators (hubs/global regulators) in both networks that have large number of regulatory and co-regulatory associations respectively. Moreover, almost all the hubs in CRN (top 20% of TFs in terms of degree) are global regulators in the TRN (20 out of 23). The three hubs of the CRN, which are not global regulators in the TRN, are Hu, Rob and RcsB. They have fewer individual regulatory interactions, than the hubs of the TRN, but perform distinctive functional roles that result in a high number of connections with respect to CRN. In the case of Rob and Hu this is primarily because of them being sequence-specific and non-specific structural chromosomal proteins respectively. They are apparently required for the effective functioning of several promoters bound by diverse TFs 10. RcsB is a TF downstream of a phosphorelay system that delivers several inputs to diverse promoters regulated by other TFs to initiate swarming behavior 34. One notable example of role of RcsB is the set of co-regulatory associations of it with several TFs is the flhdc operon (see above). In contrast, we also find that some hubs in the TRN like LexA, PhoB and CysB have very few or no co-regulatory associations. These TFs are examples of “autonomous hubs” that are likely to elicit major physiological state changes by regulating a diverse array of genes in response to certain conditions like DNA damage or phosphate/sulfate starvation. Taken together these observations suggested that there are multiple distinct behaviors amongst the master regulators: 1) those which regulate a large number of TGs in conjunction with other TFs (hubs in both networks). 2) Those which predominantly regulate genes in conjunction with other TFs but have few interactions of their own (hubs only in CRN) and 3) those which behave as autonomous hubs (hubs only in TRN). The first of the behavior might automatically emerge from general tendencies of the network. On the other hand the second behavior arises from both the innate features of higher order DNA structure and the need for coordinated gene regulation in certain conditions. The last behavior appears to be an adaptation for physiological states requiring a unique set of responses.
These results are in contrast to our earlier findings on the yeast TRN that indicated very different trends in the degree distributions and the corresponding CRN. The yeast CRN displayed a prominent central tendency in the degree distribution and a characteristic of de-centralized topology, suggesting the existence of a distributed architecture 28; 29. However, the E. coli CRN appears to lack a distributed architecture, instead approximating scale-free behavior. We suspect that this might arise from the fundamental differences in the transcription mechanisms between eukaryotes and bacteria. In the latter the majority of genes are organized as operons, which produce polycistronic transcripts from single transcription start sites. In the case of the eukaryotes the absence of such an organization, with co-expressed genes scattered around the chromosome, might have selected for more prevalent co-regulatory associations between different TFs to bring about co-expression of a group of genes in different sets of conditions. As a result the eukaryotic network might have acquired a distributed architecture in contrast to the bacterial one. Yeast and E. coli have a comparable number of predicted TFs. However, the organization of the bacterial genome into operons, with several genes sharing a common set of regulatory elements, also effectively reduces the set of targets available for TFs in comparison to yeast. As a consequence, there might be a greater effective direct backup of individual TFs (i.e. functionally redundant TFs) per TG in E. coli relative to yeast. This might be another factor that allows for a centralized CRN, as opposed to the CRN of yeast, which acquires robustness indirectly through its distributed architecture.
2.1.3 Comparison of regulatory interactions and co-regulatory associations reveals autonomous and integrative behaviors of TFs
To understand the general behaviors of TFs with respect to their co-regulatory associations we compared the degree distribution in CRN and TRN. Overall there was a general tendency for the number of co-regulatory associations to increase with increase in the number of regulatory interactions (Fig 1G). A further careful analysis showed that this general tendency was the interplay of two distinct linear trends: (i) the majority of TFs (Fig 1G, blue data points) displayed a relatively slow increase in the number of co-regulatory partners but reached the highest values of co-regulatory associations seen in the CRN. These TFs have less number of co-regulatory associations than regulatory interactions. (ii) A minority of TFs (Fig 1G, red data points), whose number of co-regulatory associations are more than or equal to number of regulatory interactions, displayed a much higher increase in the number of co-regulatory associations but only attained a moderate number of co-regulatory associations. The slope of the linear best-fit equations for the two patterns is a direct measure of rate of increase of the co-regulatory associations as a function of regulatory interactions: 0.22 for the former and 0.97 for the latter TFs. These patterns point to the existence of two functionally distinct set of TFs, corresponding to the lower and higher increase in co-regulatory associations respectively. The former TFs have lesser co-regulatory associations than regulatory interactions and might mediate more autonomous aspects of transcriptional regulation. The latter are typified by higher or almost equal number of co-regulatory associations as regulatory interactions and might have a prominent role in integrating the transcriptional responses involving multiple genes controlled by other TFs. Many integrators function as environment-dependent response regulators: e.g. QseB, UhpA, MtlR, NhaR, RhaR, UidR and MarR. From the perspective of the mode of regulation, it was striking to note that repressors display a lower tendency for co-regulatory associations than activators and dual regulators.
2.2 Regulatory mode and network structure
2.2.1 Prevalence of dual regulators in network hubs
We next sought to systematically identify the relationship, if any, between, the mode of regulation of the TFs (activators, repressors or dual regulators) and their prevalence and position in the network (Fig 2A). Number of TFs belonging to each of the three regulatory modes occur in comparable numbers in the TRN (58 activators, 47 repressors and 41 dual regulators; see inset of Fig 2A). Analysis of the degree distribution of TFs showed a striking over-representation of dual regulators (p-value < 10−3) and a significant under-representation of activators and repressors (p-values < 0.005 and < 10−3 respectively) amongst hubs (see inset of Fig 2A; 22 of 29 hubs). Four out of 6 proteins in the TRN which are associated with chromosomal structure are both dual regulators and hubs. In the case of these proteins, their roles naturally results in them regulating a large number of genes (hence hubs) and accentuating the effects of both repressors and activators (hence dual regulators). Due to this precedence it would of interest to determine if some of the other dual regulator hubs also function in a similar manner. A similar picture emerged from the analysis of the degree distribution in the CRN (Fig 2B). We found that a majority of the activators (63%) and repressors (68%) have less than 5 co-regulatory associations (p-value <10−4). Further, neither activators nor repressors possessed more than 20 co-regulatory partners. Again, few co-regulatory associations are seen between repressors and activators with other repressors or activators (Fig 2C). In contrast to these observations, almost 78% of dual regulators possess more than 5 co-regulatory partners (p-value < 10−4), and nearly one-fourth of dual-regulators, hubs in both the TRN and CRN, have 20 or more co-regulatory partners (p-value <= 0.005). There is also extensive co-regulatory association between dual regulators and activators or repressors (Fig 2C).
Fig 2.

The regulatory and co-regulatory associations of activators, repressors and dual regulators. (A, B) Degree distributions (out-degree) of TFs in various categories, classified based on their regulatory modes (i.e. activators, repressors and dual regulators), in the E. coli TRN and CRN. Also shown are pie charts as insets depicting the extent of representation of TFs from these categories in the TRN, CRN and the hubs in both the networks. There is an enrichment of yellow points (dual regulators) in high degree regions in both of the networks and more than three quarters of the pie charts corresponding to the hubs distribution in both the TRN and CRN are constituted by dual regulators. These suggest that the hubs are enriched with dual regulators in both networks. (C) Matrix plot depicting the extent of co-regulatory associations between activators, repressors and dual regulators. The dark and light blue boxes respectively denote low and high extent of co-regulatory associations between TFs as indicated by the numerical values in each box. It is evident that dual regulators display the highest tendency for co-regulatory associations. It is also apparent that activators and repressors show a much higher tendency for co-regulatory associations with dual regulators than between themselves.
In general, the enrichment of dual regulators in TRN hubs strongly suggests that physiological state changes are primarily brought about by large-scale bi-direction changes in gene expression. Further, their prevalence in the CRN implies that these changes are likely to involve cooperative action with other TFs, wherein the activators and repressors might provide further fine-tuning and amplification of the original effects.
2.2.2 All motifs are enriched in dual regulators; repressors preferentially occur in multiple input motifs
Motifs in bacterial TRNs are primarily of three types 19, known as feed-forward motif (FFM), multiple input motif (MIM) and single input motif (SIM). FFMs are known to ensure that the target gene is regulated only when a persistent signal is received 19; 35. MIMs are motifs involving multiple inputs from different TFs to the TGs at any given time 19; 36. SIMs are motifs consisting of only one transcription factor that regulates target genes independently 19. In the TRN of E. coli, we find that there are 754 FFMs and dual regulators are present in 707 (94%) of them (p-values < 10−3). However, this percentage is significantly lower than what is attained in random networks of identical degree distribution (p-value < 10−3) suggesting a potential role for natural selection in optimizing the extent of participation of dual regulators in the FFMs. In terms of the regulatory mode of TFs, dual regulators appear to have significantly greater representation in FFMs (26 out of 41, ~63%, p-value 0.006) than activators (41%) or repressors (34%) (p-value < 10−3). Activators tend to preferentially occur in FFMs or MIMs (Fig 3A, B). There are 141 MIMs (p-values < 10−3) containing a significantly greater than expected number of dual regulators (139 of 141 or 98%; p-values < 10−2). 40 out of 41 dual regulators, except Ada (involved in regulating DNA repair) occur in MIMs (p-value < 10−3). All of the dual regulatory hubs appear in at least one MIM. Repressors tend to occur more frequently in MIMs than other motif types (Fig 3A, B; p-value < 10−3). Further, in general the extents of participation from the three categories of TFs are higher in MIMs than in FFMs (Fig 3). We identified 49 SIMs (p-value < 0.18). Twenty six of the 41 dual regulators are seen in SIMs which is similar to the fraction of dual regulators in FFMs. However, only about 50% of the 26 dual regulators occur in both FFMs and SIMs. Both the activators and repressors have lower representations in SIMs than in other motifs (13 and 10 respectively). The p-values for the occurrence of dual regulators, activators and repressors in various motifs have been provided in the supplementary information.
Fig 3.
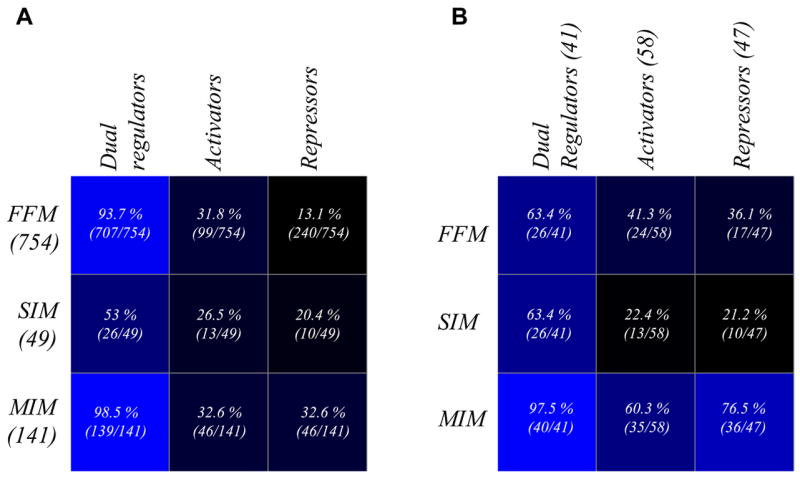
Motifs and the regulatory mode of TFs. Matrix plots showing the extent of prevalence of TFs from different categories of regulatory modes in the three types of motifs. The values in various boxes in the matrix on the left (A) are observed values normalized by the total number of motifs of that type found in the TRN. However, the values in the corresponding boxes in the matrix on the right (B) are the observed values normalized by the total number of TFs in that particular regulatory mode category in the TRN. The dark and light blue boxes respectively denote low and high extent of representations. Dual regulators have the highest extent of occurrence in various motifs from the perspective of both types of normalizations. The matrix plot on the right indicates that activators display a stronger tendency than repressors to occur in FFMs, while repressors provide combinatorial inputs through MIMs more commonly than activators.
Consistent with earlier results regarding hubs described in the previous sections, dual regulators dominate the network even in terms of motifs, being the most prevalent of the three operational categories of TFs. However, the preferential tendencies of repressors to associate with MIMs, activators with FFMs or MIMs, and neither with SIMs suggests that activators and repressors generally do not act on their own but in conjunction with different sets of dual regulators. It appears that activators tend to more often, than repressors, act in the context of prolonged signals seen in FFMs, probably by facilitating the signal persistence. On the other hand, repressors act more commonly by providing direct shut-off signals, thereby potentially making some of the MIMs, in which they frequently participate, regulatory switches. The role of MIMs as regulatory switches might also be further augmented by the presence of practically all dual regulators in them. Further, MIMs, unlike FFMs, tend to integrate disparate independent inputs. Hence, preferential occurrence of repressors in these motifs might also allow reinforcement or modulation of regulatory responses depending on their coupling with the other TFs in the MIM.
2.2.3 Half-lives of TF transcripts and their regulatory roles
The half-life data for 130 TF transcripts could be obtained from a genome-scale study by Bernstein et al37; 38. We used this data to analyze any potential connection between the mode of regulation and half-lives of TFs by determining the average and median half-lives for each category of TFs classified by regulatory mode. We found that transcripts of activators have an average half live of 6.4 minutes (p-value < 10−3), which is longer by 1.7 minutes (p-value < 10−3 to attain the difference of 1.7 or more) than the average transcript half-life of dual regulators (whose average half-life is 4.7 minutes, p-value < 0.02). Furthermore, amongst dual regulators, we found strikingly similar mean half-lives for both hub and non-hub dual regulators. The transcripts of repressors have average half life of 5.6 min which is in between the half-lives of activators and dual regulators. As these differences correspond to about 5–10% of the doubling time of E. coli under usual growth conditions, they are likely to have noticeable effects on the availability of TFs in sufficient abundance in given cell cycle.
This pattern of half-lives appears to be consistent with earlier observations, which suggest that dual regulators are mainly triggers of physiological state changes which appear to be augmented by activators or repressors depending on the motif context. When the TFs in the E. coli TRN were organized into 3 levels of hierarchy (see supplementary information) namely (1) top level which contain TFs with only outgoing edges to TGs and TFs and no incoming edges, (2) middle level with both outgoing edges to TFs and TGs and as well as incoming edges from TFs of top level and (3) internal level with outgoing connectivities only to TGs and incoming connectivties from TFs belonging to top and middle levels, we found comparable number of dual regulators being present in internal and top levels of hierarchy. In contrast activators and repressors have majority of them being in the top level. Hence, the short half-life of dual regulator mRNAs might represent an adaptation for quickly removing triggers of state changes when not required. In particular, this also ties in with earlier observations of Wang and Purisima 39 on the short half-lives of hub transcripts. Hubs of the TRN being predominantly a sub-set of the dual regulators show the same general behavior of the dual regulator category in terms of half-life. Thus, rapid turn over of dual regulators appears to be required irrespective of the magnitude of the state changes they might trigger. The relatively long average half-life of the activator category may reflect an adaptation for them to be continuously produced over longer time intervals as they are required to “lie in wait” for their potential signal (usually a small molecule; see below). Short half-lives of TFs transcripts do not necessarily imply a lower stability of their protein products. However, typically in dividing bacterial cells the dilution of mRNAs by cell division in combination with a short half-life can cause lower protein concentrations. Nevertheless, it should be noted that the above observations only represent a first level approximation in terms of inferring the net TF concentration, and in reality are likely to be affected by several other factors.
2.3 Signal sensing mechanism of TFs and network structure
2.3.1 Distribution of different signal sensing modes in the TRN and CRN
In addition to the TFs classified in the work of Marinez-Antonio et al 11, we also accounted for previously unclassified TFs by using evidence from new literature and diagnostic domain architectures (See Supplementary information and supplementary Table 1). We then investigated the connection between the location of a TF in the CRN and its mode of signal sensing (see Supplementary information for further details). In general, TFs tend to co-regulate with TFs belonging to a different sensing class, suggesting adaptation for regulating a common set of genes through different kinds of signals as observed by Marinez-Antonio et al 11. In this context, it is interesting to note that the loci encoding transcription factors belonging to the external sensing class tend to be in close chromosomal proximity to the loci encoding the corresponding effector genes31.
2.3.2 Network motifs and signal-sensing mechanism
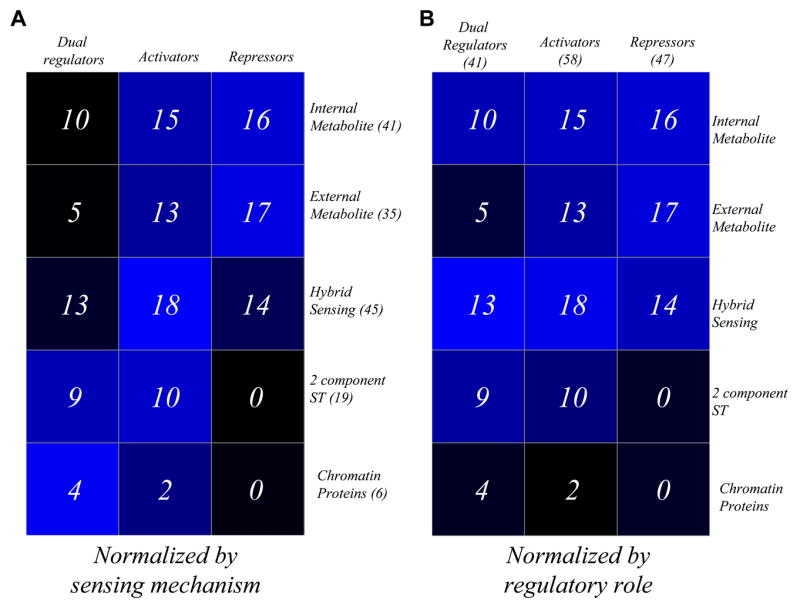
The most prevalent TFs in FFMs are those sensing internal signals followed by 2-component external signal-sensing TFs (Fig 4A) found respectively in 561 and 297 out of 754 FFMS. However, all internal sensing and 2-component TFs belonging to the FFMs come from a relatively small pool representing less than half of the total number of these two categories of TFs (Fig 4B). These results are consistent with the previous observation that individual motifs aggregate into motif clusters due to common set of TFs being present in all of them 40. In contrast, over half of the TFs requiring import of external metabolite via transporters and chromosomal proteins are found in the FFMs, even though a relatively small fraction of the FFMs contain them. We found relatively few instances where both TFs in a FFM belonged to the same sensing-mechanism category (106 out of 744 FFMs). Within FFMs, the internal signal sensing TFs display a higher tendency to play initiatory role in FFMs (456 out of 556 FFMs) followed by 2-component TFs (106 out of 292 FFMs). These observations suggest that the integration of external and internal signals at the transcriptional level occurs via FFMs deploying internal signal sensing and initiatory TFs coupled with 2-component TFs responding to external signals. TFs of the internal signal sensing also tend to be over-represented in MIMs (Fig 4). In contrast to FFMs, MIMs do tend to often combine TFs belonging to the same signal-sensing category (65 out of 141 MIMs, which is close to half of the number of motifs). Hence, they seem to represent the set of TFs of the internal signal sensing and 2-component signal transduction classes used to reinforce signals in parallel or serially rather than integrating disparate signals like FFMs. TFs of the external metabolite sensing class had a much lower participation in SIMs (Fig 4). In terms of normalized numbers, the external 2-component TFs, although lesser in overall number than the external sensing, internal and hybrid class were clearly over represented in SIMs. Thus, on the whole, TFs from external 2-component systems appears to be most versatile, participating prominently in all three motif types, while the internal signal sensors, which are found in majority of motifs, are mainly restricted to integrative or cooperative signaling via MIMs and FFMs. The p-values for the occurrence of TFs belonging to different signal sensing categories in various motifs have been provided in the supplementary information.
Fig 4.

Motifs and the types of signal sensed by TFs. Matrix plots showing the extent of prevalence of TFs from different types of signal-sensing modes in various types of motifs. The values in various boxes in the matrix on the left (A) are observed values normalized by the total number of motifs of that particular type found in the TRN. The corresponding boxes in the matrix on the right (B), however, contain observed values that are normalized by the total number of TFs in that particular type of signal sensing group in the TRN. The dark and light blue boxes respectively denote low and high extent of representation. Among the major groups of signal sensing TFs, external 2-component TFs display a higher tendency to occur in all three types of motifs, while internal signal sensing TFs and TFs sensing externally transported metabolites are preferentially found in FFMs and MIMs, respectively.
2.3.3 Half-lives of TF transcripts and their signal-sensing mechanism
We next investigated the relationship between of mRNA half-life of TFs and their signal-sensing mode just as we did above for the TFs classified by regulatory mode. We found that TFs sensing external metabolite class had an average half-life of 6.8 min (p-value < 10−3) which is significantly longer than the average half-life of any other sensing class (i.e. transcripts of TFs belonging to internal-sensing, hybrid sensing and 2-component systems are 5.1, 5.5 and 5.7 minutes respectively, p-values > 0.1). This observation is consistent with the finding that TFs sensing external signals tend to occur predominantly in FFMs (see Fig 4) which require the persistence of signal for a longer time in the form of regulatory activity of TFs being present. On the other end of the spectrum, we note that the Chromosomal proteins tend to have very short half-life of only 3.3 min (p-value < 10−3). Again, this is consistent with the earlier observation that Chromosomal proteins have higher tendency to be dual regulatory hubs, and such proteins in general have shorter transcript half-lives.
2.4 Two-component TFs are never pure repressors and TFs requiring import of external- metabolites are rarely dual regulators
Fig 5 shows several interesting trends in terms of the relationship between the regulatory mode and sensing mechanism of TFs: (i) It is apparent that none of the 2-component systems are pure repressors and are evenly distributed amongst activators or dual regulators. (ii) In contrast, TFs depending on import of external metabolites by transporters are rarely dual regulators and are evenly distributed amongst pure repressors and activators. Thus, the two distinct modes of external signal sensing, namely via 2-component systems or via transport of metabolites are distinguished by their mode of action: the former lacks pure repressors and latter is poor in dual regulators. Further, earlier observations suggested that 2-component TFs are enriched in hubs when compared to TFs depending on import of external metabolites by transporters. Hence, it former appears to have been optimized for signaling larger scale changes. The latter category, in contrast and consistent with the earlier observation, usually regulate a small group of genes specifically required for processing a given metabolite, and appear to do so by merely turning them “on” or “off”.
Fig 5.
Regulatory mode and type of signals sensed by TFs. Matrix plots depicting the relationship between the regulatory modes and types of signals sensed by TFs. The observed values in the boxes of the left matrix plot (A) are normalized by the total number of TFs in that particular type of signal sensing group. However, the corresponding boxes in the matrix on the right (B) contain values that are normalized by the number of TFs in that particular regulatory mode. It could be easily deduced that 2-component TFs are never repressors, while the TFs sensing externally transported metabolites are poor dual regulators.
2.5 Evolutionary conservation of transcription factors, regulatory mode and sensing mechanism
2.5.1 Preferential retention of dual regulators and hubs at small phylogenetic distances
68%, 41% and 34% of dual regulators (p-value < 0.002), activators and repressors (p-value < 0.05) are respectively present in 60% or more of the γ-proteobacterial genomes list of genomes has been provided in the Supplementary Table 3). 68% of the hubs (p-value < 0.01) and only 41% (p-value < 10−3) of the non-hubs are likewise present in 60% of more of the γ-proteobacterial genomes. Thus, the strongly overlapping categories of TFs, namely dual regulators and hubs appear to be preferentially retained across genomes at small phylogenetic distances. This is in contrast to the absence of such a preferential retention of hubs at larger phylogenetic distances amongst prokaryotes 20; 21. This suggests that at small phylogenetic distances there is stronger selection for retention of the large-scale and bi-directional transcriptional responses. In this regard, a recent study by Hershberg and Margalit 41 has shown that at close phylogenetic distances repressors are only lost from a genome once their targets have themselves been lost, or once the network has significantly rewired whereas activators are often lost even when their targets remain in the genome.
2.5.2 Differential use of 2-component system TFs versus TFs with other signaling modes in bacterial evolution
Looking at the evolutionary conservation of TFs from the perspective of sensing mechanism, we find that more than 80% of the 2-component systems are present in 70% of γ-proteobacterial genomes, while other TF groups sensing different kinds of internal, external or hybrid signals show a much lower conservation. Thus, at short phylogenetic distances we find the TFs belonging to 2-component systems mediate the transcription responses common to most members of a bacterial lineage, while the specific adaptation to a particular niche might arise from the diversification of TFs using other signaling modes.
2.5.3 Phyletic correspondence in combinatorial associations based on mutual information coefficient (MIC) suggests the existence of high phyletic order over random associations in co-regulatory network
To determine if transcription factor pairs that co-regulate the same gene have a tendency to be retained together we used mutual information coefficient (MIC) as a metric to calculate the similarity between the phyletic profiles of the transcription factors (see methods). The distribution of the number of pairs in each interval of MIC suggests an exponential decay of pairs with increasing MIC. In simulation experiments using artificially scrambled phyletic profiles a MIC value of 0.3 or higher between co-regulating TFs is rare. Furthermore, MIC of 0.4 or higher is practically absent for pairs of TFs in scrambled phyletic profiles (Fig 6A). Hence, we extracted pairs of TFs in the CRN with MIC of 0.3 or more for further investigations as they might represent conserved co-regulatory associations. Of the 49 such TFs, 31 formed four distinct modules with 3 or more TFs in them (Fig 6B). Mapping the DNA-binding domain family of the TFs on these modules gave further insights into the evolution of modularity in the CRN.
Fig 6.

Evolutionary dynamics of co-regulatory associations. (A) Plot of the number of pairs of TFs that have co-regulatory associations in various ranges of mutual information (MI) in their phyletic pattern. The red points corresponds to MI evaluated based on actual phyletic pattern, while the black points corresponds to MI evaluated based on random shuffling of phyletic profiles of TFs. It could be easily noted from the figure that a MI of 0.3 or more is rarely attained through random shuffling of phyletic pattern. (B) The three prominent modules of co-regulatory associations between TFs whose phyletic pattern show a MI value of 0.3 or more, have three or more TFs and are enriched with paralogous DNA-binding domains. The first (upper left) is mainly comprised of AraC-type HTH containing TFs, the second (upper right) contains members mostly of the LacI family of HTHs and the third and largest of the three contain OmpR or LuxR families of HTHs.
The first of these modules contains the two regulators GadW and GadX, which are paralogs in the AraC-type HTH family. The second module combines CRP with 3 paralogous TFs of the LacI family of HTHs, namely PurR (controls nucleotide biosynthesis), CytR (binds Cytidine and adenosine and controls nucleotide metabolism) and RbsR (binds to ribose and represses the transcription of rbsDACBK operon). The third module consists predominantly of 2-component regulators that are conserved in 90% of the genomes and contain DNA-binding domains that either belong to the OmpR or LuxR family of TFs. These 2-component TFs possess a phyletic correlation of at least 0.8 among themselves. The fourth module (not shown) consists of a more diverse set of co-regulating TFs with the majority of the TFs in this module containing DNA-binding domains of either the AraC or LacI families of HTH. On the whole these modules are enriched in paralogous TFs. This suggests that lineage-specific proliferation of paralogs, followed by partial retention of ancestral regulatory associations, results in formation of modules, which provide regulatory fine-tuning for a shared set of target genes that is relevant within members of closely related bacterial lineages.
3.0 General discussion and conclusions
It is well-known that, despite general mechanistic similarities and deployment of orthologous RNA-polymerases, eukaryotic and bacterial transcription show profound structural and functional differences. This is particularly so in terms of the basal and specific TFs used in the two systems, as well as organization of the promoters and genes themselves. Yet, in terms of the gross structure of the TRN, researchers have consistently observed a behavior best approximated by scale-free networks in both eukaryotes and bacteria. These observations favored the view that the underlying differences in the structure and function of the eukaryotic and bacterial transcription apparatus do not affect the overall network structure. Here, we demonstrate that in spite of the gross structural similarities the TRN of bacteria and eukaryotes show certain profound differences in network properties that reflect the fundamentally different functional aspects of transcription regulation in the two superkingdoms. Firstly, we found that the degree distribution of TFs in the CRN of the bacterial model, E. coli, follows power-law decay as opposed to the distributed behavior seen in the CRN of the eukaryotic model, yeast. Secondly, eukaryotic and bacterial networks have a very different relationship between connectivities of TFs in the TRN and CRN. The bacterial TFs display either of two largely linear relationships between connectivities in the two networks. However, in yeast only a fraction of the TFs show a linear relationship with others showing no notable correlation between the connectivities in CRN and TRN. Thus, hubs in bacteria TRN are not just global regulators, but also major integrators of disparate transcriptional responses. In yeast the distributed architecture of the CRN was believed to provide an indirect back up against mutational disruption. At first-sight the absence of such a back up in bacterial systems appears counter-intuitive. However, the basic differences in the function of two systems might explain this: The bacterial genes are typically transcribed as poly-cistronic messages from operons sharing a common transcription regulatory element. On top of this several operons/genes may form regulons regulated at a higher level by global regulators. This is very distinct from the system in yeast where there are no operons with poly-cistronic messages, thus requiring genes to be individually regulated via their independent regulatory elements. The consequence of this has been a much greater emphasis on TFs that function as devoted integrators, while not being hubs at the same time.
In most bacteria TFs can be fruitfully classified into a small set of functional classes, either based on their mode of regulation or signal-sensing (See RegulonDB and supplementary material). As this is a quintessential feature of bacterial transcription regulation, we also investigated the relationship between these regulatory modes and network structure. Dual regulators are enriched amongst hubs in both the E. coli TRN and CRN. There is no major preference for any particular category of TFs amongst hubs in the TRN when they were classified by their signal-sensing mode, but the hubs of the CRN, we found some preference for one-component TFs sensing internal signals and 2-component TFs amongst hubs. Further, we observed that there is higher tendency of co-regulatory associations between TFs showing different signal-sensing modes. Thus, global transcriptional control in bacteria appears to have selected for those regulators that allow changes in gene expression in both directions, which possibly enable physiological state changes by shutting off genes associated with the earlier state and activating those required for the new state. The nature of the co-regulatory associations also indicates that there has been selection for strong coupling between TFs utilizing different sensory modes, there by allowing genes to respond to diverse environmental or homeostatic inputs.
At the mid-level organization of the TRN we find evidence for differential distribution of TFs with distinct sensory and regulatory modes. The prevalence of dual regulator and 2-component TFs over all types of motifs in the network suggests that motifs have been engineered to mediate bi-directional changes in expression as well as respond to signal relays initiated by histidine kinases. A parallel optimization of MIMs and FFMs appears to have occurred via preferential distribution of repressors and activators respectively to generate self-amplifying and on-off switch type circuits responding to either external or internal metabolites. Another striking fine-tuning that we observed was at the level of TF transcript half-life which shows relationships with both the type regulatory and sensory mode of the TFs. Strikingly, the dual regulators which are prevalent both in hubs and all motif-types are more short-lived than other TFs implying that the bi-directional transcriptional changes triggered by them are likely to be relatively transient effects that initiate physiological state-changes. Similarly the long transcript half-lives of TFs requiring import of external metabolites appears to suggest that they have been optimized for a “lying-in wait” strategy for responding to environmental changes.
At short phylogenetic distances, we find that dual regulators (which include a major fraction of hubs) and TFs belonging to external 2-component systems display higher degree of conservation than others. Though, on the larger evolutionary scale, unrelated TFs have repeatedly evolved to occupy the position of hubs in the network, within lineages like γ-proteobacteria there is strong tendency to retain hubs. A subset of co-regulating TFs tends to show significantly higher than expected similarities in their phyletic patterns. Modules within the CRN that appear to have higher than expected correlations in terms of phyletic patterns were enriched in paralogous DNA-binding domains, suggesting origin to duplication followed by partial retention of target genes. This might represent a means by which fine-tuning of regulation of certain target genes evolves. The points of emergence of new TFs as hubs on larger evolutionary scales, in contrast to retention of hubs in the γ-proteobacteria lineages might provide useful markers to understand the major regulatory transitions that accompanied the diversification of bacteria. Studies on the distribution of TFs across genomes suggest a regular linear scaling for 2-component TFs and a gentle power-law like increase for one-component TFs1. Thus, it is quite likely that findings reported here have a general bearing for other bacteria with comparable genome sizes and metabolic complexity. However, it must be noted that bacteria can greatly differ in terms of their signaling mechanism. Particularly, certain lineages like cyanobacteria, myxobacteria and filamentous actinomycetes display complex signaling cascades involving STAND superfamily NTPase, eukaryote type serine/threonine kinases, and caspase-like proteases, which are marginal or entirely absent in E. coli1. It is hence conceivable that we find different optimizations of the transcriptional networks in these bacteria. Further, the physiology of cyanobacteria and other photosynthetic forms is geared towards responding to light and redox conditions, which might also result in major differences in network optimization.
Nevertheless, the results presented here define the basic elements of transcriptional network optimization in a bacterial system and can serve as a framework for comparative analysis of transcriptional networks between different bacterial lineages and also eukaryotes.
4.0 Materials and Methods
4.1 Transcriptional regulatory network and co-regulation network
The E. coli K12 transcriptional regulatory network along with the mode of regulatory influence was obtained from RegulonDB 12; 13. This consisted of 146 transcription factors, 1175 target genes and 2489 regulatory interactions. The top 20% of TFs (29 TFs) with most number of target genes were hubs in networks. TFs were classified as activators (or repressors) if they activate (or repress) all their target genes, others were classified as dual regulators based on the information available in RegulonDB. Data on the sensing mechanism for transcription factors were adopted from Martinez-Antonio et al11 when available. For about 30 TFs, a literature search was carried out to determine the sensing mechanism. To obtain the co-regulation network, we adopted the procedure described in Balaji et al 28; 29. In this procedure, we link two transcription factors in the co-regulation network if they regulate at least one common target gene.
4.2 Motifs, mRNA half life data, Orthology, and phyletic profiles
Network motifs were calculated using in house scripts and as defined by Shen-Orr et al 19 and Milo et al 42. The data on half lives of TF transcripts was obtained from the genome scale study by Bernstein et al 37; 38 for minimal media with added glucose. We could obtain this information for 130 TFs. The random trials on half-life data to assess statistical significance of our reported trends was performed by making randomized datasets of the same size by means of drawing entries at random from the original dataset. The method to detect the conservation of TFs in genomes has been adopted from a study on prokaryotic TRNs by Madan Babu et al 20. The calculation of mutual information coefficient (MIC) and random shuffling of profiles have been performed as described in an earlier study by Marcotte et al 43 and Pellegrini et al 44.
4.3 Statistical significance of our observations
To ensure that the observed phenomenon is not an inherent property of the network structure, we carried out all calculations reported here by generating random scale-free networks with similar degree distribution as seen in the real transcriptional network of E. coli. This was done by randomly rewiring the network edges between TFs, while maintaining both the out-going and in-coming degrees of all the TFs and TGs. P-values were calculated as the fraction (over 10,000 trials) of the number of times a value was observed in random networks as that of the real network. P-values for the given percentage of dual regulators to be present in 60% or more of γ-proteobacterial genomes have been calculated based on drawing the same proportion of TFs from the whole list of TFs at random and calculating the percentage of TFs conserved in 60% or more of the genomes. The above procedure was repeated for 1000 trials. Similarly, P-values for the half-lives of TF transcripts in each of the category of TFs was calculated by drawing the exact number of TFs in that category from the entire data set of 130 TFs (for which the data is available) at random for 1000 trials and an average value was calculated for each of the trial.
Supplementary Material
Acknowledgments
SB and LA acknowledge the Intramural research program of National Institutes of Health, USA for funding their research. MMB acknowledges the Medical Research Council, UK for financial support. We thank Lakshminarayan Iyer, Maxwell Burroughs and S. Geetha for carefully reading through the manuscript and providing useful suggestions.
Footnotes
Publisher's Disclaimer: This is a PDF file of an unedited manuscript that has been accepted for publication. As a service to our customers we are providing this early version of the manuscript. The manuscript will undergo copyediting, typesetting, and review of the resulting proof before it is published in its final citable form. Please note that during the production process errors may be discovered which could affect the content, and all legal disclaimers that apply to the journal pertain.
References
- 1.Aravind L, Anantharaman V, Balaji S, Babu MM, Iyer LM. The many faces of the helix-turn-helix domain: transcription regulation and beyond. FEMS Microbiol Rev. 2005;29:231–62. doi: 10.1016/j.femsre.2004.12.008. [DOI] [PubMed] [Google Scholar]
- 2.Ulrich LE, Koonin EV, Zhulin IB. One-component systems dominate signal transduction in prokaryotes. Trends Microbiol. 2005;13:52–6. doi: 10.1016/j.tim.2004.12.006. [DOI] [PMC free article] [PubMed] [Google Scholar]
- 3.Aravind L, Koonin EV. DNA-binding proteins and evolution of transcription regulation in the archaea. Nucleic Acids Res. 1999;27:4658–70. doi: 10.1093/nar/27.23.4658. [DOI] [PMC free article] [PubMed] [Google Scholar]
- 4.Perez-Rueda E, Collado-Vides J. The repertoire of DNA-binding transcriptional regulators in Escherichia coli K-12. Nucleic Acids Res. 2000;28:1838–47. doi: 10.1093/nar/28.8.1838. [DOI] [PMC free article] [PubMed] [Google Scholar]
- 5.Madan Babu M, Teichmann SA. Evolution of transcription factors and the gene regulatory network in Escherichia coli. Nucleic Acids Res. 2003;31:1234–44. doi: 10.1093/nar/gkg210. [DOI] [PMC free article] [PubMed] [Google Scholar]
- 6.Anantharaman V, Koonin EV, Aravind L. Regulatory potential, phyletic distribution and evolution of ancient, intracellular small-molecule-binding domains. J Mol Biol. 2001;307:1271–92. doi: 10.1006/jmbi.2001.4508. [DOI] [PubMed] [Google Scholar]
- 7.Perraud AL, Weiss V, Gross R. Signalling pathways in two-component phosphorelay systems. Trends Microbiol. 1999;7:115–20. doi: 10.1016/s0966-842x(99)01458-4. [DOI] [PubMed] [Google Scholar]
- 8.Russo FD, Silhavy TJ. The essential tension: opposed reactions in bacterial two-component regulatory systems. Trends Microbiol. 1993;1:306–10. doi: 10.1016/0966-842x(93)90007-e. [DOI] [PubMed] [Google Scholar]
- 9.Groisman EA, Mouslim C. Sensing by bacterial regulatory systems in host and non-host environments. Nat Rev Microbiol. 2006;4:705–9. doi: 10.1038/nrmicro1478. [DOI] [PubMed] [Google Scholar]
- 10.Browning DF, Busby SJ. The regulation of bacterial transcription initiation. Nat Rev Microbiol. 2004;2:57–65. doi: 10.1038/nrmicro787. [DOI] [PubMed] [Google Scholar]
- 11.Martinez-Antonio A, Janga SC, Salgado H, Collado-Vides J. Internal-sensing machinery directs the activity of the regulatory network in Escherichia coli. Trends Microbiol. 2006;14:22–7. doi: 10.1016/j.tim.2005.11.002. [DOI] [PubMed] [Google Scholar]
- 12.Salgado H, Santos-Zavaleta A, Gama-Castro S, Peralta-Gil M, Penaloza-Spinola MI, Martinez-Antonio A, Karp PD, Collado-Vides J. The comprehensive updated regulatory network of Escherichia coli K-12. BMC Bioinformatics. 2006;7:5. doi: 10.1186/1471-2105-7-5. [DOI] [PMC free article] [PubMed] [Google Scholar]
- 13.Huerta AM, Salgado H, Thieffry D, Collado-Vides J. RegulonDB: a database on transcriptional regulation in Escherichia coli. Nucleic Acids Res. 1998;26:55–9. doi: 10.1093/nar/26.1.55. [DOI] [PMC free article] [PubMed] [Google Scholar]
- 14.Babu MM, Luscombe NM, Aravind L, Gerstein M, Teichmann SA. Structure and evolution of transcriptional regulatory networks. Curr Opin Struct Biol. 2004;14:283–91. doi: 10.1016/j.sbi.2004.05.004. [DOI] [PubMed] [Google Scholar]
- 15.Barabasi AL, Oltvai ZN. Network biology: understanding the cell's functional organization. Nat Rev Genet. 2004;5:101–13. doi: 10.1038/nrg1272. [DOI] [PubMed] [Google Scholar]
- 16.Thieffry D, Huerta AM, Perez-Rueda E, Collado-Vides J. From specific gene regulation to genomic networks: a global analysis of transcriptional regulation in Escherichia coli. Bioessays. 1998;20:433–40. doi: 10.1002/(SICI)1521-1878(199805)20:5<433::AID-BIES10>3.0.CO;2-2. [DOI] [PubMed] [Google Scholar]
- 17.Guelzim N, Bottani S, Bourgine P, Kepes F. Topological and causal structure of the yeast transcriptional regulatory network. Nat Genet. 2002;31:60–3. doi: 10.1038/ng873. [DOI] [PubMed] [Google Scholar]
- 18.Teichmann SA, Babu MM. Gene regulatory network growth by duplication. Nat Genet. 2004;36:492–6. doi: 10.1038/ng1340. [DOI] [PubMed] [Google Scholar]
- 19.Shen-Orr SS, Milo R, Mangan S, Alon U. Network motifs in the transcriptional regulation network of Escherichia coli. Nat Genet. 2002;31:64–8. doi: 10.1038/ng881. [DOI] [PubMed] [Google Scholar]
- 20.Madan Babu M, Teichmann SA, Aravind L. Evolutionary dynamics of prokaryotic transcriptional regulatory networks. J Mol Biol. 2006;358:614–33. doi: 10.1016/j.jmb.2006.02.019. [DOI] [PubMed] [Google Scholar]
- 21.Lozada-Chavez I, Janga SC, Collado-Vides J. Bacterial regulatory networks are extremely flexible in evolution. Nucleic Acids Res. 2006;34:3434–45. doi: 10.1093/nar/gkl423. [DOI] [PMC free article] [PubMed] [Google Scholar]
- 22.McAdams HH, Srinivasan B, Arkin AP. The evolution of genetic regulatory systems in bacteria. Nat Rev Genet. 2004;5:169–78. doi: 10.1038/nrg1292. [DOI] [PubMed] [Google Scholar]
- 23.Luscombe NM, Babu MM, Yu H, Snyder M, Teichmann SA, Gerstein M. Genomic analysis of regulatory network dynamics reveals large topological changes. Nature. 2004;431:308–12. doi: 10.1038/nature02782. [DOI] [PubMed] [Google Scholar]
- 24.Harbison CT, Gordon DB, Lee TI, Rinaldi NJ, Macisaac KD, Danford TW, Hannett NM, Tagne JB, Reynolds DB, Yoo J, Jennings EG, Zeitlinger J, Pokholok DK, Kellis M, Rolfe PA, Takusagawa KT, Lander ES, Gifford DK, Fraenkel E, Young RA. Transcriptional regulatory code of a eukaryotic genome. Nature. 2004;431:99–104. doi: 10.1038/nature02800. [DOI] [PMC free article] [PubMed] [Google Scholar]
- 25.Farkas IJ, Wu C, Chennubhotla C, Bahar I, Oltvai ZN. Topological basis of signal integration in the transcriptional-regulatory network of the yeast, Saccharomyces cerevisiae. BMC Bioinformatics. 2006;7:478. doi: 10.1186/1471-2105-7-478. [DOI] [PMC free article] [PubMed] [Google Scholar]
- 26.Balazsi G, Barabasi AL, Oltvai ZN. Topological units of environmental signal processing in the transcriptional regulatory network of Escherichia coli. Proc Natl Acad Sci U S A. 2005;102:7841–6. doi: 10.1073/pnas.0500365102. [DOI] [PMC free article] [PubMed] [Google Scholar]
- 27.Balazsi G, Oltvai ZN. Sensing your surroundings: how transcription-regulatory networks of the cell discern environmental signals. Sci STKE 2005. 2005:pe20. doi: 10.1126/stke.2822005pe20. [DOI] [PubMed] [Google Scholar]
- 28.Balaji S, Babu MM, Iyer LM, Luscombe NM, Aravind L. Comprehensive analysis of combinatorial regulation using the transcriptional regulatory network of yeast. J Mol Biol. 2006;360:213–27. doi: 10.1016/j.jmb.2006.04.029. [DOI] [PubMed] [Google Scholar]
- 29.Balaji S, Iyer LM, Aravind L, Babu MM. Uncovering a hidden distributed architecture behind scale-free transcriptional regulatory networks. J Mol Biol. 2006;360:204–12. doi: 10.1016/j.jmb.2006.04.026. [DOI] [PubMed] [Google Scholar]
- 30.Hermsen R, Tans S, Wolde PR. Transcriptional Regulation by Competing Transcription Factor Modules. PLoS Comput Biol. 2006;2:e164. doi: 10.1371/journal.pcbi.0020164. [DOI] [PMC free article] [PubMed] [Google Scholar]
- 31.Janga SC, Salgado H, Collado-Vides J, Martinez-Antonio A. Internal versus external effector and transcription factor gene pairs differ in their relative chromosomal position in Escherichia coli. J Mol Biol. 2007;368:263–72. doi: 10.1016/j.jmb.2007.01.019. [DOI] [PubMed] [Google Scholar]
- 32.Seshasayee AS, Bertone P, Fraser GM, Luscombe NM. Transcriptional regulatory networks in bacteria: from input signals to output responses. Curr Opin Microbiol. 2006;9:511–9. doi: 10.1016/j.mib.2006.08.007. [DOI] [PubMed] [Google Scholar]
- 33.Itzkovitz S, Tlusty T, Alon U. Coding limits on the number of transcription factors. BMC Genomics. 2006;7:239. doi: 10.1186/1471-2164-7-239. [DOI] [PMC free article] [PubMed] [Google Scholar]
- 34.Takeda S, Fujisawa Y, Matsubara M, Aiba H, Mizuno T. A novel feature of the multistep phosphorelay in Escherichia coli: a revised model of the RcsC --> YojN --> RcsB signalling pathway implicated in capsular synthesis and swarming behaviour. Mol Microbiol. 2001;40:440–50. doi: 10.1046/j.1365-2958.2001.02393.x. [DOI] [PubMed] [Google Scholar]
- 35.Dekel E, Mangan S, Alon U. Environmental selection of the feed-forward loop circuit in gene-regulation networks. Phys Biol. 2005;2:81–8. doi: 10.1088/1478-3975/2/2/001. [DOI] [PubMed] [Google Scholar]
- 36.Lee TI, Rinaldi NJ, Robert F, Odom DT, Bar-Joseph Z, Gerber GK, Hannett NM, Harbison CT, Thompson CM, Simon I, Zeitlinger J, Jennings EG, Murray HL, Gordon DB, Ren B, Wyrick JJ, Tagne JB, Volkert TL, Fraenkel E, Gifford DK, Young RA. Transcriptional regulatory networks in Saccharomyces cerevisiae. Science. 2002;298:799–804. doi: 10.1126/science.1075090. [DOI] [PubMed] [Google Scholar]
- 37.Bernstein JA, Lin PH, Cohen SN, Lin-Chao S. Global analysis of Escherichia coli RNA degradosome function using DNA microarrays. Proc Natl Acad Sci U S A. 2004;101:2758–63. doi: 10.1073/pnas.0308747101. [DOI] [PMC free article] [PubMed] [Google Scholar]
- 38.Bernstein JA, Khodursky AB, Lin PH, Lin-Chao S, Cohen SN. Global analysis of mRNA decay and abundance in Escherichia coli at single-gene resolution using two-color fluorescent DNA microarrays. Proc Natl Acad Sci U S A. 2002;99:9697–702. doi: 10.1073/pnas.112318199. [DOI] [PMC free article] [PubMed] [Google Scholar]
- 39.Wang E, Purisima E. Network motifs are enriched with transcription factors whose transcripts have short half-lives. Trends Genet. 2005;21:492–5. doi: 10.1016/j.tig.2005.06.013. [DOI] [PubMed] [Google Scholar]
- 40.Dobrin R, Beg QK, Barabasi AL, Oltvai ZN. Aggregation of topological motifs in the Escherichia coli transcriptional regulatory network. BMC Bioinformatics. 2004;5:10. doi: 10.1186/1471-2105-5-10. [DOI] [PMC free article] [PubMed] [Google Scholar]
- 41.Hershberg R, Margalit H. Co-evolution of transcription factors and their targets depends on mode of regulation. Genome Biol. 2006;7:R62. doi: 10.1186/gb-2006-7-7-r62. [DOI] [PMC free article] [PubMed] [Google Scholar]
- 42.Milo R, Shen-Orr S, Itzkovitz S, Kashtan N, Chklovskii D, Alon U. Network motifs: simple building blocks of complex networks. Science. 2002;298:824–7. doi: 10.1126/science.298.5594.824. [DOI] [PubMed] [Google Scholar]
- 43.Marcotte EM, Pellegrini M, Ng HL, Rice DW, Yeates TO, Eisenberg D. Detecting protein function and protein-protein interactions from genome sequences. Science. 1999;285:751–3. doi: 10.1126/science.285.5428.751. [DOI] [PubMed] [Google Scholar]
- 44.Pellegrini M, Marcotte EM, Thompson MJ, Eisenberg D, Yeates TO. Assigning protein functions by comparative genome analysis: protein phylogenetic profiles. Proc Natl Acad Sci U S A. 1999;96:4285–8. doi: 10.1073/pnas.96.8.4285. [DOI] [PMC free article] [PubMed] [Google Scholar]
Associated Data
This section collects any data citations, data availability statements, or supplementary materials included in this article.