

Abstract
Little is known about how Mycobacterium tuberculosis regulates gene expression in response to its host environment, despite its importance as a pathogen. We previously characterized 10 acr-coregulated genes (ACGs), all of which belong to the DevR (DosR) “dormancy” regulon, and identified one to three copies of a conserved 18-bp palindromic DNA motif in the promoter of each ACG family member. In the present study, we used base substitution analyses to assess the importance of individual motif copies and to identify additional regulatory sequences in five ACG promoters. Regulation of acr, acg, Rv2623, narK2, and Rv1738 was examined by using single-copy M. tuberculosis promoter-lacZ reporter constructs in Mycobacterium bovis BCG under conditions of ambient air versus hypoxia, each in shaking versus standing shallow culture conditions. We found that regulation of these ACG promoters is more heterogeneous than expected and is controlled at multiple levels. In addition to the positive regulation previously associated with DevR (DosR) and the 18-bp ACG motif, we identified negative regulation associated with sequences in the 5′ untranslated regions of acg and Rv2623 and positive regulation associated with far upstream regulatory regions of narK2 and Rv1738. The importance of individual ACG motifs varied among the promoters examined, and Rv1738 was exceptional in that its ACG motif copies were associated with negative, rather than positive, regulation under some conditions. Further understanding of this important regulon requires the identification of additional regulators that compete and/or collaborate with DevR (DosR) to regulate its individual gene members.
Tuberculosis (TB) continues to be one of the deadliest communicable diseases in the world, causing both latent and acute infections. Approximately two million people die of TB annually, and about one-third of the global population harbors an asymptomatic latent infection which can reactivate to cause active TB disease (51). A lack of drugs or vaccines that can specifically target the latent bacteria further increases the risk of future disease from this vast reservoir of latent infections. Mycobacterium tuberculosis is believed to exist in a state of nonreplicating persistence with low metabolic activity during latency (48, 49). Understanding the mechanisms used by M. tuberculosis to persist in this state and later shift to a metabolically active and infectious form has been one of the most challenging problems in TB research.
Previous studies have shown that expression of the 16-kDa M. tuberculosis α-crystallin protein, Acr, encoded by acr (also called hspX, Rv2031c) occurs in vivo (13, 18, 43, 53) and is rapidly induced during stationary-phase growth, in unagitated submerged cultures, and in oxygen-limiting or nitric oxide (NO)-enriched microenvironments (9, 10, 17, 22, 34, 42, 48, 52, 53). acr is a member of the DevR (also called DosR) “dormancy” regulon that includes genes that are positively regulated in response to hypoxia and/or low levels of NO (28, 31, 41, 42, 47). Acr was initially linked with Mtb latency because of its expression profile (46, 52, 53), and recent studies have shown that upregulation of DevR regulon members is associated with epidemic spread and increased drug resistance in the W-Beijing lineage of M. tuberculosis (36). Although the specific biological role of the DevR regulon remains to be confirmed, it is clear that these genes are regulated in response to biologically relevant environmental conditions associated with host infection.
Very little is known about the gene regulatory mechanisms that control the expression of DevR regulon members. We previously characterized a subset of the DevR regulon that includes acr and 10 other acr-coregulated genes (ACGs). All ACG family members coordinately upregulate within macrophages, in shallow standing cultures, and under low-oxygen conditions (9, 22, 34, 48). In addition, all ACG family promoters have one to three copies of a conserved 18-bp palindromic sequence motif in their upstream intergenic regions (9). This motif has been shown to bind DevR (31), and copies of this motif overlap cis-acting regulatory regions that are required for the induction of ACG family members acr and acg (34). However, the importance of individual ACG motif copies for gene expression has not been rigorously assessed. In addition, none of the DevR-regulated promoters has been extensively characterized at the regulatory level. An understanding of the mechanisms that modulate the expression of these genes may provide useful insight into Mtb's regulatory response to host environments, possibly during conditions associated with its transition into dormancy.
The objectives of the present study were to experimentally test the importance of the computationally predicted motif copies and to identify additional regulatory regions within the ACG promoters. We used scanning DNA substitution analyses of single-copy integrated promoter-lacZ reporter fusions in the vaccine strain Mycobacterium bovis BCG to identify cis regulatory sequences within ACG family promoters, including acr, acg, Rv2623, narK2, and Rv1738. We found that the importance of individual DevR-associated ACG motif copies varied among the different promoters and that additional sequences in both the proximal 5′ untranslated region (5′ UTR) and distal regions upstream of these promoters contribute to their overall activity. These results indicate that regulation of ACG family members is complex, includes multiple levels of both positive and negative regulation, and likely occurs by both DevR-dependent and DevR-independent mechanisms. Elucidation of these regulatory mechanisms and the environmental signals to which they respond is critical for understanding the role of the DevR regulon during host infection.
MATERIALS AND METHODS
Bacterial culture conditions.
Derivatives of M. bovis BCG (Pasteur strain, Trudeau Institute) and M. tuberculosis H37Rv (ATCC 25618) were grown in mycomedium (Middlebrook 7H9 liquid medium [Difco] supplemented with 0.5% glycerol, 10% oleic acid-dextrose-catalase, and 0.05% Tween 80) and kanamycin (25 μg/ml). All fresh cultures were started from frozen stocks as described previously (34) and immediately transferred to the desired experimental culture conditions. Cultures were grown at 37°C in 25-cm2 tissue culture flasks in medium at a shallow depth of 2 mm under conditions of high oxygen-ambient air (20% O2, 0% CO2) or low oxygen (1.3% O2, 5% CO2) in a controlled atmospheric incubator (series II; Forma Scientific, Inc.) as reported earlier (9) and maintained either shaking or standing for 7 days (late log phase).
Analyses of ACG promoter expression in single copy.
The promoters of M. tuberculosis genes from the ACG family that were previously upregulated under different environmental conditions using a multicopy promoter-gfp fusion system (9) were reanalyzed for their regulation in single copy. The promoters of 10 genes (see Table S1 in the supplemental material) were digested with BamHI from the previously constructed gfp fusion vectors (9) and cloned upstream of the promoterless lacZ open reading frame (ORF) in the single-copy integrative vector pLACint. This vector contains the attachment and integrating sequences (attP/int) from mycobacteriophage L5 (34). Promoter fusion constructs were verified by DNA sequence analyses and transformed into M. bovis BCG cells by electroporation (30) for gene expression analyses.
Analysis of β-galactosidase activity.
M. tuberculosis promoter activities were examined in BCG by measuring β-galactosidase activity with 5-acetylaminofluorescein di-β-d-galactopyranoside (C2FDG; Molecular Probes) in a Cytofluor 4000 fluorometer (PerSeptive Biosystems) as described previously (39). C2FDG readily enters viable mycobacterial cells and produces fluorescein upon cleavage by β-galactosidase. A 500-μl volume of the cultures was briefly sonicated (Virsonic; Virtis Inc.) at 4°C for 20 s at setting 4 to declump the cells. A 50-μl volume of the culture was mixed with an equal volume of 66 μM C2FDG dye solution in a 96-well microtiter plate and incubated at 37°C for 2 h before the measurement of β-galactosidase activity. A medium-only negative control with dye solution was used for background subtraction (blank). The optical density at 650 nm (OD650) was also measured to determine the number of bacteria per well. Fluorescence counts were then normalized to 106 bacteria on the basis of the OD650 readings, where an OD650 of 1 corresponds to 5 × 10⁸ cells, as determined by plate counts of CFU.
Primer extension.
Total RNA was extracted from M. tuberculosis H37Rv late-log-phase cultures grown under standing high-oxygen conditions as described previously (11). For a list of the primers used in the primer extension experiments, see Table S2 in the supplemental material. All of the primers used fall within the native ORFs, except for one primer (KM1203) used to confirm the acg start site from within the integrated lacZ reporter gene fusion construct. Oligonucleotide primers were 5′ end labeled with [γ-32P]ATP by using T4 polynucleotide kinase. One picomole of labeled primer was annealed to 10 μg of total RNA at 50°C for 20 min, and primer extension reactions were carried out with Superscript II reverse transcriptase (Invitrogen) according to the manufacturer's instructions. Twenty microliters of loading dye (98% formamide, 10 mM EDTA, 0.1% xylene cyanol, 0.1% bromophenol blue) was added to the sample, and the reaction products were run on a 6% denaturing polyacrylamide gel containing 7 M urea. The sequence ladder (GATC) was generated with the Thermo Sequenase kit (Invitrogen) according to the manufacturer's instructions. The plasmid containing the acg promoter fused to lacZ (pMBC390) was used as the template with primer KM1203. Bands were visualized by phosphorimaging (Storm 860; Molecular Dynamics).
Base substitution in ACG promoters.
By a PCR-based overlap extension method, 18-bp substitutions were made in the M. tuberculosis H37Rv acr, acg, narK2, Rv1738, and Rv2623 promoters by using an 18-bp random replacement sequence (GGTAACTCAGTAGATATA) that was unrelated to the promoter sequence. Sequential 18-bp substitutions were made spanning the entire length (198 bp) of the acr and acg intergenic region (see Fig. 4a). Substitutions were made only in the 18-bp conserved palindromic ACG motif regions (9), the 5′ UTR, and the upstream regulatory region (URR) in the narK2, Rv1738, and Rv2623 promoters (see Fig. 4b and c).
FIG. 4.

Schematic of individual 18-bp regions (shaded or striped regions) replaced with an 18-bp random sequence in the promoters of divergently transcribed genes acr-acg (a) and narK2-Rv1738 (b) and nondivergent Rv2623 (c). Eighteen-base-pair regions were sequentially replaced in the acr and acg promoters, which are prototype members of ACG family, while in the other promoters only the important regulatory regions were replaced. The hashed regions (M1, M2, and M3) are the conserved palindromic sequence motifs identified previously and predicted to be DevR-binding sites, while the shaded areas in narK2, Rv1738, and Rv2623 represents the 5′ UTR and the URR.
For the primers used to replace the different promoter regions, see Table S3 in the supplemental material. The first PCR was performed to replace the top strand by using the forward primer with the random sequence and the promoter-specific reverse primer (see Table S1 in the supplemental material). The second PCR, to replace the bottom strand, was performed with the promoter-specific forward primer (see Table S1 in the supplemental material) and the reverse primer with the random sequence. For overlap extension, the two PCR products were mixed in equal concentrations, denatured by placement in boiling water, and annealed by being gradually allowed to cool to room temperature. The annealed mixture was then extended and amplified during PCR with promoter-specific forward and reverse primers and cloned into a TA vector. The modified promoters were subsequently digested with BamHI and cloned into the single-copy integrative promoterless lacZ reporter vector pLACint (45). All final promoter constructs were verified by sequencing.
Expression and purification of DevR.
devR was PCR amplified from M. tuberculosis H37Rv with primers KM1492 (5′-GAATTCGTGGTAAAGGTCTTCTTGGTCG-3′) and KM1493 (5′-AAGCTTTTGTCATGGTCCATCACCGGGTGG-3′) with EcoRI and HindIII restriction sites (underlined). The amplified DNA fragment was cloned into pET28a+ (Novagen) at the EcoRI and HindIII sites to generate pMBC605, verified by sequencing, and maintained in Escherichia coli BL21(DE3). DevR expression was induced at room temperature in a bacterial culture (OD600, 0.8) with 1 mM isopropyl-β-d-thiogalactopyranoside (IPTG) for 3 h and confirmed by sodium dodecyl sulfate (SDS)-polyacrylamide gel electrophoresis. Purification of the protein was done as described previously (4). Briefly, a 200-ml culture was harvested and resuspended in 5 ml lysis buffer containing 50 mM Tris-HCl (pH 8.0), 50 mM NaCl, 1 mM dithiothreitol, and 1% protease inhibitor cocktail (Sigma). Bacteria were lysed by two freeze-thaw cycles (−70°C to 37°C) and sonicated for 10 min at 4°C, followed by two additional freeze-thaw cycles. The lysate was cleared by centrifugation at 13,000 × g for 10 min and filtered through 0.45-μm filters. DevR was purified with a Hitrap affinity column (Amersham Biosciences) in accordance with the manufacturer's instructions, and the eluted protein was dialyzed against phosphate-buffered saline with 10% glycerol. The protein concentration was measured with the NanoOrange protein quantitation kit (Molecular Probes) and diluted to 2 mg/ml before being stored in aliquots at −70°C.
DNase I footprinting.
The DNase I footprinting assay was performed as described previously (3). A 216-bp DNA fragment containing the acr-acg intergenic region was PCR amplified with primers KM511 (GGATCCGTCCGGCATGATCAACCTCC) and KM506A′ (GGATCCGGTGGCCATTTGATGCCTCC). Primer KM511 was end labeled with T4 polynucleotide kinase (New England BioLabs) and [γ-32P]ATP (MP Biomedicals) to generate a single end-labeled probe. DevR protein was incubated with binding buffer containing 25 mM Tris-HCl (pH 8.0), 20 mM KCl, 0.5 mM EDTA, 6 mM MgCl2, 5% glycerol, 0.1 mM dithiothreitol, and 1 μg poly(dI-dC) as a nonspecific competitor on ice for 20 min. DNA probe (0.5 pmol) was added in a final reaction volume of 100 μl, and binding reactions were performed for an additional 30 min on ice. The samples were then subjected to DNase I digestion in 10 mM MgCl2 and 5 mM CaCl2 for 1 min at room temperature. Digestion was terminated by the addition of 200 μl stop solution (1% SDS, 200 mM NaCl, 20 mM EDTA, 20 μg/ml salmon sperm DNA). Samples were extracted once with phenol-chloroform, and DNA was precipitated with ethanol, dried, and resuspended in formamide loading dye. Samples were loaded onto a 7 M urea-8% polyacrylamide sequencing gel. A dideoxynucleotide sequencing ladder was generated with a Thermo Sequenase cycle sequencing kit (USB) with the same end-labeled primer that was used for footprinting.
RNA extraction.
Recombinant BCG strains with either the wild-type (WT) or the 5′ UTR-substitution-containing promoter fused to lacZ were grown for 7 days in 5 ml mycomedium at 37°C in ambient air, either shaking (Hi.Shk) or standing (Hi.Std). Immediately after the flasks were taken out of the incubator, cultures were treated with 1 ml of 4 M guanidinium thiocyanate. A 1.8-ml volume of the culture was centrifuged at 13,000 × g for 4 min at 4°C. RNA was extracted immediately as described previously (11). Briefly, pellets were washed with 0.5% Tween 80 and resuspended in RNase-free water. Cells were disrupted mechanically with a bead beater (BioSpec Products) with two rounds of beating on high for 100 s in a mixture of 0.1-mm zirconia-silica beads (BioSpec Products), 45% Divolab no. 1 (Diversey), 45% acid phenol, and 10% chloroform-isoamyl alcohol (24:1). RNA was reextracted with an equal volume of chloroform-isoamyl alcohol and precipitated with isopropanol and 3 M sodium acetate (pH 5.2). RNA was resuspended in RNase-free water, and DNA contamination was removed with the RNeasy Mini kit by following manufacturer's specifications (Qiagen).
Semiquantitative RT-PCR.
Reverse transcription (RT) for first-stand cDNA synthesis was performed as previously described (11). Semiquantitative PCR was performed for 30 cycles on appropriately diluted cDNA following PCR amplifications with a series of cDNA dilutions (0 to 1:1,000) to ensure that quantitation was done in the linear range of the PCR. Control reactions with cDNA diluted to 10−5 or 10−6 to amplify 23S RNA templates were used to normalize samples before comparing lacZ expression levels. For the primers used to analyze different genes, see Table S4 in the supplemental material. PCRs were also performed for 23S RNA by using total RNA without RT to ensure the absence of DNA contamination. Quantification of individual bands on ethidium bromide-stained agarose gels was done with the ImageQuant software.
Statistical analysis.
Student's t test was used to determine the significance of differences between various test results. GraphPad Instat version 3.0b for Macintosh (GraphPad Software, San Diego, CA) was used for these calculations. P values of <0.05 were considered significant.
RESULTS
Analysis of single-copy ACG promoters in BCG.
We previously examined the regulation of M. tuberculosis ACG family promoters with a multicopy promoter-gfp-based fusion system and found that a subset of at least 10 promoters was coregulated in response to three different environmental conditions (9). Multicopy reporters have the advantage of higher signal output, but they can miss subtle regulatory effects due to the titration of trans-acting transcription factors (44). In the present study, we reanalyzed the expression of eight of these promoters in single copy with an integrative promoter-lacZ fusion system that measures relative β-galactosidase activity with fluorescence-based C2FDG as a substrate (34). This assay is more sensitive than the green fluorescent protein assay and can be used with viable TB complex mycobacteria, making it ideal for extensive single-copy analyses (39).
All single-copy promoters were upregulated in response to shallow standing or hypoxic conditions, consistent with our previous observations obtained by using the multicopy gfp reporter system (34). The activity levels of the Rv1738, Rv2623, narK2, and Rv3131 promoters in low-oxygen standing cultures were further elevated, compared with those in shaking low-oxygen cultures, suggesting a combinatorial effect of these conditions. This additional level of gene induction was not observed in the previous multicopy experiments. The expression of all of the ACG promoters under shaking high-oxygen (ambient air) conditions was comparable to background promoterless lacZ levels, as expected (Fig. 1). On the basis of these initial studies, we selected the promoters of five candidate genes (acr, acg, narK2, Rv1738, and Rv2623) for further characterization. acr and acg are the prototype members of the ACG family. The narK2 and Rv1738 promoters structurally resemble those of acr and acg in that they are divergently transcribed, and each pair has three similarly distributed ACG motif copies. In contrast, the Rv2623 promoter is nondivergently expressed and has only two ACG motif copies.
FIG. 1.

Relative expression of ACG family promoters in single copy in M. bovis BCG during growth under high- and low-oxygen, shaking versus standing conditions. Recombinant bacteria were grown under different culture conditions, which included high-oxygen shaking (Hi.Shk, 20% O2 and 0% CO2), high-oxygen standing (Hi.Std, 20% O2 and 0% CO2), low-oxygen shaking (Lo.Shk, 1.3% O2 and 5% CO2), and low-oxygen standing (Lo.Std, 1.3% O2 and 5% CO2) for 7 days (late log phase). The regulation of promoter activity under the different environmental conditions was determined by measuring β-galactosidase activity with C2FDG. BCG cultures carrying the promoterless (Lac) or the constitutive tuf (tuf) promoter-lacZ reporter gene served as negative and positive controls, respectively, for the experiment and throughout the study. The mean of three independent experiments is shown, and the error bars denote standard deviations. The difference in ACG promoter expression levels between uninduced (Hi.Shk) and induced conditions was significant (P < 0.05) for each of the three inducing conditions, although hypoxia induction of Rv3127 and Rv3130c was low compared to that under other conditions. In addition, asterisks denote cases in which levels of reporter expression associated with at least one of the standing cultures significantly exceeded that of hypoxia (t test for independent samples; *, P = 0.01 to 0.05; **, P = 0.001 to 0.01; ***, P < 0.001).
Determination of the transcriptional start points (TSPs) of the ACGs.
Primer extension studies were done to map the TSPs of acg, Rv2623, and Rv1738 with RNA isolated from standing bacterial cultures grown in ambient air (Fig. 2). The TSPs of acr and narK2 were previously determined (17, 19, 31). The primary TSP obtained for acg corresponded to a T 25 bp upstream of the start codon and occurred with three different primers (Fig. 2a; see Table S2 in the supplemental material). A second possible TSP was found at the adjacent G (at 24 bp) and was obtained with two different primers within the native acg ORF but not from within the lacZ reporter gene. A strong band corresponding to a C at 19 bp was present only with one primer (KM808) and may be an incomplete extension product. A potential −10 region (AAAGAT) with a 4-of-6-bp match with the consensus sequence TAYGAT (where Y is either a C or a T) (26) is centered 9 bp upstream of the first start site. Two possible −35 sequences are located in the region from −41 to −20 relative to the acg transcriptional start site (Fig. 3A). The putative −35 sequence (TTGTCT) has a 5-of-6-bp match to that of M. tuberculosis 85A's −35 sequence, TTGACT, while the second sequence (CCAACC) has a 4-of-6-bp match to the BCG mpb70 −35 sequence (CCGATC) (24).
FIG. 2.

PhosphorImager profile showing the TSPs of acg (a), Rv2623 (b), and Rv1738 (c). G, A, T, and C make up the DNA sequence ladder derived with a plasmid containing the acg promoter fused to lacZ with primer KM1203. acg has two TSPs mapping to C, G, and T, corresponding to 24 and 25 nucleotides upstream of ATG. Rv2623 has two TSPs mapping to A and G situated 54 and 56 nucleotides upstream of ATG, while the Rv1738 TSP maps to G at 81 bases upstream.
FIG. 3.

Intergenic sequences of acr-acg (A), Rv2623 (B), and narK2-Rv1738 (C) showing the positions of the TSPs and the important regulatory regions identified. The TSPs for acg, Rv2623, and Rv1738 are indicated by asterisks. The potential −10 and −35 regions are underlined (thin lines). The TSPs indicated by upward-pointing arrowheads and the predicted −10 and −35 sequences for acr and narK2 are derived from previous reports (17, 19, 31). The important regulatory regions are underlined (thick lines), and the dots (•) represent the area within which 18-bp sequential substitutions have been made (SR-1, SR-2, M0, SR-3, SR-4, and SR-5). In acr-acg intergenic region, the 4-bp spacer between motifs M3 and M2 has not been replaced. In Rv2623 and narK2, only the specified regulatory regions have been replaced with a random sequence.
Two TSPs were mapped for Rv2623, including a G (56 bp) and an A (54 bp) upstream of the annotated Rv2623 ATG start codon (Fig. 2b). Both bands were obtained with each of two different primers (see Table S2 in the supplemental material). Potential −10 (TACCGT) and −35 (CTGAGC) regions with a 4-of-6-bp match to the −10 consensus sequence (TAYGAT) and the mpb70 −35 sequence (CCGATC) are marked (Fig. 3B).
A major primer extension product was obtained for Rv1738 mapping at the G situated 81 nucleotides upstream of the annotated Rv1738 start codon (Fig. 2c). The same extension product occurred with each of two different primers. The potential −10 region (TCGGAT) has a 4-of-6-bp match to the consensus sequence, while a possible −35 region (CCTATC) has a 5-of-6-bp match to the mpb70 consensus sequence (Fig. 3C). As with many other mycobacterial promoters (24), the distance between the −10 and −35 regions was approximately 14 to 20 nucleotides. A highly conserved putative Shine-Dalgarno sequence is centered 7 bp upstream of the start codon of each ORF.
Sequence substitution analyses of acr and acg promoters.
We previously showed that deletions in the regions of the acr and acg promoters containing the ACG motif copies resulted in decreased expression of multicopy green fluorescent protein reporter genes (34). However, these studies did not address the importance of individual motif copies in the expression of acr and acg, nor did they address the possibility of other downstream regulatory sequences. We generated a series of modified promoter sequences by sequentially replacing successive 18-bp regions between the TSPs of acr and acg with a random spacer sequence to identify cis sequences that affect promoter function (Fig. 4a). We also replaced 18 bp within the acr 5′ UTR, on the basis of a previous observation suggesting that the narK2 5′ UTR contains a regulatory element (19).
The effects of these base substitutions on promoter expression levels were examined in BCG grown to late log phase (7 days) under each of the four different shallow depth (2 mm) ACG conditions, which include shaking (Hi.Shk) or standing cultures (Hi.Std) under high-oxygen conditions (i.e., ambient air at ∼20% O2, 0% CO2) and shaking (Lo.Shk) or standing cultures (Lo.Std) under low-oxygen (1.3% O2, 5% CO2) conditions. Promoterless lacZ constructs were used to establish the background levels. As expected, only basal levels of β-galactosidase expression were observed under Hi.Shk conditions, regardless of the sequence substitution (Fig. 5a and e). Replacement of any one of the ACG motif copies (M1, M2, or M3) decreased the expression levels under all conditions, demonstrating that each of the three motif copies contributed to the positive regulation of both acr and acg promoter activities. However, the effects of different motif copies on each promoter varied.
FIG. 5.

Relative expression of the modified acr (a to d) and acg (e to h) promoters under different culture conditions, which include Hi.Shk (a and e), Hi.Std (b and f), Lo.Shk (c and g), and Lo.Std (d and h) environments. An 18-bp random sequence was used to sequentially replace the regions upstream of the acr and acg ORFs. The hashed bars are mutant promoters in which the 18-bp conserved palindromic ACG motif regions (9) have been replaced. The data presented are representative of three independent experiments each assayed for β-galactosidase activity in triplicate. The error bars denote standard deviations.
Maximum reduction of acr expression (∼100-fold) was observed with the loss of motif M3, which is closest to the TSP. Replacement of the acr M1 sequence, which is farthest from the TSP, resulted in only a 2- to 10-fold decrease, while M2 replacement resulted in an intermediate (>10-fold) decrease in β-galactosidase expression under each of the three conditions. However, the M2 region had its biggest effect under low-oxygen conditions in both shaking and standing cultures (Fig. 5b to d). In the case of acg, the motif copy closest to the acg start site (M1) had the greatest effect on promoter activity, with expression levels reduced to the background level under all conditions in its absence. However, replacement of the M2 region resulted in a >10-fold reduction while replacement of the more distal M3 region resulted in an up-to-20-fold decrease in promoter activity (Fig. 5f to h).
Surprisingly, regions M0 and SR5 were also found to have significant, but contrasting, effects on promoter activity. Replacement of the M0 region between motif copies M1 and M2 also decreased promoter activity 10-fold (acr) or 100-fold (acg). In contrast, loss of the SR5 region between +2 and +19 in the acr 5′ UTR resulted in an ∼10-fold increase in promoter activity over the usual levels of induction under activating conditions (Fig. 5b to d). The same SR5 sequence replacement (−169 to −133 of the TSP), which constituted the most upstream region of the acg promoter, also resulted in approximately six- to eightfold increased acg activity under all three inducing conditions (Fig. 5f to h). These SR5 analyses were repeated with a second replacement sequence to ensure that the initial replacement sequence used for sequence substitution did not contribute to the regulation of promoter activity. Similar results were observed with the second sequence (data not shown), confirming that the random sequence that was used did not contribute to the observed changes in promoter activity.
The substitution of other nonmotif or substituted regions (SRs) that are not predicted to contain either −10 or −35 promoter sequences had very little impact on the activity of either promoter. Replacement of SR3 (acr) or SR2 (acg), harboring the respective −35 sequences for each gene, resulted in up-to-sevenfold decreases in promoter activity. Replacement of SR4 in acr, which harbored the probable −10 sequence, reduced acr promoter activity considerably (∼10- to 100-fold, depending on the conditions). However, replacement of the probable −10 region (SR1) in acg had little effect on acg promoter function. The activities of these modified acr and acg promoters relative to that of the WT are summarized in Table 1.
TABLE 1.
Percent substituted promoter activity relative to WT expression
| Promoter and regiona | % Activityb
|
|||
|---|---|---|---|---|
| Hi.Shk | Hi.Std | Lo.Shk | Lo.Std | |
| WT acr | 0.06 | 91.60 | 19.67 | 81.53 |
| SR1 | Bg | 72 | 214 | 63 |
| SR2 | Bg | 77 | 138 | 35 |
| M1 | Bg | 23 | 25 | 8 |
| M0 | Bg | 28 | 17 | 5 |
| M2 | Bg | 6 | 2 | 1 |
| M3 | Bg | 1 | 2 | 1 |
| SR3 | Bg | 61 | 83 | 58 |
| SR4 | Bg | 7 | 9 | 1 |
| SR5 | Bg | 977 | 2,484 | 1,013 |
| WT acg | 0.17 | 146.88 | 25.46 | 62.97 |
| SR5 | Bg | 623 | 250 | 411 |
| SR4 | Bg | 170 | 182 | 95 |
| SR3 | Bg | 80 | 61 | 64 |
| M3 | Bg | 1 | 2 | 0 |
| M2 | Bg | 4 | 3 | 5 |
| M0 | Bg | 0 | 5 | 1 |
| M1 | Bg | 0 | 1 | 1 |
| SR2 | Bg | 34 | 36 | 24 |
| SR1 | Bg | 66 | 261 | 88 |
All values are presented relative to the WT M. tuberculosis acr or acg promoter sequence. SRs are as defined in the text. Regions in boldface correspond to specific ACG motif copy replacements.
Conditions were as described in the text. Only ACG-inducing conditions are shown, as all promoter levels were at background (Bg) under the noninducing, shaking, high-oxygen conditions.
Effect of 18-bp motif substitution on ACG promoter activity.
On the basis of these initial observations with acr and acg, we extended our study to assess the roles of motif regions in other members of the ACG family. The 18-bp ACG motif regions identified in the promoters of narK2, Rv1738, and Rv2623 were replaced with the random sequence, and the effects of these base substitutions on the promoter activities were evaluated by assaying β-galactosidase activity under different culture conditions.
Both ACG motif copies (M1 and M2) were essential for the activity of the Rv2623 promoter. Replacement of either DNA sequence caused an ∼100-fold decrease in promoter activity, reducing expression to background levels under each condition examined (Fig. 6e). In contrast, loss of ACG motif sequences other than M3 in narK2 had relatively little impact on either narK2 or Rv1738 promoter activity. Replacement of the narK2 M3 region at positions −41 to −60, which is closest to the TSP, had a significant impact, decreasing narK2 expression >100-fold, down to background levels, under all conditions (Fig. 6c). Loss of motif copy M1 or M2 caused only approximately three- to eightfold decreases under any of the three inducing conditions, with their greatest effects under standing, rather than hypoxic, conditions.
FIG. 6.

Relative expression of the modified ACG promoters, each with the 18-bp conserved palindromic motif region substituted and examined under different culture conditions. Promoters include acr (a), acg (b), narK2 (c), Rv1738 (d), and Rv2623 (e). The motif regions (M1, M2, and M3) were identified in a previous study by using the Gibbs recursive sampler and are predicted DevR-binding sites. The data for motif substitutions in the acr and acg promoters are the same as those shown in Fig. 5. In Rv1738, loss of motif copies resulted in upregulation of promoter activity under shaking high-oxygen conditions, where it is normally repressed (indicated by an arrow). The data presented are representative of three independent experiments each analyzed in triplicate for β-galactosidase activity. The error bars denote standard deviations. The asterisks above the culture conditions (bracketed in the cases of multiple conditions) indicate that the difference between the WT and each of the promoters with a motif substitution was statistically significant (t test for independent samples; *, P = 0.01 to 0.05; **, P = 0.001 to 0.01; ***, P < 0.001).
The effects of ACG motif substitutions on Rv1738 differed from all of the other cases in that the motif copies repressed, rather than activated, transcription. Surprisingly, we found that loss of any of the three ACG motif copies (M1, M2, or M3) in Rv1738 resulted in >10-fold increased promoter activity under ambient shaking conditions, under which the WT promoter is not induced. Rv1738's most proximally located motif, M1, did not affect promoter function under any of the usual inducing conditions, and replacement of its most distal motif, M3, altered expression only under standing conditions, where it caused a 10-fold decrease. The middle motif, M2, situated between −57 and −75, had the most consistent impact on Rv1738 expression. Loss of M2 resulted in up to 13-fold less activation of the modified Rv1738 promoters under each of the three inducing conditions (Fig. 6d).
Role of the 5′ UTR in regulating promoter activity.
As noted, our initial studies with the acr promoter identified a regulatory region in the 5′ UTR. This result is consistent with a previous study on narK2 (19), and we reasoned that a 5′ UTR regulatory region may be common among the ACG promoters. Regions within the 5′ UTRs of other ACG promoters were replaced to assess their roles in gene expression. We found that loss of 5′ UTR sequences caused increased promoter activity under at least one of the culture conditions examined for each gene tested, although the effects varied greatly (Fig. 7A).
FIG. 7.

(A) Relative expression of the WT and 5′ UTR substitution-containing ACG promoters examined under different high- and low-oxygen, shaking and standing culture conditions. Promoters include acr (a), acg (b), narK2 (c), Rv1738 (d), and Rv2623 (e). In the acg and Rv2623 promoters, loss of this region resulted in an increase in promoter activity under shaking high-oxygen conditions (indicated by an arrow). The data presented are representative of three independent experiments, each analyzed in triplicate for β-galactosidase activity. The error bars denote standard deviations. The asterisks above the culture conditions indicate that the difference between the WT and the 5′ UTR substitution-containing (mut-5′UTR) promoters was statistically significant (t test for independent samples; *, P = 0.01 to 0.05; **, P = 0.001 to 0.01; ***, P < 0.001). (B) RT-PCR analyses showing relative expression levels of lacZ mRNA in the WT promoter (column 1) and the 5′ UTR substitution-containing promoter (column 2) in single-copy lacZ fusion BCG strains under noninducing (Hi.Shk) and inducing (Hi.Std) conditions. The cDNA levels were normalized to 23S RNA levels. The data presented are representative of two independent experiments.
Loss of an 18-bp region within the 5′ UTRs of acr and acg resulted in ∼10-fold higher levels of induction under activating conditions compared with those of the WT promoters (Fig. 7A, parts a and b). Similar results were obtained for narK2 and Rv1738, but these effects were observed primarily under standing high-oxygen conditions. The 5′ UTR replacement in Rv2623 did not affect promoter expression under any activating condition, but it caused a dramatic ∼100-fold increase in expression under ambient shaking conditions, where the ACG promoters typically show little or no expression (Fig. 7A, parts b and e). The acg 5′ UTR-modified promoter also showed a high level of promoter induction under ambient shaking conditions.
Semiquantitative RT-PCR was performed to determine whether the mode of 5′ UTR regulation was occurring at the RNA level. Relative mRNA levels were comparable to the β-galactosidase activity levels under the shaking high-oxygen conditions. However, 5′ UTR-associated increases in β-galactosidase activity were not reflected by proportionally higher mRNA levels under ACG-activating standing high-oxygen conditions (Fig. 7B). This suggests that the 5′ UTR-associated regulatory mechanisms under inducing versus noninducing conditions may be different for some genes.
Effect of the upstream promoter regions on β-galactosidase expression.
In some cases, replacement of 5′ UTR sequences also affected the expression of divergently expressed genes. In these cases, the replaced sequences were located within the furthest URR of the promoter regulatory sequences (Fig. 4). Both positive and negative effects were observed, depending on the promoter. Expression of the divergently transcribed acr and acg genes was negatively affected by these sequence substitutions, while that of narK2 and Rv1738 was positively affected by the loss of these upstream regions (Fig. 8).
FIG. 8.
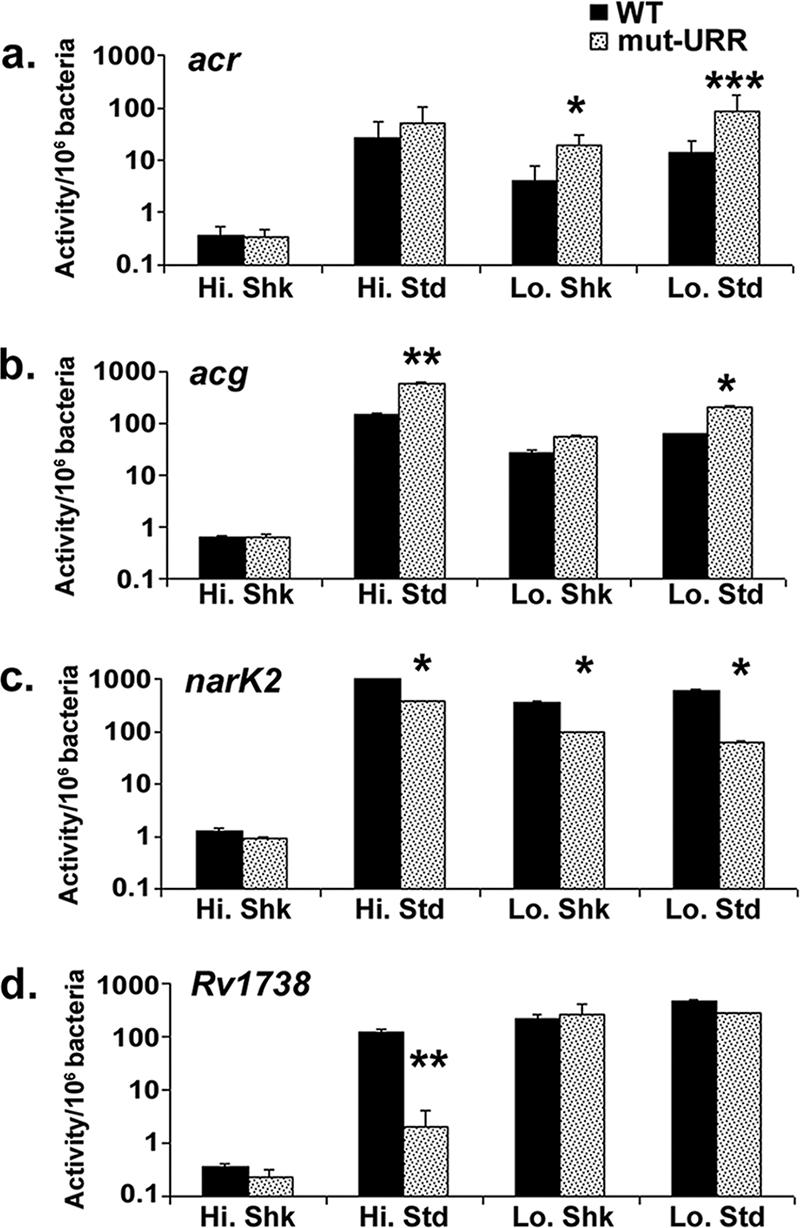
Relative expression of ACG promoters with their 18-bp URR substituted and examined under high- and low-oxygen, shaking and standing culture conditions. Promoters include acr (a), acg (b), narK2 (c), and Rv1738 (d). The upstream sequences were associated with both positive (acr and acg) and negative (narK2 and Rv1738) regulation. The data presented are representative of three independent experiments, each analyzed in triplicate for β-galactosidase activity. The error bars denote standard deviations. The asterisks above the culture conditions indicate that the difference between the WT and the URR substitution-containing (mut-URR) promoters was statistically significant (t test for independent samples; *, P = 0.01 to 0.05; **, P = 0.001 to 0.01; ***, P < 0.001).
The most dramatic effects were observed with Rv1738, in which loss of the far URR resulted in an ∼50-fold decrease in promoter activity under standing high-oxygen conditions but had no effect under other conditions (Fig. 8d). In contrast, substitution of URR sequences between −148 and −166 in acr, or between −169 and −152 in acg, generally increased the activity of these promoters ∼3- to 10-fold under activating conditions (Fig. 8a and b).
Mapping of DevR-binding sites by DNase I footprinting.
The reporter fusion studies identified several DNA sequences other than the predicted DevR-binding sites that affected gene expression. A DNase I footprinting analysis was performed on the acr-acg intergenic region to confirm the predicted DevR-binding sites and assess the possible interaction of DevR with these newly identified regulatory sequences (Fig. 9). The 216-bp acr-acg intergenic sequence was labeled, and binding reaction were performed with various concentrations of DevR prior to digestion with DNase I. DevR protected all three predicted 18-bp palindromic motif regions, M1, M2, and M3. The sequence of each individual motif and its specific location are shown in Fig. 3. Binding in the M1 region extends to a few bases beyond the predicted sequence in both directions. M0 was not protected by DevR, other than the nucleotides immediately adjacent to the M1 region. In addition, the M0 region appears to be a hypersensitive cleavage site in the presence or absence of DevR. Neither of the other two regulatory regions identified in this study, including the 5′ UTR and URR, showed any protection by DevR.
FIG. 9.

DNase I footprinting of DevR-binding sites in the acr-acg intergenic region. The −216/+1 DNA region upstream of the acr translational start site was labeled at −216 and then subjected to DNase I digestion in the presence of 20 μM (lane 1), 15 μM (lane 2), or 0 μM (lane 3) DevR. A dideoxynucleotide sequencing ladder (C, T, G, A) run in parallel with the footprinting reactions was used to determine the sequence of the protected region. Black bars mark the regions protected and not protected by DevR. DevR protects the predicted 18-bp palindromic motif regions, M1, M2, and M3 (regions underlined by thick lines in Fig. 3), while M0 appears to be the hypersensitive site. The 5′ UTR and URR, which are the additional regulatory regions identified in this study, do not show any DevR binding.
DISCUSSION
This study provides the most detailed analysis to date of the role of cis regulatory sequences in the regulation of five ACG family members from the DevR regulon, including acr, acg, narK2, Rv1738, and Rv2623. We found that these genes are subjected to multiple levels of both positive and negative regulation in response to hypoxic and/or shallow standing conditions. DNA sequences located both upstream and downstream of the TSPs contribute to the overall expression of these genes (Fig. 10), and there was more intergenic variability than expected in the gene regulatory patterns. These data indicate that, rather than being a homogeneous set of coordinately regulated genes, the DevR regulon is composed of a potentially complex assortment of genes from several intersecting regulatory networks. Recent studies also report the induction of DevR regulon genes in response to other stress conditions, including SDS (22, 29), carbon monoxide (20, 25, 42a), and low pH (38). Characterization of the genetic factors involved in these regulation mechanisms clearly warrants further study and is needed to decipher the relationship of DevR to other overlapping regulators.
FIG. 10.
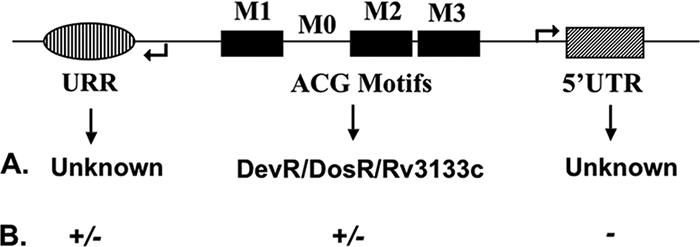
The important cis-acting regulatory regions identified in the subset of ACG promoters and their regulatory roles are summarized. The motif regions (M1, M2, and/or M3, solid black) are DevR-binding sites, while M0 is the additional region important for regulation. The regulators binding to the distal (URR, hashed) and proximal ends (5′ UTR, striped) of the promoter are not known. A, regulator; B, regulation observed.
Use of a single-copy reporter system in this study reduced the likelihood of artifacts associated with transcription factor titration that can cause some promoters to regulate poorly on multicopy plasmids (44). This may be an issue for some ACGs under standing low-oxygen conditions, the only conditions under which the WT regulatory trends observed in this study were not fully apparent in our previous multicopy reporter study (9). In this case, the regulatory effects of two conditions, i.e., hypoxia and static growth, appear to be additive for some genes only when assayed with single-copy reporters (Fig. 1).
Multiple TSPs in ACG members.
Multiple TSPs were identified in Rv2623 and acg, but in each case all were within several nucleotides of one another. Two closely spaced TSPs have also been reported for acr, but in this case, each of two groups identified single start sites at different positions (17, 31). The presence of multiple TSPs is fairly common for mycobacterial genes, but its significance is not clear (2, 7, 23, 27, 40). Different TSPs are sometimes used to differentially regulate gene expression under different growth conditions. However, we saw no differences in the TSP usage of acg or Rv2623 under the different conditions assessed in this study (data not shown). The lack of effect associated with the deletion of regions harboring the −35 sequences for the acr and acg promoters indicates that these sequences are not essential for gene expression under the conditions tested. This is also not unusual for mycobacterial genes, as several other promoters that do not require a −35 region for activity have been reported (21, 23, 37).
The spacing between the −10 and −35 regions observed for the promoters examined in the present study was between 14 and 20 bp, which is within the range reported for other mycobacterial promoters. It has been noted by others that the distance between the −10 and −35 regions is not critical in mycobacterial promoters (24) and varies between 13 and 24 bp (12, 27, 35). In contrast, the spacing between the −10 and −35 regions in most E. coli promoters is 17 ± 1 bp (16).
Loss of the predicted −10 region reduced acr expression ∼10- to 100-fold, depending on the conditions, but had very little effect on acg expression. A second potential −10 region (CACGAT) located immediately upstream of the reported −10 sequence (17) may explain the residual activity for acr. It is more difficult to identify a substitute −10 sequence for acg in the absence of the predicted site within the SR1 region, but the presence of such a sequence cannot be excluded. Nonetheless, these results are consistent with a previous report on one of the other ACG promoters, narK2, where deletion of the region including the 5′ UTR and the −10 sequence caused no loss of promoter activity (19). Additional studies are needed to better define the nature of these −10 sequences and establish their importance to these promoters.
Role of 18-bp palindromic ACG motif copies in gene regulation.
Proximity to the TSP was the most important determinant of motif function in acr and narK2. In these cases, the motif closest to the TSP was critical for gene activation while the more distant copies had moderate (acr) to negligible (narK2) impacts on expression. In contrast, the proximity of the motifs to the TSP was not predictive of their importance for acg or Rv2623 expression, as both promoters had extremely reduced levels of expression when any of the motifs was missing. We had previously used a computational approach to identify three shared copies of the ACG motif (M1, M2, and M3) within the acr and acg promoters (9). However, the M2 copy was not predicted by another group using a different algorithm to detect potential regulatory motifs (31). The present results support our prediction of M2 as a functional motif, as it contributed to the positive regulation of both the acr and acg promoters (Fig. 5 and 6). Protection by DevR in the footprint assay further indicates that DevR interacts with this DNA region (Fig. 9).
The most proximal motif copy was centered ∼34 nucleotides from a TSP for nearly all of the genes examined, and future studies are needed to determine whether this spacing is important for ACG motif function. Activators tend to bind predominantly to positions between −80 and −30 (32). Impaired interaction of DevR with the sigma subunit of RNA polymerase (RNAP) could contribute to loss of promoter activity in the absence of a proximal motif copy. Loss of a distal motif copy could also reduce DevR binding cooperativity or alter the structural conformation of the promoter, making the promoter elements more or less accessible to the RNAP complex. This could result in either hyperinduction of Rv1738 promoter activity or loss of Rv2623 and acg promoter activities. Transcriptional activators can also function by bending or looping of the promoter DNA sequences to facilitate transcription initiation by RNAP (33), and this type of mechanism may be important in cases such as acg, in which more distal ACG motif copies affected promoter activity.
Surprisingly, loss of the M0 region, which separates the two predicted DevR-binding sites, M1 and M2, in the acr and acg promoters, also had a significant effect on promoter activity. This region may contribute to changes in DNA conformation that affect gene expression. M0's hypersensitivity to DNase cleavage and general lack of protection by DevR are most consistent with a structural role for this region. However, extension into this region of DevR binding from the M1 site, or that of another transcription factor, could also contribute to its importance. The C-terminal structure of DosR shows that the protein binds as a tetramer and causes bending of the DNA (50). Tetrameric, or hexameric, binding of DevR is consistent with cooperative binding of DevR to the acr or acg M1, M2, and M3 motif regions, with the M0 region facilitating bending of the DNA. DevR binding to motifs M1 and M2 could maintain the promoter in the bent conformation, while the subunit bound to the motif region closest to the TSP (M1 or M3) could interact with the RNAP to promote transcription. However, significant differences between the acr-acg and narK2-Rv1738 promoter pairs with respect to the importance of their motif copies argues against using this straightforward positional DevR-binding model as a general paradigm for the regulatory function of DevR. Like acr and acg, narK2 and Rv1738 are divergently transcribed and have three similarly distributed motif copies but the patterns of activity between the motif replacement reporters for acr-acg and narK2-Rv1738 differed greatly. The relative importance of specific motifs was also dependent upon culture conditions, further indicating that the role of DevR may vary greatly among different promoters, and may be affected by competing regulatory factors. Future studies are clearly needed to address these mechanistic issues.
Motif function in Rv1738 was an exceptional case, in that loss of ACG motif copies increased gene expression under nonactivating conditions. DevR itself could be functioning as a repressor, as it has been reported to repress the activity of the Rv3134c promoter under aerobic conditions (2). Other M. tuberculosis response regulators with dual activator and repressor functions have been reported, including PhoR, which also autoregulates the expression of the phoR operon (15). However, we think it more likely that an additional transcriptional regulator binds to DNA sequences that overlap these ACG motif copies to negatively regulate gene expression. Preliminary studies indicating that ACG-associated repression of Rv1738 expression is independent of DevR are most consistent with the presence of a second regulatory factor (H. M. Vasudeva-Rao and K. A. McDonough, unpublished data). The recent study demonstrating the role of DevS/DosS and DosT as the primary sensors of redox and hypoxic conditions (20, 25, 42a) further emphasizes the need to redefine the role of these important regulators, in addition to identifying new factors.
Multiple levels of ACG promoter regulation.
Replacement of DNA sequences within the 5′ UTRs of several genes resulted in significantly increased promoter activity under at least one of the conditions examined in the present study. These observations are consistent with reports by others indicating a regulatory effect associated with the 5′ UTRs of the narK2 and iniBAC genes (1, 19). The upregulated expression we observed with the 5′ UTR deletion-containing reporters under the typically noninducing aerobic (shaking, high-oxygen) conditions is similar to the dysregulation recently reported for several other ACGs in Beijing lineage M. tuberculosis strains (36). It has been suggested that this dysregulated expression of genes in the DevR regulon contributes to the enhanced transmissibility and drug resistance of these Beijing strains (36). Studies to explore the relevance of this 5′ UTR-associated regulation to the Beijing strains are currently under way.
RNA levels corresponded to the β-galactosidase activity levels in the 5′ UTR mutant promoters under the typically noninducing shaking high-oxygen conditions but not under the ACG-inducing standing high-oxygen conditions (Fig. 7B). This indicates the presence of multiple regulatory mechanisms associated with these 5′ UTRs and suggests that these mechanisms are likely to function at both the transcriptional and translational levels. The presence of multiple regulatory mechanisms is consistent with the presence of different classes of 5′ UTR-associated gene dysregulation, i.e., during ACG-inducing (acr, acg, narK2, and Rv1738) or non-ACG-inducing (acg, Rv2623) conditions. In addition, others have reported different kinetics for Acr protein and mRNA expression levels (17), indicating that Acr expression is regulated at multiple levels.
Further study is needed to determine the mechanistic role(s) of the 5′ UTR in ACG regulation. In addition to causing repression via steric hindrance of RNAP binding to the promoter, repressors can bind to the 5′ UTR to cause DNA looping that shuts off transcription initiation (5, 14). It is not clear whether the observed 5′ UTR-associated repression is caused by a repressor binding to this region or by a structural alteration that stabilizes promoter sequences. However, the DNase I footprinting assay indicates that DevR binding at this site is not likely to occur (Fig. 9). Additional effects on mRNA stability and/or translational efficiency may also be important (6, 8).
Surprisingly, DNA sequences within the far URRs exerted both activating and repressing effects on ACG promoters. Deletion of upstream sequences within the acr and acg URRs enhanced promoter activity, suggesting that a repressor-binding site was removed. In contrast, a similar deletion reduced the promoter activity of Rv1738 and narK2, consistent with the presence of an activator-binding site in this region. The latter result is consistent with the results of others, who also observed a decrease in narK2 or katG promoter activity upon the deletion of its upstream region (19, 27). The lack of DevR protection in this region indicates that factors other than DevR are most likely to be involved (Fig. 9). Further studies are needed to better define these newly identified levels of ACG regulation.
These studies indicate that members of the DevR regulon are regulated at multiple levels, which likely include both DevR-dependent and -independent mechanisms. Further studies are needed to identify the trans-acting factors associated with these DevR-independent regulatory mechanisms and to assess their interactions with DevR-mediated regulation. Variations in the regulatory patterns among this limited set of ACG family promoters suggests that the DevR regulon is composed of a heterogeneous group of genes that are capable of responding to multiple overlapping environmental signals. We expect that the characterization of these overlapping regulatory pathways will be a productive area of future investigation that provides insight into the means by which M. tuberculosis adapts to the changing environments it encounters within the host during infection.
Supplementary Material
Acknowledgments
We acknowledge the Wadsworth Center Molecular Genetics Core facility for DNA sequencing support and greatly appreciate the valuable technical assistance provided by Damen Schaak and Eric Smith. We also thank Guangchun Bai and Amanda Pendleton for critical review of the manuscript.
This work was supported in part by National Institutes of Health grant AI4565801 (K.A.M.) and the Potts Memorial Foundation (H.M.V.-R.).
Editor: V. J. DiRita
Footnotes
Published ahead of print on 7 April 2008.
Supplemental material for this article may be found at http://iai.asm.org/.
REFERENCES
- 1.Alland, D., A. J. Steyn, T. Weisbrod, K. Aldrich, and W. R. Jacobs, Jr. 2000. Characterization of the Mycobacterium tuberculosis iniBAC promoter, a promoter that responds to cell wall biosynthesis inhibition. J. Bacteriol. 1821802-1811. [DOI] [PMC free article] [PubMed] [Google Scholar]
- 2.Bagchi, G., S. Chauhan, D. Sharma, and J. S. Tyagi. 2005. Transcription and autoregulation of the Rv3134c-devR-devS operon of Mycobacterium tuberculosis. Microbiology 1514045-4053. [DOI] [PubMed] [Google Scholar]
- 3.Bai, G., M. A. Gazdik, D. D. Schaak, and K. A. McDonough. 2007. The Mycobacterium bovis BCG cyclic AMP receptor-like protein is a functional DNA binding protein in vitro and in vivo, but its activity differs from that of its M. tuberculosis ortholog, Rv3676. Infect. Immun. 755509-5517. [DOI] [PMC free article] [PubMed] [Google Scholar]
- 4.Bai, G., L. A. McCue, and K. A. McDonough. 2005. Characterization of Mycobacterium tuberculosis Rv3676 (CRPMt), a cyclic AMP receptor protein-like DNA binding protein. J. Bacteriol. 1877795-7804. [DOI] [PMC free article] [PubMed] [Google Scholar]
- 5.Browning, D. F., and S. J. Busby. 2004. The regulation of bacterial transcription initiation. Nat. Rev. Microbiol. 257-65. [DOI] [PubMed] [Google Scholar]
- 6.Derrigo, M., A. Cestelli, G. Savettieri, and I. Di Liegro. 2000. RNA-protein interactions in the control of stability and localization of messenger RNA (review). Int. J. Mol. Med. 5111-123. [PubMed] [Google Scholar]
- 7.Dhandayuthapani, S., M. Mudd, and V. Deretic. 1997. Interactions of OxyR with the promoter region of the oxyR and ahpC genes from Mycobacterium leprae and Mycobacterium tuberculosis. J. Bacteriol. 1792401-2409. [DOI] [PMC free article] [PubMed] [Google Scholar]
- 8.Diwa, A., A. L. Bricker, C. Jain, and J. G. Belasco. 2000. An evolutionarily conserved RNA stem-loop functions as a sensor that directs feedback regulation of RNase E gene expression. Genes Dev. 141249-1260. [PMC free article] [PubMed] [Google Scholar]
- 9.Florczyk, M. A., L. A. McCue, A. Purkayastha, E. Currenti, M. J. Wolin, and K. A. McDonough. 2003. A family of acr-coregulated Mycobacterium tuberculosis genes shares a common DNA motif and requires Rv3133c (dosR or devR) for expression. Infect. Immun. 715332-5343. [DOI] [PMC free article] [PubMed] [Google Scholar]
- 10.Florczyk, M. A., L. A. McCue, R. F. Stack, C. R. Hauer, and K. A. McDonough. 2001. Identification and characterization of mycobacterial proteins differentially expressed under standing and shaking culture conditions, including Rv2623 from a novel class of putative ATP-binding proteins. Infect. Immun. 695777-5785. [DOI] [PMC free article] [PubMed] [Google Scholar]
- 11.Gazdik, M. A., and K. A. McDonough. 2005. Identification of cyclic AMP-regulated genes in Mycobacterium tuberculosis complex bacteria under low-oxygen conditions. J. Bacteriol. 1872681-2692. [DOI] [PMC free article] [PubMed] [Google Scholar]
- 12.Gopaul, K. K., P. C. Brooks, J. F. Prost, and E. O. Davis. 2003. Characterization of the two Mycobacterium tuberculosis recA promoters. J. Bacteriol. 1856005-6015. [DOI] [PMC free article] [PubMed] [Google Scholar]
- 13.Gordillo, S., E. Guirado, O. Gil, J. Diaz, I. Amat, S. Molinos, C. Vilaplana, V. Ausina, and P. J. Cardona. 2006. Usefulness of acr expression for monitoring latent Mycobacterium tuberculosis bacilli in ‘in vitro’ and ‘in vivo’ experimental models. Scand. J. Immunol. 6430-39. [DOI] [PubMed] [Google Scholar]
- 14.Gralla, J. D. 1996. Global steps during initiation by RNA polymerase II. Methods Enzymol. 27399-110. [DOI] [PubMed] [Google Scholar]
- 15.Gupta, S., A. Sinha, and D. Sarkar. 2006. Transcriptional autoregulation by Mycobacterium tuberculosis PhoP involves recognition of novel direct repeat sequences in the regulatory region of the promoter. FEBS Lett. 580 5328-5338. [DOI] [PubMed] [Google Scholar]
- 16.Harley, C. B., and R. P. Reynolds. 1987. Analysis of E. coli promoter sequences. Nucleic Acids Res. 152343-2361. [DOI] [PMC free article] [PubMed] [Google Scholar]
- 17.Hu, Y., and A. R. Coates. 1999. Transcription of the stationary-phase-associated hspX gene of Mycobacterium tuberculosis is inversely related to synthesis of the 16-kilodalton protein. J. Bacteriol. 1811380-1387. [DOI] [PMC free article] [PubMed] [Google Scholar]
- 18.Hu, Y., F. Movahedzadeh, N. G. Stoker, and A. R. M. Coates. 2006. Deletion of the Mycobacterium tuberculosis α-crystallin-like hspX gene causes increased bacterial growth in vivo. Infect. Immun. 74861-868. [DOI] [PMC free article] [PubMed] [Google Scholar]
- 19.Hutter, B., and T. Dick. 2000. Analysis of the dormancy-inducible narK2 promoter in Mycobacterium bovis BCG. FEMS Microbiol. Lett. 188141-146. [DOI] [PubMed] [Google Scholar]
- 20.Ioanoviciu, A., E. T. Yukl, P. Moenne-Loccoz, and P. R. de Montellano. 2007. DevS, a heme-containing two-component oxygen sensor of Mycobacterium tuberculosis. Biochemistry 464250-4260. [DOI] [PMC free article] [PubMed] [Google Scholar]
- 21.Keilty, S., and M. Rosenberg. 1987. Constitutive function of a positively regulated promoter reveals new sequences essential for activity. J. Biol. Chem. 2626389-6395. [PubMed] [Google Scholar]
- 22.Kendall, S. L., F. Movahedzadeh, S. C. Rison, L. Wernisch, T. Parish, K. Duncan, J. C. Betts, and N. G. Stoker. 2004. The Mycobacterium tuberculosis dosRS two-component system is induced by multiple stresses. Tuberculosis (Edinburgh) 84247-255. [DOI] [PubMed] [Google Scholar]
- 23.Kenney, T. J., and G. Churchward. 1996. Genetic analysis of the Mycobacterium smegmatis rpsL promoter. J. Bacteriol. 1783564-3571. [DOI] [PMC free article] [PubMed] [Google Scholar]
- 24.Kremer, L., A. Baulard, J. Estaquier, J. Content, A. Capron, and C. Locht. 1995. Analysis of the Mycobacterium tuberculosis 85A antigen promoter region. J. Bacteriol. 177642-653. [DOI] [PMC free article] [PubMed] [Google Scholar]
- 25.Kumar, A., J. C. Toledo, R. P. Patel, J. R. Lancaster, Jr., and A. J. Steyn. 2007. Mycobacterium tuberculosis DosS is a redox sensor and DosT is a hypoxia sensor. Proc. Natl. Acad. Sci. USA 10411568-11573. [DOI] [PMC free article] [PubMed] [Google Scholar]
- 26.Mulder, M. A., H. Zappe, and L. M. Steyn. 1997. Mycobacterial promoters. Tuber. Lung Dis. 78211-223. [DOI] [PubMed] [Google Scholar]
- 27.Mulder, M. A., H. Zappe, and L. M. Steyn. 1999. The Mycobacterium tuberculosis katG promoter region contains a novel upstream activator. Microbiology 145(Pt. 9)2507-2518. [DOI] [PubMed] [Google Scholar]
- 28.Ohno, H., G. Zhu, V. P. Mohan, D. Chu, S. Kohno, W. R. Jacobs, Jr., and J. Chan. 2003. The effects of reactive nitrogen intermediates on gene expression in Mycobacterium tuberculosis. Cell. Microbiol. 5637-648. [DOI] [PubMed] [Google Scholar]
- 29.Pang, X., P. Vu, T. F. Byrd, S. Ghanny, P. Soteropoulos, G. V. Mukamolova, S. Wu, B. Samten, and S. T. Howard. 2007. Evidence for complex interactions of stress-associated regulons in an mprAB deletion mutant of Mycobacterium tuberculosis. Microbiology 1531229-1242. [DOI] [PubMed] [Google Scholar]
- 30.Parish, T., and N. G. Stoker. 1998. Electroporation of mycobacteria. Methods Mol. Biol. 101129-144. [DOI] [PubMed] [Google Scholar]
- 31.Park, H. D., K. M. Guinn, M. I. Harrell, R. Liao, M. I. Voskuil, M. Tompa, G. K. Schoolnik, and D. R. Sherman. 2003. Rv3133c/dosR is a transcription factor that mediates the hypoxic response of Mycobacterium tuberculosis. Mol. Microbiol. 48833-843. [DOI] [PMC free article] [PubMed] [Google Scholar]
- 32.Pérez-Rueda, E., J. D. Gralla, and J. Collado-Vides. 1998. Genomic position analyses and the transcription machinery. J. Mol. Biol. 275165-170. [DOI] [PubMed] [Google Scholar]
- 33.Ptashne, M., and A. Gann. 1997. Transcriptional activation by recruitment. Nature 386569-577. [DOI] [PubMed] [Google Scholar]
- 34.Purkayastha, A., L. A. McCue, and K. A. McDonough. 2002. Identification of a Mycobacterium tuberculosis putative classical nitroreductase gene whose expression is coregulated with that of the acr gene within macrophages, in standing versus shaking cultures, and under low oxygen conditions. Infect. Immun. 701518-1529. [DOI] [PMC free article] [PubMed] [Google Scholar]
- 35.Ramesh, G., and K. P. Gopinathan. 1995. Cloning and characterization of mycobacteriophage I3 promoters. Indian J. Biochem. Biophys. 32361-367. [PubMed] [Google Scholar]
- 36.Reed, M. B., S. Gagneux, K. Deriemer, P. M. Small, and C. E. Barry III. 2007. The W-Beijing lineage of Mycobacterium tuberculosis overproduces triglycerides and has the DosR dormancy regulon constitutively upregulated. J. Bacteriol. 1892583-2589. [DOI] [PMC free article] [PubMed] [Google Scholar]
- 37.Roberts, E. A., A. Clark, S. McBeth, and R. L. Friedman. 2004. Molecular characterization of the eis promoter of Mycobacterium tuberculosis. J. Bacteriol. 1865410-5417. [DOI] [PMC free article] [PubMed] [Google Scholar]
- 38.Rohde, K., R. M. Yates, G. E. Purdy, and D. G. Russell. 2007. Mycobacterium tuberculosis and the environment within the phagosome. Immunol. Rev. 21937-54. [DOI] [PubMed] [Google Scholar]
- 39.Rowland, B., A. Purkayastha, C. Monserrat, Y. Casart, H. Takiff, and K. A. McDonough. 1999. Fluorescence-based detection of lacZ reporter gene expression in intact and viable bacteria including Mycobacterium species. FEMS Microbiol. Lett. 179317-325. [DOI] [PubMed] [Google Scholar]
- 40.Roy, S., and P. Ajitkumar. 2005. Transcriptional analysis of the principal cell division gene, ftsZ, of Mycobacterium tuberculosis. J. Bacteriol. 1872540-2550. [DOI] [PMC free article] [PubMed] [Google Scholar]
- 41.Schnappinger, D., S. Ehrt, M. I. Voskuil, Y. Liu, J. A. Mangan, I. M. Monahan, G. Dolganov, B. Efron, P. D. Butcher, C. Nathan, and G. K. Schoolnik. 2003. Transcriptional adaptation of Mycobacterium tuberculosis within macrophages: insights into the phagosomal environment. J. Exp. Med. 198693-704. [DOI] [PMC free article] [PubMed] [Google Scholar]
- 42.Sherman, D. R., M. Voskuil, D. Schnappinger, R. Liao, M. I. Harrell, and G. K. Schoolnik. 2001. Regulation of the Mycobacterium tuberculosis hypoxic response gene encoding α-crystallin. Proc. Natl. Acad. Sci. USA 987534-7539. [DOI] [PMC free article] [PubMed] [Google Scholar]
- 42a.Sousa, E. H., J. R. Tuckerman, G. Gonzalez, and M. A. Gilles-Gonzalez. 2007. DosT and DevS are oxygen-switched kinases in Mycobacterium tuberculosis. Protein Sci. 161708-1719. [DOI] [PMC free article] [PubMed] [Google Scholar]
- 43.Stewart, J. N., H. N. Rivera, R. Karls, F. D. Quinn, J. Roman, and C. A. Rivera-Marrero. 2006. Increased pathology in lungs of mice after infection with an α-crystallin mutant of Mycobacterium tuberculosis: changes in cathepsin proteases and certain cytokines. Microbiology 152233-244. [DOI] [PubMed] [Google Scholar]
- 44.Stover, C. K., V. F. de la Cruz, T. R. Fuerst, J. E. Burlein, L. A. Benson, L. T. Bennett, G. P. Bansal, J. F. Young, M. H. Lee, G. F. Hatfull, et al. 1991. New use of BCG for recombinant vaccines. Nature 351456-460. [DOI] [PubMed] [Google Scholar]
- 45.Timm, J., E. M. Lim, and B. Gicquel. 1994. Escherichia coli-mycobacteria shuttle vectors for operon and gene fusions to lacZ: the pJEM series. J. Bacteriol. 1766749-6753. [DOI] [PMC free article] [PubMed] [Google Scholar]
- 46.Verbon, A., R. A. Hartskeerl, C. Moreno, and A. H. Kolk. 1992. Characterization of B cell epitopes on the 16K antigen of Mycobacterium tuberculosis. Clin. Exp. Immunol. 89395-401. [DOI] [PMC free article] [PubMed] [Google Scholar]
- 47.Voskuil, M. I., D. Schnappinger, K. C. Visconti, M. I. Harrell, G. M. Dolganov, D. R. Sherman, and G. K. Schoolnik. 2003. Inhibition of respiration by nitric oxide induces a Mycobacterium tuberculosis dormancy program. J. Exp. Med. 198705-713. [DOI] [PMC free article] [PubMed] [Google Scholar]
- 48.Wayne, L. G., and L. G. Hayes. 1996. An in vitro model for sequential study of shiftdown of Mycobacterium tuberculosis through two stages of nonreplicating persistence. Infect. Immun. 642062-2069. [DOI] [PMC free article] [PubMed] [Google Scholar]
- 49.Wayne, L. G., and C. D. Sohaskey. 2001. Nonreplicating persistence of Mycobacterium tuberculosis. Annu. Rev. Microbiol. 55139-163. [DOI] [PubMed] [Google Scholar]
- 50.Wisedchaisri, G., M. Wu, A. E. Rice, D. M. Roberts, D. R. Sherman, and W. G. Hol. 2005. Structures of Mycobacterium tuberculosis DosR and DosR-DNA complex involved in gene activation during adaptation to hypoxic latency. J. Mol. Biol. 354630-641. [DOI] [PubMed] [Google Scholar]
- 51.World Health Organization. 2004. Tuberculosis fact sheet no. 104. World Health Organization, Geneva, Switzerland.
- 52.Yuan, Y., D. D. Crane, and C. E. Barry III. 1996. Stationary phase-associated protein expression in Mycobacterium tuberculosis: function of the mycobacterial α-crystallin homolog. J. Bacteriol. 1784484-4492. [DOI] [PMC free article] [PubMed] [Google Scholar]
- 53.Yuan, Y., D. D. Crane, R. M. Simpson, Y. Q. Zhu, M. J. Hickey, D. R. Sherman, and C. E. Barry III. 1998. The 16-kDa α-crystallin (Acr) protein of Mycobacterium tuberculosis is required for growth in macrophages. Proc. Natl. Acad. Sci. USA 959578-9583. [DOI] [PMC free article] [PubMed] [Google Scholar]
Associated Data
This section collects any data citations, data availability statements, or supplementary materials included in this article.