Abstract
Marijuana cannabinoid treatment increases Th2 activity and previous reports showed B cells express the highest level of CB2 mRNA relative to other immune cells suggesting that cannabinoids play a critical role in B cell activation and maturation. We previously reported evidence of Th2 biasing and class switching in cannabinoid treated and antigen challenged mice. We now explore the possibility that cannabinoids directly influence B cell antibody class switching. Mouse splenic B cells were purified by negative selection and cultured with IL4 and anti-CD40 in the presence or absence of the nonselective cannabinoid agonist, CP55940, or the CB1 selective cannabinoid agonist, methanandamide, and analyzed at different days by flow cytometry for surface expression of either IgM or IgE. Cells treated with CP55940 showed an increase in expression of IgE by day 5 in culture; methanandamide had no effect. CP55940 also induced an increase in secreted IgE in culture supernatants as analyzed by ELISA. In addition, CB2 receptors were increased on B cells following stimulation with IL-4 and anti-CD40 and the class switching effect of CP55940 was attenuated by the CB2 antagonist, SR144528. These results suggest that cannabinoids bias toward Th2-type immunity by directly inducing B cell class switching from IgM to IgE through a mechanism involving CB2 receptors.
Keywords: B lymphocytes, immunoglobulin class switching, cannabinoids, IL-4, CB2
INTRODUCTION
Cannabinoid receptors and ligands have been reported to be produced in cells of the immune system and to regulate immune cell function with immune suppression being a dominant response (Klein, 2005; Klein and Cabral, 2006). B lymphocytes express an abundance of CB2 message relative to other immune cells (Carayon et al., 1998; Lee et al., 2001) and cannabinoids have been shown to increase B cell function rather than suppress it. For example, proliferation of B cells was reported to be increased by cannabinoid agonists (Carayon et al., 1998), CB2 receptors were reported to be increased following IL-4 treatment (Lee et al., 2001), and Th2-type antibody responses to Legionella pneumophila were increased in THC-treated and immune stimulated mice (Newton et al., 1994). In addition, cannabinoids have been reported to polarize toward Th2 immunity in a variety of models and at least a portion of this effect is due to a modulation of T helper cytokines produced by dendritic cells and T cells (Lu et al., 2006). Th2 cytokines such as IL-4 stimulate B cells to undergo immunoglobulin (Ig) heavy chain class switching and thus induce these cells to produce IgE and IgG1 rather than IgM and IgG2a (Takeda et al., 1996). Because we had observed that cannabinoids increased IgG1 and not IgG2a antibodies (Newton et al., 1994) and because IL-4 activity is reported to promote the expression of CB2 mRNA in B cells (Schroder et al., 2002) we examined the possibility that cannabinoids act on B cells directly to induce Ig class switching through a CB2-mediated mechanism. The results show that the non-selective, full cannabinoid agonist, CP55940, increased IgE class switching in cultures of mouse, splenic B cells while the CB1 selective agonist, methanandamide, had no effect. In addition, CB2 receptors were increased on B cells following stimulation with IL-4 and anti-CD40 antibodies and the class switching effect of CP55940 was attenuated by the CB2 antagonist, SR144528. These results suggest that cannabinoids bias toward Th2-type immunity by directly inducing B cell class switching from IgM to IgE through a mechanism involving CB2 receptors.
MATERIALS AND METHODS
Mice and Drugs
C57BL/6 mice, 6-12 weeks of age, were obtained from CB2 breeding colony housed and cared for at the University of South Florida Health Science Center animal facility, which is fully accredited by the American Association for Accreditation of Laboratory Animal Care. CP55940 [(-)-cis-3-[2-Hydroxy-4-(1,1-dimethylheptyl) phenyl]-trans-4-(3-hydroxypropyl) cyclohexanol] and (R)-(+)-Methanandamide [(R)-N-(2-Hydroxy-1-methylethyl)-5Z,8Z,11Z,14Z-icosatetraenamide] were obtained from Tocris Bioscience, Ellisville, MO. The Ki value of CP55940 for both CB1 and CB2 is 1.3 nM. The Ki values of methanandamide for CB1 and CB2 are 20 nM and 815 nM, respectively (Klein et al, 2003). CP55940 was first diluted in 95% ethanol to a concentration of 100 mM and then in 10% fetal calf serum-RPMI 1640 medium to a working concentration of 100 uM. Methanandamide was diluted in ethanol to a concentration of 5 mg/ml and then in 10% fetal calf serum-RPMI 1640 medium to a working concentration of 140 uM. SR141716A and SR144528 were obtained from the Research Technology Branch of the National Institute on Drug Abuse (Rockville, MD) and were first diluted in 95% ethanol to 20 mg/ml and then in 10% fetal calf serum-RPMI 1640 medium to a working concentration of 20 ug/ml.
Preparation of Purified B lymphocytes
Spleens were collected from C57BL/6 male and female mice at 6 to 12 weeks of age, and processed in a Stomacher™ 80 lab blender for single cell suspensions. B cells were enriched by magnetic negative selection (EasySep™ from StemCell Technologies). Isolated B cells were cultured in six-well culture plates (Corning Life sciences, Acton, MA) at a concentration of 5.0 × 10⁵ cells/ml in RPMI 1640 medium supplemented with 5 uM 2-mercaptoethanol, 2 mM L-glutamine, 1% antibiotic/antimycotic solution (Sigma, St. Louis, MO), 10% heat inactivated fetal calf serum (Hyclone; Logan, UT), 0.1 - 10 ng/ml recombinant IL-4 (BD Bioscience PharMingen, San Jose, CA, USA) and 500 ng/ml purified hamster anti-mouse CD40 (BD Bioscience PharMingen). The medium and reagents were replenished every 48 hrs. B cells were harvested after five days in culture and the purity of the cells was determined by flow-cytometry staining using fluorochrome-conjugated monoclonal antibodies (mAbs) to CD19 and CD45R/B220 (BD Bioscience PharMingen). The B cell purity was greater than 98% as analyzed by flow Cytometry on a BD Canto II (BD Bioscience).
Treatment of Purified B lymphocytes
B cell cultures were stimulated with IL-4 (0.1 ng/ml) and anti-CD40 (500ng/ml), and different experimental groups were set up. Stimulated B cells were treated with the CB1 receptor agonist, methanandamide (0.5 or 1 uM), the receptor non-selective agonist, CP55940 (0.5 or 1 uM), or equivalent concentrations of drug diluent, ethanol (ETOH; vehicle control). In studies with antagonists, B cells were pretreated with either the CB1 antagonist, SR141716A (0.1 uM), or the CB2 antagonist, SR144528 (0.1 uM) for 30 minutes prior to CP55940 treatment. B cells were cultured for five days followed by flow cytometry and ELISA analysis.
Cell Surface Marker Analysis by Flow Cytometry
B cell purity was assessed by flow-cytometry staining using fluorochrome-conjugated mAbs to CD19 and CD45R/B220 (BD Bioscience PharMingen). To evaluate the effects of CP55940 and methanandamide on purified B cells, the treated and untreated cells were harvested after five days in culture. Fc receptors on B cells were blocked prior to staining with mouse Fc block, CD16/CD32 (BD Bioscience PharMingen). Cells were stained with fluorochrome-conjugated mAbs (BD Bioscience PharMingen) to surface immunoglobulins such as fluorescein isothiocyanate (FITC)-conjugated anti-IgE and allophycocyanin (APC)-conjugated anti-IgM. Other B cell surface markers were stained with phycoerythrin (PE)-conjugated anti-I-Ab, anti-CD80, or anti-CD23. Cells were incubated at 4° for 30 minutes, and then washed in PBS containing 2% fetal calf serum and fixed in 1% paraformaldehyde. Cells were acquired on a BD Calibur or BD Canto II and analyzed by Cellquest, DIVA or Flowjo software.
Intracellular CB2 Receptor Analysis by Flow Cytometry
To assess the levels of CB2 protein in unstimulated and stimulated B cells, the cells were fluorescent stained before (day 0) and after (day 5) stimulation. Cells were then blocked with mouse Fc block (CD16/CD32) and normal goat serum (Chemicon International, Temecula, CA). In order to stain the CB2 receptor, the cells were fixed and permeabilized with cytofix/cytoperm solution (BD Bioscience) to allow the antibody to enter the cell and bind the peptide mapping to the C-terminus of the mouse CB2 receptor. Intracellular and surface CB2 receptor was stained indirectly in the permeabilized cells with goat anti-mouse CB2 as primary antibody and FITC-conjugated donkey anti-goat IgG as secondary antibody (Santa Cruz Biotechnology, Santa Cruz, CA). According to the manufacturer, the anti-CB2 antibody is raised to a 15-20 amino acid peptide within the last 50 amino acids of the C-terminus. Cells were incubated for 30 minutes on ice with both antibodies, washed, and resuspended in PBS containing 2% fetal calf serum. Cells were acquired on a BD Calibur or BD Canto II and analyzed by Cellquest or Flowjo software.
Detection of Secreted IgE in Culture Supernatants by ELISA
To assess IgE secretion, B cells were stimulated with 0.1 ng/ml recombinant IL-4 and 500ng/ml anti-CD40, and treated with either the CB1 receptor agonist, methanandamide (0.5 and 1 uM), or nonselective agonist, CP55940 (0.5 and 1 uM), or equivalent concentrations of drug diluent, ethanol (ETOH, vehicle control). Supernatants from B cell cultures were collected at five days post-treatment and the levels of secreted IgE in supernatants were measured using BD OptEIA kit (BD Bioscience PharMingen). Ninety-six-well, enzyme immunoassay plates (Corning Life Science), were coated with 50 ul of anti-mouse IgE (100ng/ml) in 0.1 M NaHCO3, pH 9.5, overnight at 4°C. The wells were blocked with 150 ul of 0.5% bovine serum albumin/0.05% Tween 20 in PBS for 1 hr at 37°C. B cell supernatants from cannabinoid treated and untreated cultures or serial dilutions of IgE standards were added and incubated for 2 hrs at 37°C followed by biotinylated detection antibody and streptavidin-horseradish peroxidase (1:250 in 50 ul) for 1 hr at 37°. The wells were washed between each addition. Tetramethyl benzidine (Sigma) substrate was added to the wells and allowed to develop at room temperature for 5-10 min. The reaction was stopped with 1 N sulfuric acid. Results were read at 450nm on an Emax microplate reader (Molecular Devices; Menlo Park, CA). The concentrations of secreted IgE were calculated from standard curves that were done for each plate.
Cell Viability
To assess cell viability, cells were culture as previously described and stained with 7-amino-actinomycin-D (7-AAD) (BD Pharmingen). Viable cells (7-AAD negative) and dead cells (7-AAD positive) were quantitated by flow cytometry.
Statistical Analysis
Comparisons between groups were performed using the two-tailed student’s t test. A value of p < 0.05 was indicative of significance.
RESULTS
Splenic B Cell Phenotype
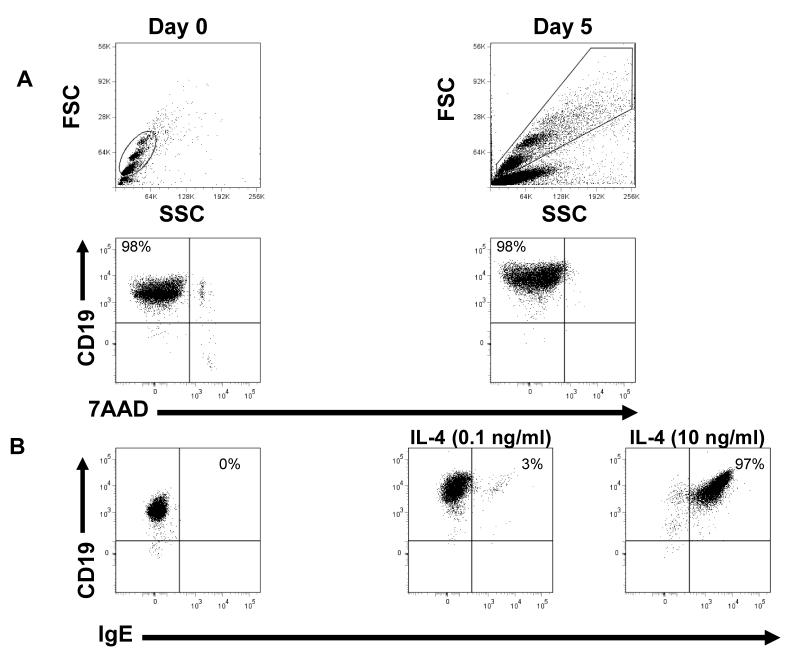
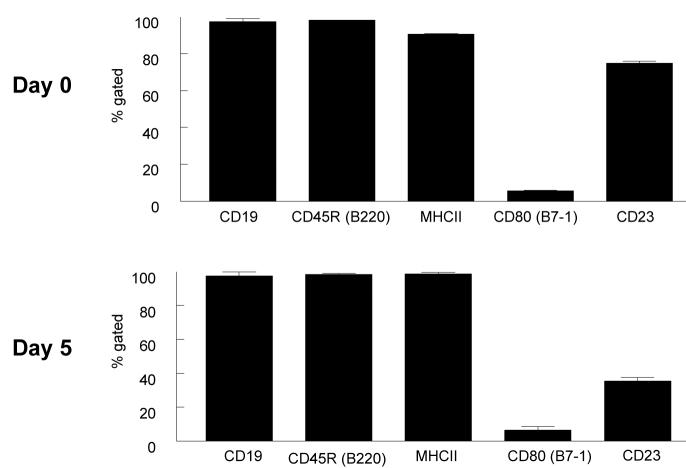
Because cannabinoid receptors have been shown to play an important role in B cell biology, we used primary B cells as our model to study cannabinoid effects and CB2 receptor expression. As previously described, primary cultures of mouse B cells can be induced to proliferate and undergo Ig class switching to IgG1 and IgE under the influence of added anti-CD40 antibody and recombinant IL-4 (Rush et al., 2002). Before testing cannabinoid effects on primary B cells, the cell phenotype was analyzed at different time points in culture. The results in Fig.1A show the scatter characteristics of primary unstimulated B cells at day 0 and stimulated B cells after five days in culture with recombinant IL-4 and anti-CD40. After enrichment, these B cells are >98% CD19 positive, IgE negative, and nearly 100% viable. Viability studies as measured using 7-amino-actinomycin-D (7-AAD) showed that gated CD19 positive B cells were 98% viable at days 0 and 5. B cell characteristics change as the cells are cultured with IL-4 and anti-CD40. At low concentrations of IL-4 (0.1 ng/ml), switching to surface IgE expression occurs at a relatively low level (3%). As the concentration of IL-4 is increased (10ng/ml), IgE surface expression increased dramatically (97%) as shown in Fig.1B. To further analyze B cell characteristics, surface staining for B cell activation markers was performed. Fig.2 shows unstimulated B cells were CD19, CD45, and MHCII positive and they expressed low levels of CD80 and were about 80% positive for CD23. After 5 days in culture, all markers remained the same with the exception of CD23 expression which was decreased substantially to around 40% positive. CD23 is a low affinity receptor for IgE and the significance of the drop in expression of this protein is unclear at this time.
Figure 1. B cell purity and viability.
B cells were enriched by negative selection and purity was assessed by flow cytometry staining with anti-CD19-PE. Scatter graphs for days 0 and 5 show the populations we gated on, which are CD19+ and nearly 100% viable (Fig. 1A). Viability staining with 7-amino-actinomycyn D (7-AAD) shows gated B cells are 98% viable at days 0 and 5. Y-axis represents CD19 and x-axis represents 7AAD. IgE surface expression was assessed by flow cytometry staining with anti-IgE-FITC (Fig. 1B). There is no IgE surface expression on unstimulated B cells, but after five days in culture, IgE levels increased to 3% or 97% as B cells are treated with increasing amounts of IL-4 (0.1 or 10 ng/ml). Y-axis represents CD19 and x-axis represents IgE. 50,000 events were analyzed per sample. Data are representative of 10 different experiments.
Figure 2. B cell phenotype.
Unstimulated (day 0) and stimulated (day 5) B cells were stained with different surface marker antibodies for CD19, CD45, MHC class II, CD80, and CD23, and analyzed by flow cytometry. Data are expressed as percentage (%) of CD19+ B cells. Gated cells are shown in scatter graphs in Fig. 1A. 10,000 events were analyzed per sample. Bars represent standard error of the mean for 3 experiments.
CB2 Receptor Expression on B Cells
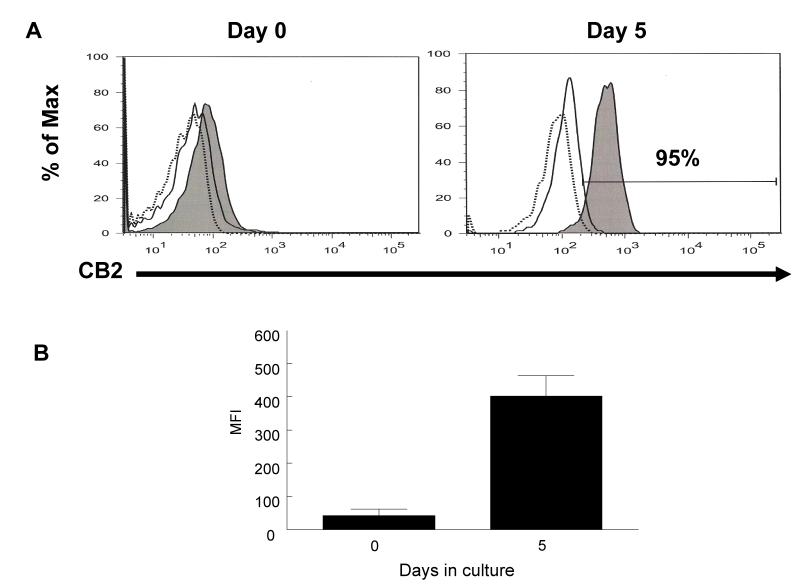
Previous studies showed that among immune cell subtypes, B cells express the highest level of CB2 mRNA (Galieque et al., 1995; Lee et al., 2001). In the current report, B cells were stimulated in culture for 5 days and then harvested, fixed, permeabilized with BD cytofix/cytoperm solution, and analyzed for CB2 protein by flow cytometry using indirect labeling with antibodies to the carboxy end of the receptor. The results show, that CB2 protein expression on B cells changed with B cell activation by IL-4 and anti-CD40 (Fig.3A). CB2 protein expression was very low in unstimulated cells, however, the expression increased substantially after stimulation with IL-4 and anti-CD40. There was also a ten-fold difference in mean fluorescence intensity (MFI) per cell between unstimulated and stimulated cells (Fig.3B). The antibodies used in this study are specific for a CB2 peptide and therefore these results suggest that IL-4 and anti-CD40 can dramatically increase the expression of specific immunoreactive protein on B cells.
Figure 3. CB2 receptor expression in B cells.
Unstimulated and stimulated B cells were stained intracellularly for CB2. Cells were collected at days 0 and 5, blocked with Fc block and normal donkey serum, fixed and permeabilized with BD Cytofix/Cytoperm solution prior to staining with primary goat, anti-mouse CB2 and secondary FITC-conjugated, donkey, anti-goat IgG. Dash line (-----) histogram represents unlabeled cells, solid line histogram (____) represents cells stain with secondary antibody only, and filled histogram represents cells stained with anti-CB2 and secondary antibody. Cells stimulated with IL-4 (3 ng/ml) and anti-CD40 (500ng/ml) for five days are 95% positive for immunoreactive protein (Fig. 3A). 10,000 events were analyzed per sample. Data are representative of 3 different experiments. Lower panel shows mean fluorescence intensity (MFI) of positive cells of three independent experiments. There is a ten-fold difference in mean fluorescence intensity per cell between unstimulated B cells at day 0 and stimulated cells at day 5 (Fig. 3B). Bars represent standard error of the mean for 3 experiments.
CP55940 Enhances Class Switching from IgM to IgE
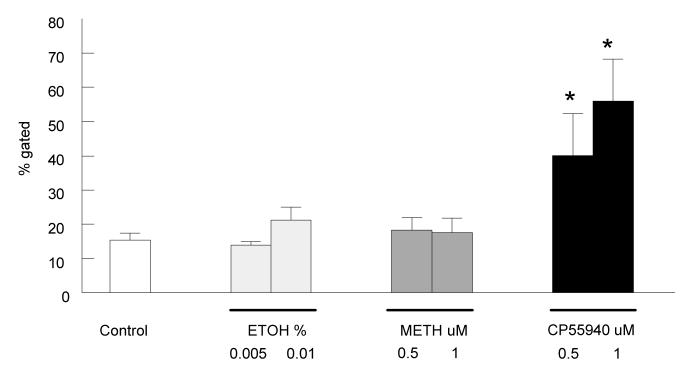
To date no studies have been reported on the effects of cannabinoids on B cell immunoglobulin class switching. Therefore, in the current study we examined the direct effect of the cannabinoid agonists on class switching from IgM to IgE in B cell cultures. B cells were stimulated in culture with IL-4(0.1 ng/ml) and anti-CD40 (500ng/ml), then treated with 0.5 uM or 1 uM CP55940 or methanandamide (Fig. 4). Cells from the control group were untreated, and vehicle control group were treated with equivalent amounts of ethanol. All cells were harvested at day 5 and two-color stained with anti-CD19-PE and anti-IgE-FITC. CD19+ IgE+ B cells were gated and analyzed by flow cytometry. Only B cells treated with CP55940 were shown to have an increase in expression of surface IgE by day 5; treatment with 0.5 uM CP55940 showed a two-fold increase in surface IgE, while treatment with 1uM CP55940 showed a three-fold increase in surface IgE. Methanandamide treated cells had very low levels of surface IgE similar to unlabeled and vehicle controls and in initial studies had not effect at concentrations ranging from 0.1 to 10 μM (data not shown). These results show the non-selective agonist, CP55940, but not the CB1 agonist, methanandamide, directly enhances IgE surface expression on B cells after five days of stimulation with IL-4 and anti-CD40.
Figure 4. CP55940 enhances class switching from IgM to IgE.
B cells were stimulated with IL-4 (0.1ng/ml) and anti-CD40 (500ng/ml) with or without drug treatment for 5 days. B cells were treated with either 0.5 or 1 uM CP55940 or methanandamide, harvested at day five, and surface IgE expression measured by flow cytometry with anti-IgE-FITC. Y-axis shows percentage of gated cells, CD19+IgE+, B cells. Gates are shown on the scatter graphs in figure 1A. 10,000 events were analyzed per sample. Data are represented as the mean % gated ± S.E.M for eight individual experiments using B cells from different C57BL/6 mice. * t test for CP55940 treated cells versus the respective vehicle (EtOH) controls, p < 0.05.
CP55940 Enhances IgE Secretion
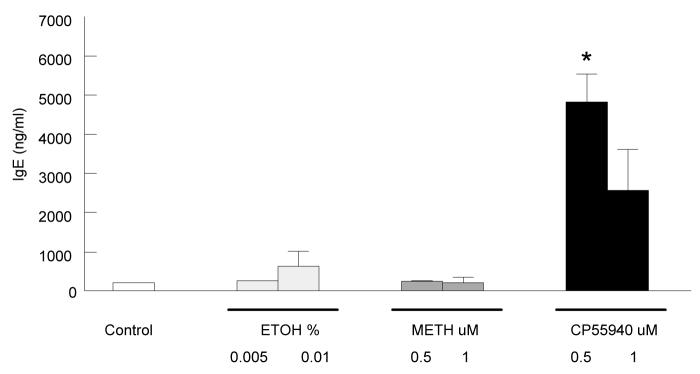
Besides enhancing IgE surface expression, CP55940 was also shown to enhance IgE secretion into culture supernatants. B cells were stimulated in culture with IL-4 and anti-CD40 and two different concentrations of CP55940 or methanandamide as described above. Untreated control cells and vehicle treated cells were also studied. All cells were harvested at day 5, and supernatants were collected for IgE analysis by ELISA (Fig. 5). Cultures treated with 0.5 uM CP55940 showed a fifteen-fold increase in IgE levels (∼5000 ng/ml) compared to vehicle control. 1 uM CP55940 treated cultures showed a five-fold increased in IgE levels (∼2500 ng/ml) compare to vehicle control. We did not observe a concentration dependent increase in IgE secretion. This may be due to the rate of degradation and the half life of unbound IgE in culture. Methanandamide had very little effect in IgE secretion similar to untreated and vehicle controls. Overall, only cultures treated with CP55940 enhanced IgE secretion by day 5.
Figure 5. CP55940 enhances IgE secretion measured by ELISA.
B cells were stimulated with IL-4 (0.1ng/ml) and anti-CD40 (500ng/ml) with or without drug treatment for 5 days. Cells were treated with either 0.5 or 1 uM CP55940 or methanandamide, and supernatants were collected at day 5 and analyzed for IgE by ELISA. Y-axis represents secreted IgE levels in ng/ml. Data are represented as the mean IgE ng/ml ± S.E.M for three individual experiments using B cell culture supernatants from different B cell treatments. * t test for CP55940 treated cells versus the respective vehicle (EtOH) controls, p < 0.05.
CB2 Antagonist Attenuates CP55940 Effect
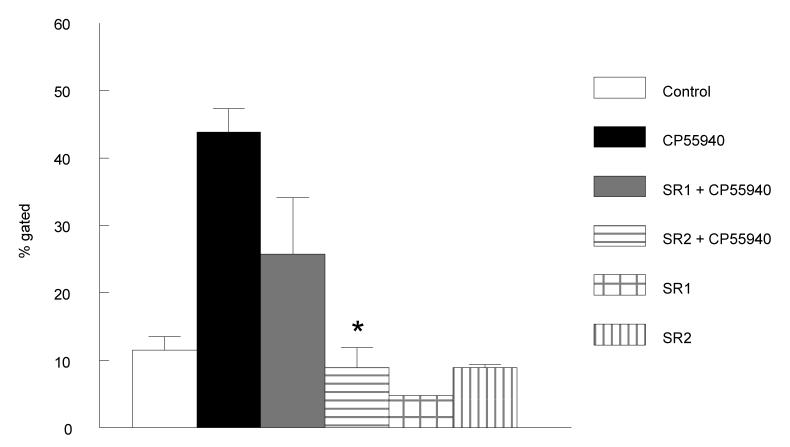
The above data show the nonselective agonist CP55940 enhanced IgE surface expression and secretion in B cell cultures. On the other hand, the CB1 selective agonist, methanandamide, had no effect on B cell class switching. Therefore, we suspected CB2 receptors were involved in the class switching effect observed when B cells were treated with CP55940. In order to confirm CB2 involvement, B cells were treated with CB1 or CB2 antagonists prior to CP55940 treatment. Cells were stimulated as above with IL-4 and anti-CD40 and then pretreated with either the CB1 antagonist, SR141716A, or the CB2 antagonist, SR144528 (0.1 uM), for 30 min. prior to CP55940 (0.5 uM) treatment. Controls were treated with either antagonist only. The data showed CB2 receptor involvement in that pretreatment with the CB2 antagonist attenuated the CP55940 effect to a greater extent than pretreatment with the CB1 antagonist (Fig. 6). Clearly more studies are needed, but these data suggest a more robust role of CB2 in the regulation of class switching.
Figure 6. CB2 antagonist treatment attenuates CP55940 effect.
B cells were treated with CB1 (SR1) or CB2 (SR2) antagonists (0.1 μM) prior to CP55940 (0.5 μM) treatment and cultured for 5 days. Surface IgE levels were analyzed by flow cytometry with anti-IgE-FITC. Y-axis shows percent of gated cells, CD19+IgE+, B cells. Gates are shown on the scatter in figure 1A. 10,000 events were analyzed per sample. Data are represented as the mean % gated ± S.E.M for two individual experiments using B cells from different C57BL/6 mice. * t test for SR2 pretreated samples versus the CP55940-treated sample, p < 0.05.
DISCUSSION
CB2 receptors are expressed more abundantly in the immune system than CB1; however, the role of these receptors is still not clear in both the normal functioning of the immune system and in the immunomodulation effect of cannabinoid-based drugs (Klein, 2005; Klein and Cabral, 2006). The role of these receptors in B cell biology has been of particular interest to us because these cells express the highest level of CB2 mRNA among immune cells (Galieque et al., 1995), have been shown to be activated by cannabinoids (Carayon et al., 1998), and CB2 message is increased in B cells by IL-4, the potent B cell activating cytokine (Schroder et al., 2002). It is also known that immune cells produce endocannabinoids that bind to CB2 receptors (Klein and Cabral, 2006) and it is possible; therefore, that during immune activation, these endogenous ligands might modulate B cell function such as immunoglobulin class switching. It is possible that the effect we have observed in the current study with CP55940 is strongly mimicking the natural CB2 augmentation of class switching induced by endogenous cannabinoid ligands. Primary cultures of mouse B cells can be induced to proliferate and undergo Ig class switching to IgG1 and IgE under the influence of added anti-CD40 antibody and recombinant IL-4 (Rush et al., 2002). The IL-4 is the main stimulus of class switching because it induces the transcription of all germline genes as well as the ε germline gene leading to production of IgE (Takhar et al., 2005). Our results show that the degree of IgE class switching is dependent on the concentration of IL-4 added to the cultures and not on the concentration of anti-CD40 confirming the important role of this cytokine in class switching in highly purified B cell populations. The cultures treated with IL-4 and anti-CD40 also showed a robust increase in the expression of CB2 protein as measured by flow cytometry. The method used detects both membrane bound and intracellular CB2 protein so the absolute amount of protein expressed on the plasma membranes is not clear. However, preliminary studies (not shown) with antibodies directed to the external, amino end of CB2, and employing surface staining techniques, suggest that the level of membrane expression is quite low relative to the total amount of protein expressed by the cell. Although, several previous studies reported that IL-4-stimulated (Schroder et al., 2002) or anti-CD40 stimulated (Carayon et al., 1998; Lee et al., 2001) B cells increased CB2 mRNA, our results are the first to show that mouse B cells stimulated with both agents also increase the expression of CB2 protein. We are currently testing if IL-4 is a major stimulus in up-regulating CB2 protein as the previous studies measuring mRNA suggested (Schroder et al., 2002).
Cannabinoids such as THC have been reported to either suppress (Kaminski et al., 1994) or enhance (Newton et al., 1994) B cell functions such as antibody formation; however, these studies were done using mixed immune cell populations and therefore the direct effect of the drug on isolated B cells could not be determined. The current report is the first to examine cannabinoid effects on purified B cell populations and the results show that the non-selective cannabinoid, CP55940, enhances the IL-4-and anti-CD40-induced class switching event so that by 5 days in culture the drug increased IgE expression by 40-60%. CP55940 is a non-selective agonist binding equally to both CB1 and CB2; interestingly, results with the CB1 selective agonist, methanandamide, showed no augmentation of class switching. This finding coupled with our data showing the CP55940 effect was attenuated to a greater extent by the CB2 antagonist suggests that CB2 is mediating the class switching effect. B cells in response to IL-4 and anti-CD40 undergo class switch recombination (CSR) changing the C region of the H chain to express IgE (Takhar et al., 2005). The molecular mechanisms for CSR involve non-homologous recombination in the switching sites of the H chain genes as well as the upregulation of the enzyme, activation-induced cytidine deaminase (AID). Our data suggest that activation of CB2 enhances IgE expression but it is not clear if this is through an increase in IL-4 production by the B cells or through an increase in the molecular events surrounding CSR. CB2 is coupled predominantly through Gi/o proteins, i.e., negatively through the Gα subunit to adenylyl cyclase and positively through Gβ/γ to MAP kinase (Pertwee, 2006). Additionally, at least for CB1, there is some evidence cannabinoid receptors may signal through Gs (Pertwee, 2006). From this, it is possible that these G protein-coupled mechanisms mediate either CSR as has been observed with other agents that increase cAMP (Roper et al., 1995) or affect IL-4 production as has been observed in the case of other cytokines such as IL-12 (Braun and Kelsall, 2001). We are currently examining the effect of cannabinoids on IL-4 mRNA expression in treated B cells as well as studying the effect of the drugs on AID production as a marker for increased CSR in B cells.
Acknowledgments
Supported by grant #DA019824 from the National Institute on Drug Abuse Presented at the Society on Neuroimmune Pharmacology, April, 2007.
REFERENCES
- Braun MC, Kelsall BL. Regulation of interleukin-12 production by G-protein-coupled receptors. Microbes Infect. 2001;3:99–107. doi: 10.1016/s1286-4579(00)01357-5. [DOI] [PubMed] [Google Scholar]
- Carayon P, Marchand J, Dussossoy D, Derocq JM, Jbilo O, Bord A, Bouaboula M, Galiegue S, Mondiere P, Penarier G, LeFur G, Defrance T, Casellas P. Modulation and functional involvement of CB2 peripheral cannabinoid receptors during B-cell differentiation. Blood. 1998;92:3605–3615. [PubMed] [Google Scholar]
- Galieque S, Mary S, Marchand J, Dussossoy D, Carriere D, Carayon P, Bouaboula M, Shire D, Le Fur G, Casellas P. Expression of central and peripheral cannabinoid receptors in human immune tissues and leukocyte subpopulations. Eur J Biochem. 1995;232:54–61. doi: 10.1111/j.1432-1033.1995.tb20780.x. [DOI] [PubMed] [Google Scholar]
- Kaminski N, Koh WS, Yang KH, Lee M, Kessler FK. Suppression of the humoral immune response by cannabinoids is partially mediated through inhibition of adenylate cyclase by a pertussis toxin-sensitive G-protein coupled mechanism. Biochem Pharm. 1994;48:1899–1908. doi: 10.1016/0006-2952(94)90588-6. [DOI] [PubMed] [Google Scholar]
- Klein TW, Newton C, Larsen K, Lu L, Perkins I, Nong L, Friedman H. The Cannabinoid System and Immune Modulation. J of Leukocyte Biology. 2003;74:486–496. doi: 10.1189/jlb.0303101. [DOI] [PubMed] [Google Scholar]
- Klein TW. Cannabinoid-based drugs as anti-inflammatory therapeutics. Nat Rev Immunol. 2005;5:400–411. doi: 10.1038/nri1602. [DOI] [PubMed] [Google Scholar]
- Klein TW, Cabral G. Cannabinoid-induced immune suppression and modulation of antigen-presenting cells. J Neuroimmune Pharmacol. 2006;1:50–64. doi: 10.1007/s11481-005-9007-x. [DOI] [PubMed] [Google Scholar]
- Lee SF, Newton C, Widen R, Friedman H, Klein TW. Differential expression of cannabinoid CB2 receptor mRNA in mouse immune cell subpopulations and following B cell stimulation. Eur J Pharmacol. 2001;423:235–241. doi: 10.1016/s0014-2999(01)01122-0. [DOI] [PubMed] [Google Scholar]
- Lu T, Newton C, Perkins I, Friedman H, Klein TW. Cannabinoid Treatment Suppresses the T-Helper Cell-Polarizing Function of Mouse Dendritic Cells Stimulated with Legionella pneumophila Infection. J Pharmacol Exp Ther. 2006;319:269–276. doi: 10.1124/jpet.106.108381. Epub 2006 Jul 2012. [DOI] [PubMed] [Google Scholar]
- Newton CA, Klein TW, Friedman H. Secondary immunity to Legionella pneumophila and Th1 activity are suppressed by delta- 9-tetrahydrocannabinol injection. Infect Immun. 1994;62:4015–4020. doi: 10.1128/iai.62.9.4015-4020.1994. [DOI] [PMC free article] [PubMed] [Google Scholar]
- Pertwee RG. Cannabinoid pharmacology: the first 66 years. Br J Pharmacol. 2006;147:S163–171. doi: 10.1038/sj.bjp.0706406. [DOI] [PMC free article] [PubMed] [Google Scholar]
- Roper RL, Brown DM, Phipps RP. Prostaglandin E2 promotes B lymphocyte Ig isotype switching to IgE. J Immunol. 1995;154:162–170. [PubMed] [Google Scholar]
- Rush JS, Hasbold J, Hodgkin PD. Cross-linking surface Ig delays CD40 ligand- and IL-4-induced B cell Ig class switching and reveals evidence for independent regulation of B cell proliferation and differentiation. J Immunol. 2002;168:2676–2682. doi: 10.4049/jimmunol.168.6.2676. [DOI] [PubMed] [Google Scholar]
- Schroder AJ, Pavlidis P, Arimura A, Capece D, Rothman PB. Cutting edge: STAT6 serves as a positive and negative regulator of gene expression in IL-4-stimulated B lymphocytes. J Immunol. 2002;168:996–1000. doi: 10.4049/jimmunol.168.3.996. [DOI] [PubMed] [Google Scholar]
- Takeda K, Tanaka T, Shi W, Matsumoto M, Minami M, Kashiwamura S, Nakanishi K, Yoshida N, Kishimoto T, Akira S. Essential role of Stat6 in IL-4 signalling. Nature. 1996;380:627–630. doi: 10.1038/380627a0. [DOI] [PubMed] [Google Scholar]
- Takhar P, Smurthwaite L, Coker HA, Fear DJ, Banfield GK, Carr VA, Durham SR, Gould HJ. Allergen drives class switching to IgE in the nasal mucosa in allergic rhinitis. J Immunol. 2005;174:5024–5032. doi: 10.4049/jimmunol.174.8.5024. [DOI] [PubMed] [Google Scholar]


