

Abstract
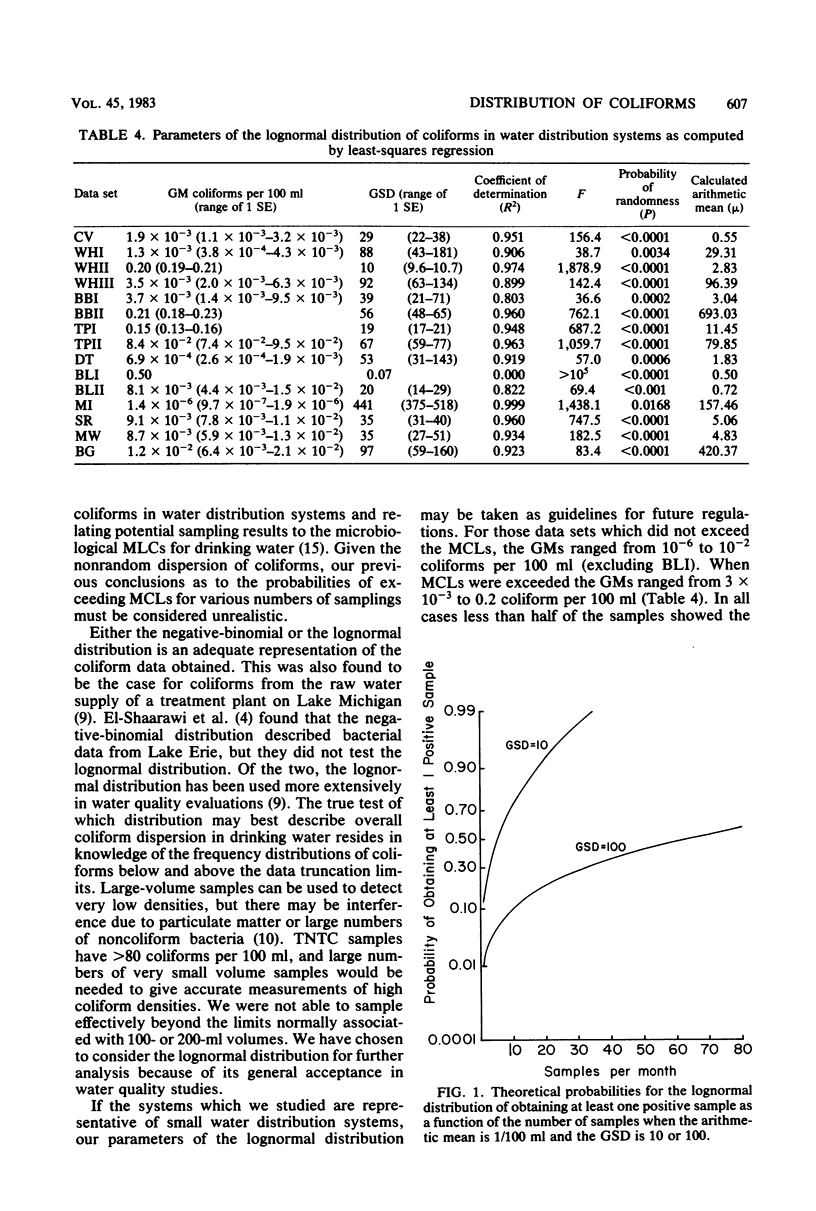
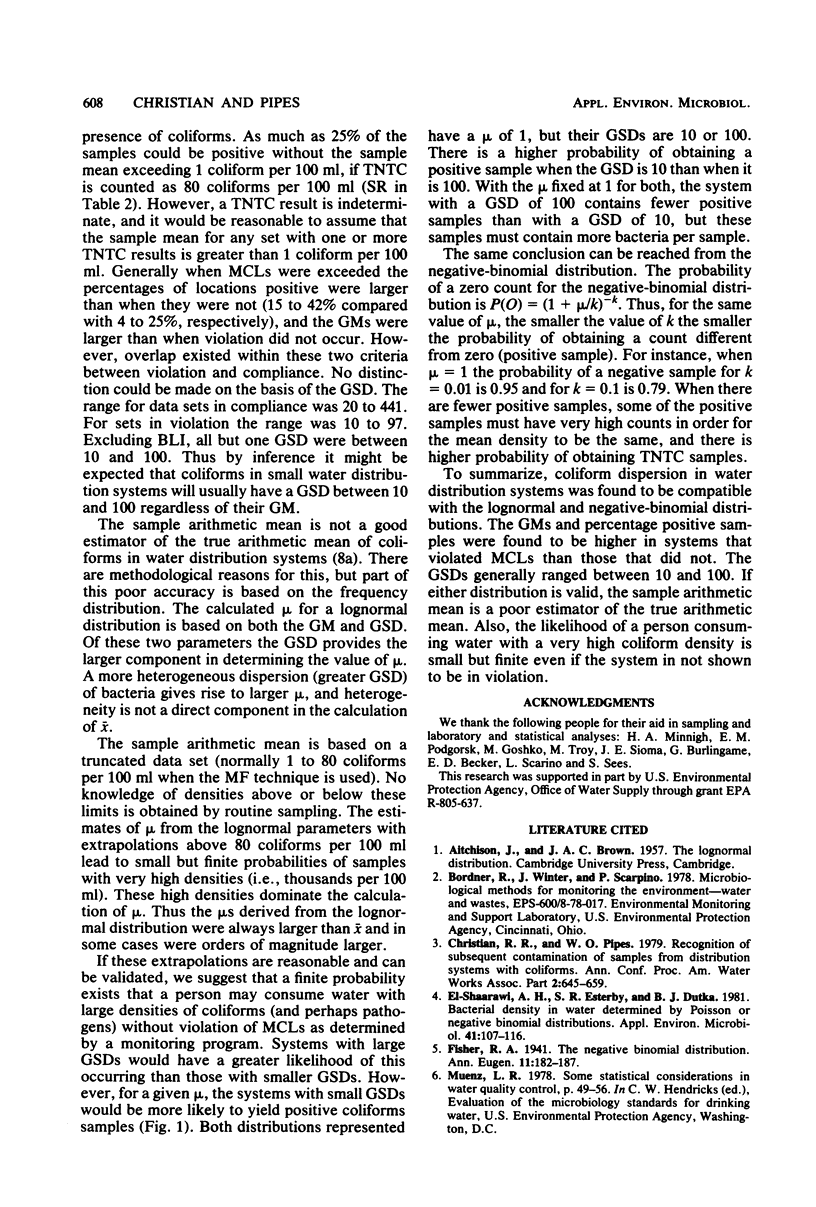
Nine small water distribution systems were sampled intensively to determine the patterns of dispersion of coliforms. The frequency distributions of confirmed coliform counts were compatible with either the negative-binomial or the lognormal distribution. They were not compatible with either the Poisson or Poisson-plus-added zeroes distribution. The implications of the use of the lognormal distributional model were further evaluated because of its previous use in water quality studies. The geometric means from 14 data sets ranged from 10(-6) to 0.2 coliforms per 100 ml, and the geometric standard deviations were between 10 and 100, with one exception. If the lognormal model is representative of the coliform distribution; the arithmetic mean sample count is a poor estimator of the true mean coliform density, and the probability of water in a distribution system containing small patches with large coliform densities without detection by routine monitoring is finite. These conclusions have direct bearing on the interpretation of microbiological quality standards for drinking water.
Full text
PDF
Selected References
These references are in PubMed. This may not be the complete list of references from this article.
- El-Shaarawi A. H., Esterby S. R., Dutka B. J. Bacterial density in water determined by poisson or negative binomial distributions. Appl Environ Microbiol. 1981 Jan;41(1):107–116. doi: 10.1128/aem.41.1.107-116.1981. [DOI] [PMC free article] [PubMed] [Google Scholar]