

Abstract
Background
Only 33% of eligible human immunodeficiency virus (HIV)–infected patients in South Africa receive antiretroviral therapy (ART). We sought to estimate the impact of alternative ART scale-up scenarios on patient outcomes from 2007−2012.
Methods
Using a simulation model of HIV infection with South African data, we projected HIV-associated mortality with and without effective ART for an adult cohort in need of therapy (2007) and for adults who became eligible for treatment (2008−2012). We compared 5 scale-up scenarios: (1) zero growth, with a total of 100,000 new treatment slots; (2) constant growth, with 600,000; (3) moderate growth, with 2.1 million; (4) rapid growth, with 2.4 million); and (5) full capacity, with 3.2 million.
Results
Our projections showed that by 2011, the rapid growth scenario fully met the South African need for ART; by 2012, the moderate scenario met 97% of the need, but the zero and constant growth scenarios met only 28% and 52% of the need, respectively. The latter scenarios resulted in 364,000 and 831,000 people alive and on ART in 2012. From 2007 to 2012, cumulative deaths in South Africa ranged from 2.5 million under the zero growth scenario to 1.2 million under the rapid growth scenario.
Conclusions
Alternative ART scale-up scenarios in South Africa will lead to differences in the death rate that amount to more than 1.2 million deaths by 2012. More rapid scale-up remains critically important.
South Africa has one of the largest burdens of HIV disease in the world, with an estimated 4.9 − 6.1 million people infected and a reported prevalence of 18.8% in adults 15−49 years old [1]. In 2007, the World Health Organization (WHO) and the Joint United Nations Programme on HIV/AIDS (UNAIDS) estimated that 1,000,000 people in South Africa required antiretroviral therapy (ART) [2]. The number of patients with access to ART is steadily increasing, largely as a result of funding from the South African government itself, as well as strategic assistance from the US President's Emergency Plan for AIDS Relief (PEPFAR) and the Global Fund to Fight AIDS, Tuberculosis and Malaria (GFATM) [3–5]. Treatment efforts have been accompanied by a national AIDS plan for drug distribution, creation of a more comprehensive health care infrastructure, and establishment of treatment guidelines [6]. Even with these remarkable expansions in capacity, however, the enormity of the epidemic continues to overwhelm the treatment systems; by the end of 2006, ART was reaching fewer than 33% of eligible patients in South Africa [7].
For development of health policy, it is useful to quantify the potential consequences of disease outcomes under different treatment and practice scenarios [8]. To this end, our objective was to project alternative ART rollout scenarios over the next several years in South Africa. The goals were to forecast the number of lives lost while awaiting needed therapy, to estimate the number of people both in and out of care, and to project when and whether HIV treatment needs would be fully met. These estimates can be used to inform decisions regarding the life-saving value of alternative treatment expansion scenarios in South Africa, as well as in other developing countries.
METHODS
Analytic Framework
We conduct this analysis in 4 steps. First, we parameterized a detailed computer-based simulation model of HIV disease with data from South Africa. Second, we conducted a series of analyses that assessed the outcomes associated with different ART strategies in selected cohorts of patients. Outcomes included mean CD4 count and HIV RNA levels of the surviving cohort over time, as well as AIDS-related and non–AIDS-related deaths each year. Treatment strategies included no ART and ART that used 2 lines of therapy (“line” here refers to the modeled number of sequential ART regimens available). Each strategy included co-trimoxazole prophylaxis in all scenarios, provided according to WHO guidelines [9]. Cohorts were selected to reflect the fact that in 2007 (the year of the most up-to-date WHO estimates) [2], patients who met ART eligibility criteria were distributed across HIV disease stages, as well as the fact that in subsequent years, patients who were initially in earlier disease stages progress to meet ART criteria. Third, we used the information generated from the model simulations to assess outcomes associated with different scenarios intended to represent potential population-based strategies for ART scale-up (table 1). Outcomes were expressed as number of people alive and on ART, as well as deaths, between 2007−2012. Finally, in sensitivity analyses, we examined the effect of changes in the CD4 count distribution of the cohorts modeled, the number and efficacy of available ART regimens [10, 11], and the availability of CD4 count monitoring [12].
Table 1.
Alternative scale-up scenarios for antiretroviral therapy analyzed in the study.
| Scale-up scenario | Description | New treatment slots available in year (t+1) |
|---|---|---|
| Zero growth | There are no new treatment slotsa | New slots(t+1) = 0 |
| Constant growth | A fixed number of new slots open each year | New slots(t+1) = new slots(t) |
| Moderate growth | Each year, 100,000 additional new slots open, compared with the prior year | New slots(t+1) = new slots(t) + 100,000 |
| Rapid growth | Each year, the number of new slots doubles, compared with the prior year | New slots(t+1) = min ([2 × new slots(t)], patients in need(t+1))b |
| Full capacity | Each year, there are slots available to treat everyone in need | New slots(t+1) = Patients in need(t+1) - existing slots freed up by deaths(t) |
This reflects newly available treatment slots for antiretroviral therapy (ART) and does not reflect treatment slots that became available due to deaths of patients who received ART in the previous year.
The no. of new slots is equal to whichever of these 2 values is smaller.
CEPAC-International Model and Parameterization
The model
The CEPAC-International Model is a computer-based simulation model of the natural history of HIV infection in different settings; it has been used to estimate the clinical and economic consequences of different strategies for opportunistic infection prophylaxis and ART [13, 14]. We provide a focused description here; further model details have been described elsewhere (see the Appendix, which is available only in the electronic version) [13, 14]. Disease progression was portrayed as a sequence of monthly transitions between health states defined to capture key elements of disease and prognosis. Health states reflected chronic HIV infection, acute illness related to HIV (e.g., opportunistic infection), or death. Health states were stratified by HIV RNA level (>30,000 copies/mL; 10,001−30,000 copies/mL; 3,001−10,000 copies/mL; 501−3,000 copies/mL and ≤500 copies/mL), which informs the monthly rate of decline in CD4 count. In turn, CD4 count (≤50 cells/μL, 51−200 cells/μL, 201− 350 cells/μL, 351−500 cells/μL, and >500 cells/μL) informs the monthly risk of opportunistic infection and death (table 2). Clinical decisions, such as the initiation of ART, were based on clinical findings and, when available, CD4 count and HIV RNA results. Patients on effective ART experience monthly increases in CD4 count, reducing their risk of opportunistic infections and death. After virologic failure, CD4 counts decline, with a concomitant increase in the risk of opportunistic infections. Patients who remain on ART despite virologic failure continue to have some reduction in risk of opportunistic infections and mortality independent of CD4 count [20], compared with patients who do not continue therapy. The model specified the most prevalent opportunistic infections in South Africa and divided them into 8 severe and 3 mild categories (table 2).
Table 2.
Model input parameters for a simulation of scale-up of antiretroviral therapy (ART) in South Africa.
| Variable | Estimate | Reference |
|---|---|---|
| Monthly decline in CD4 count, mean, cells/μL | [15] | |
| >30,000 HIV RNA, copies/mL | 6.4 | |
| 10,001−30,000 HIV RNA, copies/mL | 5.4 | |
| 3,001−10,000 HIV RNA, copies/mL | 4.6 | |
| 501−3000 HIV RNA, copies/mL | 3.7 | |
| ≤500 HIV RNA, copies/mL | 3.0 | |
| Monthly risk of severe opportunistic infectionsa, % | [16] | |
| Bacterial | 0.08−0.71 | |
| Fungal | 0.02−2.22 | |
| Tuberculosis | 0.21−1.96 | |
| Toxoplasmosis | 0.00−0.06 | |
| Non-tuberculous mycobacteriosis | 0.00−0.30 | |
| Other | 0.25−2.57 | |
| Monthly risk of mild opportunistic infectionsa, % | [16] | |
| Pneumocystis jiroveci pneumonia | 0.00−0.12 | |
| Fungal | 0.59−3.51 | |
| Other | 2.51−3.11 | |
| Efficacy of co-trimoxazole, percent reduction in monthly risk of infection | ||
| Mild bacterial infection | 48.8 | [14] |
| Severe bacterial infection | 49.8 | |
| Severe malaria | 88.4 | |
| Isosporiasis | 81.8 | |
| Toxoplasmic encephalitis | 83.3 | |
| Mild fungal infectionsb | −46.4 | |
| Rates of virologic suppression at 48 weeks, % | ||
| NNRTI + 2 NRTI | 84 | [17, 18] |
| PI + 2 NRTI (recycled NRTIs) | 71 | [19] |
| 2007 prevalent cohort | Model derived | |
| CD4 counts, cells/μL, mean ± SD | 92 ± 49 | |
| Initial distribution of viral load, percentage of patients | ||
| >30,000 HIV RNA copies/mL | 67 | |
| 10,001−30,000 HIV RNA copies/mL | 19 | |
| 3,001−10,000 HIV RNA copies/mL | 9 | |
| 501−3,000 HIV RNA copies/mL | 3 | |
| ≤500 HIV RNA copies/mL | 2 | |
| 2008−2012 incident cohorts | Model derived | |
| CD4 count, mean ± SD, cells/μL | 210 ± 50 | |
| Initial distribution of viral load, percentage of patients | ||
| >30,000 HIV RNA copies/mL | 71 | |
| 10,001−30,000 HIV RNA copies/mL | 18 | |
| 3,001−10,000 HIV RNA copies/mL | 8 | |
| 501−3,000 HIV RNA copies/mL | 2 | |
| ≤500 HIV RNA copies/mL | 1 |
NOTE. NRTI, nucleoside reverse transcriptase inhibitor; NNRTI, nonnucleoside reverse transcriptase inhibitor; PI, protease inhibitor.
Risk is stratified by CD4 cell count; in nearly all cases, monthly risk increased with decreasing CD4 count. The following 5 severe opportunistic infections were considered late stage and were used to trigger initiation of antiretroviral therapy: severe fungal infections, isosporiasis, cerebral toxoplasmosis, non-tuberculous mycobacteriosis, and other severe illnesses.
The percentage monthly risk of mild fungal infections is increased by 46.4% in the presence of co-trimoxazole [14].
Model input parameters
Model input data are summarized in table 2 [14–19, 22]. Model results for both the treated and untreated cohorts were validated with current HIV-related death rates in South Africa [21, 22]. Data on the monthly risk of opportunistic infection were derived from a Cape Town cohort of 2,080 patients followed up longitudinally since 1984 [16, 23–25]. They were stratified by CD4 count, and the highest risk of opportunistic infection occurred in the lower strata [16, 23–25]. Co-trimoxazole is effective in preventing several of these opportunistic infections (e.g., Pneumocystis jiroveci pneumonia [formerly Pneumocystis carinii pneumonia], toxoplasmosis, and some bacterial infections), though it may also increase the risk of mild fungal infections [14].
A first-line, nonnucleoside reverse transcriptase inhibitor– based regimen (in combination with 2 nucleoside reverse transcriptase inhibitors [NRTIs]) had a 48-week HIV RNA suppression rate of 84%, with a mean CD4 count increase of 184 cells/μL [17, 18]. Upon observed clinical or immunologic failure of the first-line regimen, the efficacy of a second-line regimen, if available, presumed the addition of a ritonavir-boosted protease inhibitor. This second-line regimen provided a 48-week HIV RNA suppression rate of 71% and a corresponding CD4 count increase of 151 cells/μL [19].
Cohort Descriptions
We distinguished patients who required therapy in 2007 (hereafter, the “prevalent cohort”) from those who would need therapy in the period from 2008−2012 (hereafter, the “incident cohort”). The outcomes of both cohorts were examined for both the ART and “no ART” strategies. We defined patients in need of ART as those who met the current South African criteria that define ART eligibility, regardless of whether the patient had been identified as having HIV infection [26, 27]. These criteria include WHO Stage 4 AIDS-defining illness and/or symptomatic disease with a CD4 count <200 cells/μL [26, 27]. In the base case, there is no prioritization for ART; that is, among those eligible, patients are randomly chosen for ART and are not given preference based on CD4 count, degree of “AIDS sickness,” or time waiting for ART.
Patients in need of therapy in 2007
We began the time horizon with the most recent WHO estimates (2007), when there were an estimated 1,000,000 patients in South Africa in need of therapy [2]. To approximate the distribution of stage of illness for these patients, we assumed that the South Africa epidemic was in a steady state and that the number of incident cases each year remained the same over the 10-year period prior to ART rollout (1997−2006). As noted above, we refer to this cohort as the prevalent cohort.
Patients who require therapy in the future (2008−2012)
Patients become newly eligible for therapy each year from 2008−2012. This reflects the fact that incident cases of HIV will occur, and that existing patients with early infection will progress to a point at which they are eligible for ART. Approximately 5.51 million people are estimated to be living with HIV/AIDS in South Africa [2, 28]. With a mean 10-year progression from HIV infection to AIDS [29], we estimated that 10% of those 5.51 million infected people (or 551,000 people) would be newly in need of therapy in each year. As noted above, we refer to this group as the incident cohort.
Derivation of initial mean CD4 counts of the cohorts
The mean CD4 count of the prevalent and incident cohorts were obtained from the CEPAC-International Model. The incident cohort was derived first. The characteristics of the incident cohort, which becomes eligible for ART in yearly cycles, are obtained by tracking the course of HIV disease for a relatively healthy starting cohort (CD4 count, mean ± SD, 534 ± 100 cells/μL) that received only co-trimoxazole prophylaxis [30]. The model records and averages the clinical characteristics of patients (e.g., CD4 count, HIV RNA levels, and opportunistic infection history) as they reach the criteria for ART eligibility (CD4 < 200 cells/μL or severe opportunistic infection). The resulting incident cohort had a mean (±SD) CD4 count of 210 (± 50) cells/μL.
The prevalent cohort was a heterogeneous distribution of patients who had been in need of ART for varying amounts of time. The characteristics of the prevalent cohort were obtained by simulating and tracking the course of HIV disease for an incident cohort as described above (CD4 count, mean ± SD, 210 ± 50 cells/μL) that receives co-trimoxazole prophylaxis only [14]. Thus, the 1997 cohort was followed for 10 years, whereas the 2006 cohort was followed for 1 year. We then calculated a weighted average of CD4 count and HIV RNA distribution on the basis of the population distribution of all patients who were alive at the end of the 10-year period. The patients alive at the beginning of the ART rollout period consisted mostly of the cohort that had become eligible in 2006 (44% of the patients alive at beginning of the rollout period), whereas patients who had reached the eligibility criteria in 1997 but were not treated constituted less than 0.01% of those still alive in 2007. The resulting cohort (i.e., the prevalent cohort) had a mean (±SD) CD4 count of 92 (± 49) cells/μL.
Scenarios Examined
We examined 5 population-based strategies of ART scale-up based, in part, on projections made by the Actuarial Society of South Africa, the South African Joint Task Force, and the WHO [6, 28, 31]. These scenarios (table 1) range from a situation in which no new treatment funds are allocated (zero growth) to a situation in which a rapid and aggressive scale-up program is initiated (rapid growth) [32, 33]. We consider the full capacity scale-up program only for purposes of comparison.
Using WHO surveillance data and model-generated mortality rates, we projected the number of deaths under each scenario. Each year, mortality was calculated to include deaths that occurred among patients who needed, but had not yet received, ART, in addition to deaths that occurred—albeit later and at a slower rate—among patients who received ART. For patients who died while receiving ART, we assumed that their treatment slots (which reflected unused medications and human resources) would be available for other patients in the following year. In each scenario, the total deaths and total life years of survival were tallied and reported from 2007−2012.
RESULTS
Survival Rates
Assessment of model performance
To ensure that model-based death rates were appropriate for long-term projections, we compared them to reported survival trends in South Africa, both for patients who received ART and those who did not. At each yearly time point, model-based estimates were within 10% of reported survival (see the Appendix, which is available only in the electronic version) [21].
Projected survival with and without ART for both cohorts
Patients who entered the model in the prevalent cohort (2007; mean CD4 count, 92 cells/μL) and received ART in that year had 1- and 5-year projected survival rates of 94% and 70%, respectively. If they did not receive ART, these patients had markedly reduced survival rates of 55% at 1 year and 1% at 5 years. For patients in the comparatively healthier incident cohort (2008−2012, mean CD4 count, 210 cells/μL) who received ART as recommended without delay, 1- and 5-year survival rates were 94% and 72%, respectively. If the patients did not receive ART, the corresponding 1- and 5-year survival rates for the incident cohort were 79% and 4%.
Number of Patients Who Received ART for Each Scenario
For each scale-up scenario, we examined the number of people alive and on ART at the end of each year, comparing the current study to published South African projections (figure 1). By 2012, if all patients received ART in the year that they first met eligibility criteria (full capacity), 2.9 million people would be alive and receiving treatment in 2012. The rapid-growth scenario results in 2.5 million people receiving treatment, compared to 2.2 million in the moderate-growth scenario, 831,000 in the constant-growth scenario, and 364,000 in the zero-growth scenario.
Figure 1.
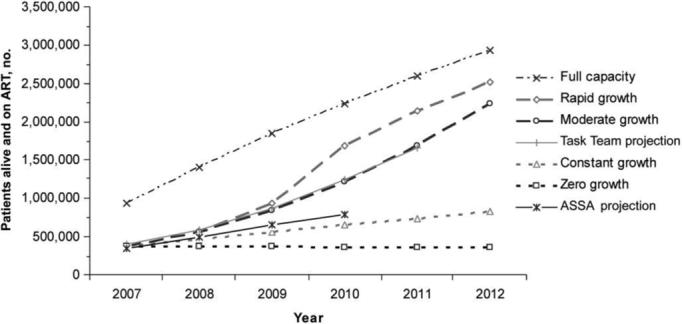
No. of patients alive and on antiretroviral therapy (ART) at the end of each year, according to scale-up scenario (dashed and dotted lines), compared with previously published South African projections (solid lines). The constant growth scenario modeled in the study best approximates the projections of the Actuarial Society of South Africa (ASSA), whereas the moderate growth scenario best approximates the projections of the South African Joint Task Team on HIV Care in the Public Sector [6, 28, 31].
Figure 2 illustrates the percentage of patients alive and eligible each year who received ART. All of the patients who needed ART had access by 2011 in the rapid-growth scenario; the moderate-growth scenario met 97% of treatment need by 2012. In 2012, the constant-growth scenario met only 52% of the treatment need; the zero-growth scenario—with no new treatment slots available after 2007—met just 28% of the treatment need by 2012 (figure 2).
Figure 2.
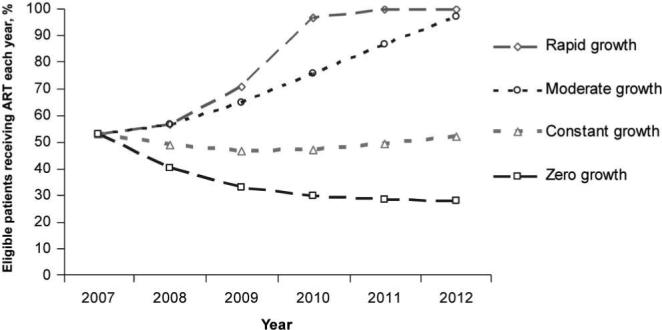
Percentage of patients eligible and alive who received antiretroviral therapy, for each modeled scenario. The rapid-growth scenario met 100% of need by 2011, and the moderate-growth scenario met 97% of need by 2012. The constant-growth scenario remained relatively unchanged and met 52% of need by 2012. The percentage of need met in the zero-growth scenario declined steadily to 28% in 2012.
Mortality Projections for Each Scenario
The number of deaths projected to occur before patients started ART and while patients were receiving ART were also calculated for each of the scenarios (figure 3). The total number of deaths increases over time in the zero-growth scenario due to a yearly influx of patients who require treatment (the incident cohort) without the provision of any new treatment resources. The rapid-growth scenario results in notably fewer deaths than all the other scenarios (except full capacity, which is provided for purposes of comparison). The increase in deaths under the rapid-growth scenario in 2010−2012 reflects patients who received ART during earlier years of their illness but who subsequently failed ART, and who die several years after treatment initiation.
Figure 3.

Annual projected no. of deaths through 2012, stratified by scale-up scenario and year. All scale-up scenarios (except full capacity) involved the same number of treatment slots in 2007, and all scenarios included the availability of 2 successive lines of therapy. The estimated number of deaths each year for those awaiting antiretroviral therapy (ART) and those receiving ART were calculated for each scale-up scenario by use of mortality rates generated from model output. Annual mortality rates for both the prevalent and incident cohorts were stratified by treatment status (awaiting ART or receiving ART) and length of time awaiting therapy.
Table 3 summarizes outcomes associated with the nearly 3.8 million patients eligible for therapy in the time horizon considered. The total number of deaths over 6 years ranged from 2.5 million under the zero-growth scenario to 1.2 million under the rapid-growth scenario. Compared with the zero-growth scenario, the constant-growth and moderate-growth scenarios averted 305,000 and 1,000,000 more deaths through 2012, respectively.
Table 3.
Outcomes for patients eligible for antiretroviral therapy (ART), according to alternative scale-up scenarios for ART in South Africa, 2007−2012.
| Dead, no. of patients |
Alive, no. of patients |
|||||
|---|---|---|---|---|---|---|
| Analysis, scenario | Awaiting ART | On ART | Total | Awaiting ART | On ART | Total |
| Base case | ||||||
| Zero growth | 2,294,000 | 171,000 | 2,465,000 | 926,000 | 364,000 | 1,290,000 |
| Constant growth | 1,896,000 | 264,000 | 2,160,000 | 764,000 | 831,000 | 1,595,000 |
| Moderate growth | 978,000 | 471,000 | 1,449,000 | 64,000 | 2,242,000 | 2,306,000 |
| Rapid growth | 681,000 | 551,000 | 1,232,000 | 0 | 2,523,000 | 2,523,000 |
| Full capacity | 0 | 823,000 | 823,000 | 0 | 2,932,000 | 2,932,000 |
| Sensitivity analyses | ||||||
| Prioritization | ||||||
| Zero growth | 2,268,000 | 180,000 | 2,448,000 | 946,000 | 361,000 | 1,307,000 |
| Constant growth | 1,800,000 | 286,000 | 2,086,000 | 845,000 | 824,000 | 1,669,000 |
| Moderate growth | 888,000 | 474,000 | 1,362,000 | 152,000 | 2,241,000 | 2,393,000 |
| Rapid growth | 610,000 | 564,000 | 1,174,000 | 0 | 2,581,000 | 2,581,000 |
| Full capacity | 0 | 823,000 | 823,000 | 0 | 2,932,000 | 2,932,000 |
| 1 line of ART | ||||||
| Zero growth | 2,264,000 | 229,000 | 2,493,000 | 910,000 | 352,000 | 1,262,000 |
| Constant growth | 1,861,000 | 344,000 | 2,205,000 | 740,000 | 810,000 | 1,550,000 |
| Moderate growth | 943,000 | 590,000 | 1,533,000 | 23,000 | 2,200,000 | 2,222,000 |
| Rapid growth | 672,000 | 681,000 | 1,353,000 | 0 | 2,402,000 | 2,402,000 |
| Full capacity | 0 | 1,024,000 | 1,024,000 | 0 | 2,731,000 | 2,731,000 |
| 3 sequential ART regimens | ||||||
| Zero growth | 2,297,000 | 162,000 | 2,459,000 | 929,000 | 367,000 | 1,296,000 |
| Constant growth | 1,899,000 | 253,000 | 2,152,000 | 767,000 | 836,000 | 1,603,000 |
| Moderate growth | 981,000 | 458,000 | 1,439,000 | 68,000 | 2,248,000 | 2,316,000 |
| Rapid growth | 681,000 | 537,000 | 1,219,000 | 0 | 2,536,000 | 2,536,000 |
| Full capacity | 0 | 796,000 | 796,000 | 0 | 2,959,000 | 2,959,000 |
| No CD4 monitoring | ||||||
| Zero growth | 2,027,000 | 541,000 | 2,568,000 | 862,000 | 325,000 | 1,187,000 |
| Constant growth | 1,539,000 | 897,000 | 2,436,000 | 611,000 | 708,000 | 1,319,000 |
| Moderate growth | 673,000 | 1,565,000 | 2,237,000 | 0 | 1,518,000 | 1,518,000 |
| Rapid growth | 566,000 | 1,652,000 | 2,218,000 | 0 | 1,537,000 | 1,537,000 |
| Full capacity | 0 | 2,101,000 | 2,101,000 | 0 | 1,654,000 | 1,654,000 |
In a sensitivity analysis, we examined the assumption that patients in need of ART are prioritized on the basis of the length of time they have been eligible for therapy (table 3). For example, in this prioritized scenario, the whole 2007 prevalent cohort would be treated before anyone in the 2008 incident cohort received therapy. This sort of prioritization, on average, treats the sickest patients (i.e., those with the lowest CD4 counts) first. For each scenario, prioritization led to fewer deaths over the 6-year time horizon, compared with the base case analysis. Comparison of each scenario with its nonprioritized counterpart showed between 17,000 (zero-growth scenario) and 87,000 (moderate-growth scenario) fewer deaths over 6 years.
We also examined the availability of only 1 line of ART (rather than 2 successive lines), changes in the efficacy of second-line therapy, the availability of 3 successive lines of ART, and a sce- nario in which no CD4 count monitoring was available. Compared with scenarios in which there were no CD4 tests available, the availability of CD4 testing resulted in 102,000−986,000 fewer deaths over 6 years. For each scenario, more deaths occurred when there were 2 lines of therapy and no CD4 monitoring available, compared with only 1 line of therapy and CD4 monitoring. Finally, varying the assumption regarding the efficacy of ART in preventing severe opportunistic infections, independent of CD4 count, produced quantitative changes in the survival rate but had no material impact on the qualitative findings.
DISCUSSION
We used a model-based analysis and South African data to project the average impact of alternative ART strategies over the next 5 years. We applied these strategies to different cohorts, which were intended to be representative of patients who were eligible for ART in 2007, patients who will be eligible for ART from 2008−2012, and patients who have been waiting for ART for varying periods of time. We aggregated the results of these cohorts to create a comparative analysis of population-based scenarios for ART scale-up.
The findings suggest that the potential loss of life associated with the failure to provide ART to all who need it, in South Africa alone, is enormous. A scenario that maintains current treatment capacity with no addition of treatment resources over the long term (zero growth) will result in over 1.2 million more deaths in South Africa—a country with a population of 48 million people [34]—by 2012, compared with a scenario that provides the resources to ensure universal access to ART by 2011 (rapid growth). The current projected time line for ART scale-up in South Africa (2.1 million receiving treatment by 2012, or a moderate-growth scenario) will likely result in nearly 1.5 million deaths through 2012, over 200,000 more than would be seen with rapid growth [35].
ART guidelines are generally country-specific and vary widely [36]. Some countries, for example, Malawi, do not recommend CD4 count monitoring, and ART initiation is based on WHO stage-3 or stage-4 disease, or CD4 count, if available [37]. Patients are now being enrolled in trials to examine the long-term impact of clinical monitoring versus laboratory monitoring while on ART, because earlier reports from programs that used clinical guidelines alone suggest substantial survival benefits, even without CD4 count monitoring [12]. These reports are consistent with the results reported here, however, without access to CD4 monitoring, the number of deaths through 2012 may increase by as many as 986,000, compared with similar scale-up scenarios in which CD4 monitoring is available. Indeed, these results emphasize that the addition of any ART regimen will greatly improve survival; however, they also highlight that the benefits of ART will be maximized with the addition of CD4 counts, as is current South Africa policy.
This analysis has several limitations. It does not compare different strategies for the operational delivery of ART (an essential component to effective scale-up), nor does it include unintended negative consequences of ART. Importantly, we also do not discuss the opportunity costs of investment in expanded ART. One South African projection estimates that full HIV treatment coverage by 2010—including the costs of antiretroviral drugs, nutritional support, and non-antiretroviral drugs—will cost 16.9−21.4 billion Rand in South Africa (US$2.54−3.22 billion) [38]. Although we have not addressed societal trade-offs in this paper, this analysis offers a quantitative assessment of the opportunity cost—in lives lost—of failing to make these investments in HIV care.
Beyond economic requirements, other complicated infrastructure issues cannot be overlooked and must play a role in any ART implementation. These include facilities, personnel, equipment, and political will. A goal of rapid scale-up must also be accompanied by a commitment to adequate monitoring of therapy, to avoid depletions of stock and interruptions in drug delivery, and to ensure patient adherence so that drug resistance does not occur. Recent findings on the role of extensively drug-resistant tuberculosis (XDR-TB) suggest that the implementation of a large-scale ART program in South Africa will require improvements in tuberculosis control programs as well, to maximize the survival benefits conferred by ART [39]. The rising prevalence of drug-resistant strains of tuberculosis, coupled with the high mortality rate among HIV-infected patients with XDR-TB, risks considerably undermining the benefits of ART in South Africa [39]. Infrastructure improvements for the care of individuals with HIV infection and tuberculosis are particularly important, given the possibility that XDR-TB may be transmitted in healthcare settings, thus putting HIV patients who seek medical care at greater risk of infection with this virulent tuberculosis strain [39].
As with all model-based analyses, data were derived from multiple sources, which contributes to some uncertainty in the model projections. In most cases, data are specifically from South Africa. However, when South African data were unavailable, we used the closest appropriate surrogate data. To ensure that the model outcomes adequately reflect the South African context, we provided validation from the South African natural history and treatment literature. The estimates of mean CD4 count in the population were made under the assumption of an HIV epidemic in steady state. We have addressed this assumption via sensitivity analyses, examining the parameters that might be most influential in the overall results. The analysis of prioritization made ART available first to those who had been waiting longest. On average, this meant prioritizing those with the lowest CD4 count (mean CD4 count when receiving ART after a wait of 1 year was 139 cells/μL, compared with a CD4 count of 210 cells/μL for those who received ART immediately), though this might not be true in every case.
Though the goal is ambitious, ART scale-up efforts to date have been impressive. The number of people receiving ART in low-income and middle-income countries worldwide increased more than five fold between 2001 and 2005, from 240,000 to 1.3 million [1]. This level of achievement was previously thought to be impossible. Deliberate, purposeful, and expedient scale-up—together with careful analysis of the outcomes associated with different pro-grammatic approaches—will make the difference in saving hundreds of thousands, or millions, of lives.
CEPAC-INTERNATIONAL INVESTIGATORS
Massachusetts General Hospital, Harvard Medical School, Boston, MA: Melissa A. Bender, Sarah Chung, Nomita Divi, Mariam O. Fofana, Kenneth A. Freedberg, Heather E. Hsu, Zhigang Lu, Anjali Saxena, Caroline Sloan, Callie A. Scott, Lauren Uhler, Stacie Waldman, Rochelle P. Walensky, Bingxia Wang, Lindsey L. Wolf, Hong Zhang; Boston University School of Public Health, Boston, MA: Elena Losina; Harvard School of Public Health, Boston, MA: Kara Cotich, Sue J. Goldie, April D. Kimmel, Marc Lipsitch, Chara Rydzak, George R. Seage III, Milton C. Weinstein; Service Universitaire des Maladies Infectieuses et du Voyageur, Centre Hospitalier de Tourcoing, Faculté de Médecine de Lille, France, Laboratoire de Recherches Economiques et Sociales, CNRS URA 362, Lille, France: Yazdan Yazdanpanah; INSERM U593, Bordeaux, France: Xavier Anglaret, Roger Salamon; Programme PAC-CI, Abidjan, Côte d'Ivoire: Xavier Anglaret, Thérèse N'Dri-Yoman, Siaka Touré, Catherine Seyler, Eugène Messou; Y.R. Gaitonde Centre for AIDS Research & Education, Chennai, India: Nagalingeswaran Kumarasamy, A.K. Ganesh; University of Cape Town, Cape Town, South Africa: Robin Wood; Perinatal HIV Research Unit, Wits Health Consortium, Johannesburg, South Africa: Glenda Gray, James McIntyre, Neil A. Martinson, Lerato Mohapi; Miriam Hospital, Providence, Rhode Island: Timothy Flanigan, Kenneth Mayer; Yale University, New Haven, Connecticut: A. David Paltiel.
Acknowledgments
Financial support: National Institute of Allergy and Infectious Diseases (R01 AI058736 to K.F., K24 AI062476 to K.F., K25 AI50436 to E.L., and P30 AI060354 to Bruce Walker); Doris Duke Charitable Foundation (Clinical Scientist Development Award 2005075 to R.W.). The funding sources had no input in study design, collection, analysis, and interpretation of data, writing of the report, or the decision to submit the paper for publication.
APPENDIX
This appendix is intended to provide methodological details to supplement the article's description of methods. We also include here some additional model output and results.
METHODS
Defining the Cohorts for the CEPAC-International Simulations
We defined several cohorts for the model simulations. The first were the validation cohorts (treated and untreated), which were defined to compare output from the model to endpoints and outcomes reported in the literature. Next, we defined a prevalent cohort, intended to model the distribution of patients who needed therapy in 2007. Finally, we defined an incident cohort to represent the distribution of newly-eligible patients who will require therapy in the future (2008−2012).
Validation Cohorts
The validation cohorts were intended to reflect a previously published cohort and are used to illustrate the fact that model outcomes and survival are representative of findings that have been reported in the South African setting [21, 22]. As noted in the literature, the untreated cohort has a mean (±SD) CD4 count of 273 (± 231) cells/μL, and the treated cohort has a mean (±SD) CD4 count of 259 (± 153) cells/μL (table A1) [21]. These mean CD4 counts were used as model input parameters to assess whether model output reflected the survival rates seen in the reported cohorts. Badri et al. [21] report that 50% of patients who received co-trimoxazole alone (reflective of the untreated cohort) survived for 30 months, and 90% of patients who received ART were alive at 36 months. Model-based estimates report median survival times of 31.5 months on co-trimoxazole prophylaxis alone, and 82.3% of patients who received ART were alive at 36 months. As noted in the Results section, model-based estimates reflected reported survival within 10%.
Table A1.
Validation cohort characteristics.
| Variable | Estimate | Reference |
|---|---|---|
| CD4 count, mean ±SD, cells/μL | [21] | |
| Treated | 259 ± 153 | |
| Untreated | 273 ± 231 | |
| Initial HIV RNA level, copies/mLa | ||
| > 30,000 | 71 | [21, 22] |
| 10,001−30,000 | 18 | |
| 3,001−10,000 | 8 | |
| 501−3,000 | 2 | |
| ≤500 | 1 |
Data are percentage of patients in the validation cohort with a given HIV RNA level.
Survival and Mortality
Because the baseline characteristics of patients in the prevalent cohort and the incident cohort differed, survival data were derived separately for each cohort. Furthermore, survival data were derived separately for patient populations awaiting ART (who received only co-trimoxazole prophylaxis) and receiving ART.
Patients awaiting ART
We obtained the probabilities of survival for patients awaiting ART by simulating the course of HIV disease with co-trimoxazole prophylaxis only, using the CEPAC International model [14]. Yearly probabilities of survival (conditional on survival to the beginning of the year) were computed by dividing the number of patients alive at the end of the given calendar year by the number alive at the end of the previous year. This was done to reflect a patient's probability of surviving through the year, given that the patient was alive at the beginning of the year. The yearly probabilities of death were defined as the complement of the corresponding yearly probability of survival, as shown in table A2. The first column (“wait before initiating ART”) indicates the number of years that patients had been awaiting ART (since the start of the analysis in 2007).
Table A2.
CD4 count and probability of death for patients awaiting antiretroviral therapy (ART), according to cohort and time before initiating ART.
| Mean CD4 count, mean, cells/μL |
Yearly probability of death, % |
|||
|---|---|---|---|---|
| Wait before initiating ART | Incident cohort | Prevalent cohort | Incident cohort | Prevalent cohort |
| 1 year | 139 | 38 | 21.08 | 44.53 |
| 2 years | 79 | 12 | 33.34 | 57.90 |
| 3 years | 38 | 3 | 47.74 | 63.17 |
| 4 years | 17 | 1 | 57.73 | 64.20 |
| 5 years | 9 | 1 | 61.67 | 64.66 |
| 6 years | 6 | 0 | 62.69 | 64.68 |
Patients receiving ART
We obtained the probabilities of survival for patients receiving ART by simulating the course of HIV disease using the CEPAC-International model [13]. Because baseline clinical characteristics differed between the prevalent and incident cohorts, mortality rates were derived separately for each cohort. Furthermore, because the baseline clinical characteristics of patients who received ART depended on the duration of time spent awaiting ART, several sets of yearly mortality rates were derived (table A3).
Table A3.
Yearly probability of death for patients who received antiretroviral treatment (ART), according to cohort and time before initiating ART.
| Probability of death, % |
||||||
|---|---|---|---|---|---|---|
| Cohort, no. of years of ART | No wait | 1-year wait | 2-year wait | 3-year wait | 4-year wait | 5-year wait |
| Incident | ||||||
| 1 | 6.15 | 5.09 | 6.51 | 8.53 | 9.97 | 10.74 |
| 2 | 5.13 | 4.67 | 5.07 | 5.77 | 6.36 | |
| 3 | 5.10 | 5.94 | 6.87 | 7.83 | ||
| 4 | 6.73 | 7.75 | 8.48 | |||
| 5 | 8.06 | 8.84 | ||||
| 6 | 9.05 | |||||
| Prevalent | ||||||
| 1 | 5.86 | 8.67 | 10.63 | 11.10 | 11.20 | 11.26 |
| 2 | 4.89 | 5.69 | 6.62 | 7.18 | 7.39 | |
| 3 | 6.59 | 7.82 | 8.80 | 9.48 | ||
| 4 | 8.25 | 9.16 | 10.05 | |||
| 5 | 9.23 | 10.16 | ||||
| 6 | 10.24 | |||||
We obtained the baseline characteristics of patients who had awaited ART for varying durations of time (0−5 years) by simulating the course of disease for patients in the prevalent and incident cohorts while receiving co-trimoxazole prophylaxis only, and recording population characteristics at the end of every year (table A2).
We then simulated the course of disease while receiving ART for each distinct patient population described above, as shown in table A3. The first column indicates the patients' cohort and the number of years that patients had been receiving ART since the initiation of the analysis in 2007. Columns 2 through 7 list the probabilities of death for each patient population, depending on the number of calendar years they waited for treatment.
RESULTS
Figure A1 illustrates the population alive, as a percentage of the total population eligible for ART in each year. As an additional 551,000 patients become eligible for ART each year (the incident cohort), the cumulative percentage of patients alive depends on the speed of treatment scale-up. The change in the slope (from downward to upward) in the rapid-growth and moderate-growth curves reflects improved survival rates over time, compared with the increasing total denominator of patients in need (an additional 551,000 patients yearly). By 2012, the rapid-growth and moderate-growth scenarios result in 67% and 61% of the population alive, respectively, compared with the cumulative eligible number (3,755,000). The constant-growth and zero-growth scenarios result in worse cumulative survival rates, with 42% and 34% of the population alive, respectively.
Figure A1.

Percentage of total patients eligible for antiretroviral therapy (ART) (both those awaiting and those receiving ART) who were alive by year, for each modeled scenario. The cumulative total of all eligible patients is noted below the graph, by year. The changing denominator and rapid increase in access to ART account for the change in slope of the moderate-growth and rapid-growth curves. Nonprioritized cases are indicated with open symbols, and prioritized cases are indicated with solid symbols.
Footnotes
Presented in part: 14th Conference of Retroviruses and Opportunistic Infections (CROI), 25−28 February 2007, Los Angeles, CA (abstract 549); and 2007 HIV/AIDS Implementers' Meeting, 16−19 June 2007, Kigali, Rwanda (abstract 1755).
Potential conflicts of interest: N.M. reports that he manages a President's Emergency Plan for AIDS Relief grant providing antiretroviral treatment. Y.Y. reports no personal funding; he reports that he has served as an investigator for trials with Tibotec Pharmaceutical, and has received travel grants to attend scientific meetings from GlaxoSmithKline, Roche, Boehringer, Bristol-Myers Squibb, Pfizer, Abbot, and Gilead. All other authors report no relevant conflicts of interest.
References
- 1.The Joint United Nations Programme on HIV/AIDS [7 June 2007];2006 Report on the global AIDS epidemic. 2006 Available at: http://www.unaids.org/en/HIV_data/2006GlobalReport/default.asp.
- 2.World Health Organization [8 November 2007];Towards universal access: scaling up priority HIV/AIDS interventions in the health sector. 2007 Available at: http://www.who.int/hiv/mediacentre/univeral_access_progress_report_en.pdf.
- 3.President's Emergency Plan for AIDS Relief [13 November 2007];2007 country profile: South Africa. 2007 Available at: http://www.pepfar.gov/documents/organization/81668.pdf.
- 4.The Global Fund to fight AIDS [7 June 2007];TB, and Malaria: Partners in Impact results report. 2007 Available at: http://www.theglobalfund.org/en/files/about/replenishment/oslo/Progress%20Report.pdf.
- 5.Nattrass N. South Africa's “rollout” of highly active antiretroviral therapy: a critical assessment. J Acquir Immune Defic Syndr. 2006;43:618–23. doi: 10.1097/01.qai.0000242456.05274.fb. [DOI] [PubMed] [Google Scholar]
- 6. [7 June 2007];HIV and AIDS and STI strategic plan for South Africa, 2007–2011 (Draft 9) 2007 Available at: http://www.doh.gov.za/docs/misc/stratplan-f.html.
- 7.World Health Organization [7 June 2007];Progress on global access to HIV antiretroviral therapy: a report on “3 by 5” and beyond. 2006 Available at: http://www.who.int/hiv/fullreport_en_highres.pdf.
- 8.Goldie SJ, Kuhn L, Denny L, Pollack A, Wright TC. Policy analysis of cervical cancer screening strategies in low-resource settings: clinical benefits and cost-effectiveness. JAMA. 2001;285:3107–15. doi: 10.1001/jama.285.24.3107. [DOI] [PubMed] [Google Scholar]
- 9.World Health Organization [7 June 2007];Guidelines on co-trimoxazole prophylaxis for HIV-related infections among children, adolescents and adults. 2006 Available at: http://www.who.int/hiv/pub/guidelines/ctx/en/index.html.
- 10.Johnson M, Grinsztejn B, Rodriguez C. Atazanavir plus ritonavir or saquinavir, and lopinavir/ritonavir in patients experiencing multiple virological failure with prior PI-containing regimen(s): 24-week results from BMS 043. AIDS. 2005;19:685–94. doi: 10.1097/01.aids.0000166091.39317.99. [DOI] [PubMed] [Google Scholar]
- 11.Clotet B, Raffi F, Cooper D. Clinical management of treatment-experienced, HIV-infected patients with the fusion inhibitor enfuvirtide: consensus recommendations. AIDS. 2004;18:1137–46. doi: 10.1097/00002030-200405210-00007. [DOI] [PubMed] [Google Scholar]
- 12.Harries AD, Schouten EJ, Libamba E. Scaling up antiretroviral treatment in resource-poor settings. Lancet. 2006;367:1870–2. doi: 10.1016/S0140-6736(06)68809-0. [DOI] [PubMed] [Google Scholar]
- 13.Goldie S, Yazdanpanah Y, Losina E, et al. Clinical benefits and cost-effectiveness of antiretroviral therapy for human immunodeficiency virus-infected patients in resource-poor settings: the case of Côte d'Ivoire. N Engl J Med. 2006;355:1141–53. doi: 10.1056/NEJMsa060247. [DOI] [PubMed] [Google Scholar]
- 14.Yazdanpanah Y, Losina E, Anglaret X, et al. Clinical impact and cost-effectiveness of co-trimoxazole prophylaxis in patients with HIV/AIDS in Côte d'Ivoire: a trial-based analysis. AIDS. 2005;19:1299–308. doi: 10.1097/01.aids.0000180101.80888.c6. [DOI] [PubMed] [Google Scholar]
- 15.Mellors JW, Muñoz A, Giorgi JV, et al. Plasma viral load and CD4+ lymphocytes as prognostic markers of HIV-1 infection. Ann Intern Med. 1997;126:946–54. doi: 10.7326/0003-4819-126-12-199706150-00003. [DOI] [PubMed] [Google Scholar]
- 16.Holmes CB, Wood R, Badri M, et al. CD4 decline and incidence of opportunistic infections in Cape Town, South Africa: implications for prophylaxis and treatment. J Acquir Immune Defic Syndr. 2006;42:464–9. doi: 10.1097/01.qai.0000225729.79610.b7. [DOI] [PubMed] [Google Scholar]
- 17.Akileswaran C, Lurie MN, Flanigan TP, Mayer KH. Lessons learned from use of highly active antiretroviral therapy in Africa. Clin Infect Dis. 2005;41:376–85. doi: 10.1086/431482. [DOI] [PubMed] [Google Scholar]
- 18.Coetzee D, Hildrebrand K, Boulle A, et al. Outcomes after two years of providing antiretroviral treatment in Khayelitsha, South Africa. AIDS. 2004;18:887–95. doi: 10.1097/00002030-200404090-00006. [DOI] [PubMed] [Google Scholar]
- 19.Delfraissy J-F, Flandre P, Delaugerre C, et al. MONARK trial (monotherapy Antiretroviral Kaletra): 48-week analysis of lopinavir/ritonavir (LPV/r) monotherapy compared to LPV/r + zidovudine/Lamivudine (AZT/3TC) in antiretroviral-naive patients [abstract ThLB0202].. Program and abstracts of the XVI International AIDS Conference.; Toronto, Canada. 2006. [Google Scholar]
- 20.Losina E, Yazdanpanah Y, Deuffic-Burban S, et al. The independent effect of highly active antiretroviral therapy on severe opportunistic disease incidence and mortality in HIV-infected adults in Côte d'Ivoire. Antivir Ther. 2007;12:543–51. [PMC free article] [PubMed] [Google Scholar]
- 21.Badri M, Bekker L-G, Orrell C, Pitt J, Cilliers F, Wood R. Initiating highly active antiretroviral therapy in sub-Saharan Africa: an assessment of the revised World Health Organization scaling-up guidelines. AIDS. 2004;18:1159–68. doi: 10.1097/00002030-200405210-00009. [DOI] [PubMed] [Google Scholar]
- 22.Lawn S, Badri M, Wood R. Tuberculosis among HIV-infected patients receiving HAART: long term incidence and risk factors in a South African cohort. AIDS. 2005;19:2109–16. doi: 10.1097/01.aids.0000194808.20035.c1. [DOI] [PubMed] [Google Scholar]
- 23.Badri M, Wilson D, Wood R. Effect of highly active antiretroviral therapy on incidence of tuberculosis in South Africa: a cohort study. Lancet. 2002;359:2059–64. doi: 10.1016/S0140-6736(02)08904-3. [DOI] [PubMed] [Google Scholar]
- 24.Wood R, Post F. Total lymphocyte count as a surrogate for CD4+ lymphocyte count in African patients coinfected with HIV and tuberculosis. J Acquir Immune Defic Syndr Hum Retrovirol. 1996;11:411–3. doi: 10.1097/00042560-199604010-00016. [DOI] [PubMed] [Google Scholar]
- 25.Badri M, Wood R. Usefulness of total lymphocyte count in monitoring highly active antiretroviral therapy in resource-limited settings. AIDS. 2003;17:541–5. doi: 10.1097/00002030-200303070-00009. [DOI] [PubMed] [Google Scholar]
- 26.World Health Organization [7 June 2007];Scaling up antiretroviral treatment in resource-limited settings: treatment guidelines for a public health approach. 2003 revision. Available at: http://www.who.int/entity/hiv/pub/prev_care/en/arvrevision2003en.pdf.
- 27.South Africa National Department of Health [7 June 2007];National antiretroviral treatment guidelines. 2004 Available at: http://hivinsite.ucsf.edu/doc/cr09-sf-01.doc.
- 28.Dorrington RE, Johnson L, Bradshaw D, T.-J. D. [13 November 2007];The demographic impact of HIV/AIDS in South Africa: national and provincial indicators for 2006. 2006 Available at: http://www.actuarialsociety.co.za/applications/cms/documents/file_build.asp?id=100000148.
- 29.Morgan D, Mahe C, Mayanja B, Okongo JM, Lubega R, Whitworth JA. HIV-1 infection in rural Africa: is there a difference in median time to AIDS and survival compared with that in industrialized countries? AIDS. 2002;16:597–603. doi: 10.1097/00002030-200203080-00011. [DOI] [PubMed] [Google Scholar]
- 30.Walensky RP, Goldie SJ, Sax PE, et al. Treatment for primary HIV infection: projecting outcomes of immediate, interrupted, or delayed therapy. J Acquir Immune Defic Syndr. 2002;31:27–37. doi: 10.1097/00126334-200209010-00004. [DOI] [PubMed] [Google Scholar]
- 31.Actuarial Society of South Africa [9 November 2007];ASSA 2003 summary statistics. 2003. Available at: http://www.actuarialsociety.co.za/applications/cms/documents/file_build.asp?id=100000112.
- 32.Tutu D. New Congress can save lives, or money. [26 November 2007];Washington Post. 2007 January 15; Available at: http://www.washingtonpost.com/wp-dyn/content/article/2007/01/13/AR2007011300496.html.
- 33.The other war. [26 November 2007];Wall Street Journal. 2006 December 29; Available at: http://www.malarianomore.org/media/mnm-wsj-122906.pdf.
- 34.Statistics South Africa [7 June 2007];Mid-year population estimates, South Africa. 2006 Available at: http://www.statssa.gov.za/PublicationsHTML/P03022006/html/P03022006.html.
- 35.World Health Organization [June 7, 2007];Summary country profile for HIV/AIDS treatment scale-up: South Africa. 2005 Available at: http://www.who.int/3by5/support/june2005_zaf.pdf.
- 36. [7 June 2007];International HIV care, treatment, and prevention guidelines: South Africa. Available at: http://hivinsite.ucsf.edu/global?page=cr-00-04#SsfguidelineX.
- 37.Malawi National AIDS Commission [7 June 2007];Guidelines for the use of antiretroviral therapy in Malawi. 2003 Available at: http://www.aidsmalawi.org.mw/resources/ARV%20GUILDELINES.pdf.
- 38. [7 June 2007];Full report of the Joint Health and Treasury Task Team charged with examining treatment options to supplement comprehensive care for HIV/AIDS in the public health sector. 2003 Available at: http://www.info.gov.za/otherdocs/2003/treatment.pdf.
- 39.Gandhi NR, Moll A, Sturm AW, et al. Extensively drug-resistant tuberculosis as a cause of death in patients co-infected with tuberculosis and HIV in a rural area of South Africa. Lancet. 2006;368:1575–80. doi: 10.1016/S0140-6736(06)69573-1. [DOI] [PubMed] [Google Scholar]