

Abstract
Dehydroepiandrosterone (DHEA), a C19 human adrenal steroid, activates peroxisome proliferator-activated receptor α (PPARα) in vivo but does not ligand-activate PPARα in transient transfection experiments. We demonstrate that DHEA regulates PPARα action by altering both the levels and phosphorylation status of the receptor. Human hepatoma cells (HepG2) were transiently transfected with the expression plasmid encoding PPARα and a plasmid containing two copies of fatty acyl coenzyme oxidase (FACO) peroxisome-proliferator activated receptor responsive element consensus oligonucleotide in a luciferase reporter gene. Nafenopin treatment increased reporter gene activity in this system, whereas DHEA treatment did not. Okadaic acid significantly decreased nafenopin-induced reporter activity in a concentration-dependent manner. Okadaic acid treatment of primary rat hepatocytes decreased both DHEA- and nafenopin-induced FACO activity in primary rat hepatocytes. DHEA induced both PPARα mRNA and protein levels, as well as PP2A message in primary rat hepatocytes. Western blot analysis showed that the serines at positions 12 and 21 were rapidly dephosphorylated upon treatment with DHEA and nafenopin. Results using specific protein phosphatase inhibitors suggested that protein phosphatase 2A (PP2A) is responsible for DHEA action, and protein phosphatase 1 might be involved in nafenopin induction. Mutation of serines at position 6, 12, and 21 to an uncharged alanine residue significantly increased transcriptional activity, whereas mutation to negative charged aspartate residues (mimicking receptor phosphorylation) decreased transcriptional activity. DHEA action involves induction of PPARα mRNA and protein levels as well as increased PPARα transcriptional activity through decreasing receptor phosphorylation at serines in the AF1 region.
Peroxisome proliferator-activated receptor α (PPARα, NR1C1) is a member of the nuclear receptor superfamily and functions as a ligand-activated transcription factor (Isseman et al., 1990; Sher et al., 1993). PPARα is expressed in significant levels in human liver, heart, kidney, skeletal muscle, intestine, and pancreas, and it is also detectable in lung, placenta, and adipose tissue (Auboeuf et al., 1997; Mukherjee et al., 1997). Hepatic PPARα mRNA levels have been reported to be lower in humans than in rodents (Palmer et al., 1998). In vivo, PPARα can be activated with peroxisome proliferators (PP), such as fibrate drugs (e.g., Wy-14643, clofibrate), nonfibrate drugs (nafenopin), fatty acids, chlorinated compounds, nonsteroidal anti-inflammatory drugs, and endogenous steroids, such as dehydroepiandrosterone (DHEA) (Escher and Whali, 2000). Most PP serve as ligands for the receptor, and their binding results in ligand-dependent activation of a distinct set of genes involved in lipid metabolism and homeostasis, peroxisome proliferation and cell growth (Rao et al., 1992; Tirona and Kim, 2004). However, ligand-independent processes can also activate these receptors, such as elevated levels of retinoid X receptor α. Shipley and Waxman (2003) have concluded that PP act through mechanisms leading to either direct ligand-activation of the receptor or through perturbation of lipid metabolism/transport, leading to release of PPARα ligands. In addition, several PP have been suggested to also activate mitogen-activated protein kinase (MAPK) pathways, providing three distinct mechanisms of receptor activation (Gardner et al., 2003).
Ligand-activation of the PPARα receptor by DHEA has never been demonstrated in assays using immortalized cell lines, although it is well established that DHEA affects PPARα target genes in vivo, such as cytochrome P450 genes (CYP4A1, CYP2C11) and fatty acyl coenzyme oxidase (FACO) (Wu et al., 1989; Prough et al., 1994, Peters et al., 1996; Ripp et al., 2003).
In this study, we provide evidence that in primary rat hepatocytes, DHEA, nafenopin, and Wy-14643 induce protein and mRNA levels of PPARα and, thereby, PPARα-regulated ω-oxidation of fatty acids. In transiently transfected HepG2 cells and cultured rat hepatocytes, the phosphatase inhibitor okadaic acid also alters regulation by these inducers. In our studies, we sought to test the hypothesis that DHEA increases the levels of PPARα and decreases phosphorylation status of the PPARα receptor in hepatocytes, leading to increased transcriptional activity. This indirect mechanism of activation of PPARα via increases in protein content and decreases in phosphorylation status of the receptor may account for the action of DHEA in regulating this important transcription factor, instead of through direct ligand activation.
Materials and Methods
Chemicals
DHEA was purchased from Steraloids (Newport, RI), and nafenopin was a gift from Novartis (Ardsley, NY). Wy-14643, okadaic acid, and the other biochemicals used were purchased from the Sigma Chemical Co. (St. Louis, MO). Tautomycin was purchased from Calbiochem (La Jolla, CA). Antibodies against rat PPARα, PPARα (phospho S12) antibody, and PPARα (phospho S21) antibody were purchased from Abcam, Inc. (Cambridge, MA).
Plasmids
The luciferase reporter plasmid GSTmin was constructed by isolating 164 base pairs of the minimal promoter from the 5′-flanking region of the rat glutathione transferase A2 gene (Falkner et al., 2001) and inserting it into the HindIII/KpnI sites of pGL3-basic (Invitrogen, Carlsbad, CA). The expression plasmids for the murine PPARα (Boie et al., 1993) were provided by Thomas Rushmore (Merck Research Laboratory, West Point, PA). The luciferase reporter plasmid PPRELuc contained two copies of the peroxisome proliferator responsive element from rat FACO peroxisome proliferator-activated receptor responsive element (PPRE) inserted upstream of the minimal promoter construct GSTmin. The expression plasmid for β-galactosidase (pCMVβ) was purchased from Clontech (Mountain View, CA). All plasmids were transformed into DH5α Escherichia coli bacteria, isolated, and prepared for use in transient transfections using QIAGEN plasmid prep kits (QIAGEN, Valencia, CA).
Treatment of Rats
Male Sprague-Dawley rats (180−200 g; Hsd: SD, Harlan, Indianapolis, IN) were fed a diet of AIN76A diet (Purina, St. Louis, MO) and treated with either 80 mg/kg body weight DHEA or nafenopin daily for 4 days. The animals were anesthetized with carbon dioxide and killed by cervical dislocation. These procedures were approved by the University of Louisville Institutional Animal Care and Use Committee. The livers were flash-frozen in liquid nitrogen and stored at −80°C until mRNA was isolated using TRIzol reagent according to the manufacturer's protocol (Invitrogen, Carlsbad, CA).
Primary Hepatocyte Culture
Male Sprague-Dawley rats (180−200 g; Hsd:SD, Harlan) were used for liver perfusion as described by the method of Bayliss and Skett (1996). Cell survival was determined by trypan blue exclusion (Berry et al., 1991), and hepatocytes having viability greater than 80% were used and were plated at a density of 4 × 10⁶ cells/dish onto 60-mm plastic dishes precoated with collagen in Williams E/Ham's F12 1:1 mixed medium as described by Ferrini et al. (1998) and Isom and Georgoff (1984). After allowing the cells to attach for 4 h, the medium was changed and renewed every 24 h thereafter in the absence of serum. The cells were treated with various concentrations of the following inducers: nafenopin, DHEA, and Wy-14643. Okadaic acid and tautomycin dissolved in DMSO were used as phosphatase inhibitors.
Peroxisomal β-Oxidation of Fatty Acid Activity (FACO)
Cultured rat hepatocytes were collected to measure NADH formation using 0.01 μM palmitoyl-CoA (Sigma) as a substrate as described by Lazarow (1981). Subcellular fractions (5000g supernantant) were diluted in 0.25 M sucrose, and the enzymatic reaction was carried out in a mixture containing the following: 0.2 mM NAD+, 1 mM DTT, 0.1 mM CoA, 0.01 mM FAD, and 1 mM potassium cyanide. Protein concentration was measured using the Bradford assay (Bradford, 1976).
Quantitative Real-Time PCR of mRNA
Total RNA from rat liver or primary hepatocytes was extracted using TRIzol reagent following the manufacturer protocol (Invitrogen, Carlsbad, CA). The genomic DNA was digested with DNase I (Invitrogen), and the RNA was cleaned using an RNeasy mini kit (QIAGEN). Reverse transcription (RT) reactions were carried out in a final volume of 20 μl with 1 μg of rat total RNA, 0.45 μg of random hexamer, 20 U of RNasin, 0.5 μM dNTP mix, and 200 U of Moloney murine leukemia virus reverse transcriptase at 42°C for 1 h (Promega, Madison, WI). The cDNA product was treated to remove RNA and the oligo DNA mixture with RNase H digestion and QIAquick PCR purification kit (Promega). The Taqman reaction was carried out with a DNA sequence detection analyzer (ABI7900; Applied Biosystems, Foster City, CA) in a total volume of 25 μl using 2.2 pmol of reverse and forward primers. The primers used are shown in Table 1. Primers for 18S rRNA (5-carboxyfluorescein-labeled and JOE-labeled) were purchased from Invitrogen.
TABLE 1.
Sequence of primers used for quantitative RT-PCR
| Gene | Base Pair Position | Sequence |
|---|---|---|
| CYP4A1 | 306aFL | 5′-GAACCAAGTGCCTTTCCTCGATGGT[FAM]C-3′ |
| CYP4A1 | 347R | 5′-GCCCGAGAATCACCTTCATGT-3′ |
| Ppp2ca | 552FL | 5′-CGTGACATACTCCGAGGGAATCA[FAM]G-3′ |
| Ppp2ca | 562FL/65 | 5′-CCAAGGCAGTGAGAGAAGGT-3′ |
| rPPAR | Sense | 5′-GTAGGCCCAAGAGAATCCACGAAGCC[FAM]AC |
| rPPAR | Antisense | 5′-AGCCATGCACAAGGTCTCCA-3′ |
Immunoblot Analysis
Hepatocytes were harvested in M-Per reagent (Sigma) supplemented with phosphatase inhibitor cocktail I-II (Sigma) and with Halt protease inhibitor kit (Pierce Chemical, Rockford, IL) according to the manufacturer protocol. Protein (20 μg) was loaded to the gel and run using the method described by Laemmli (1970). Proteins were transferred to polyvinylidene difluoride membranes (Towbin et al., 1979) and rinsed with either anti-rat PPARα, anti-rat PPARα (phospho-ser-12), or anti-rat PPARα (phospho-ser-21) as a primary antibody (Abcam). Enhanced chemiluminescence (ECL detection system; GE Healthcare, Chalfont St. Giles, Buckinghamshire, UK) was used to detect the target protein of interest. The Western blots were scanned with fluorescence scanning using a Storm 860 PhosphorImager, and the immune complexes were quantified with ImageQuant software (GE Healthcare).
Mutation of Serines 6, 12, and 21 of Murine PPARα
Site-directed mutagenesis of PPARα expression vector was performed with the Gene Tailor site-directed mutagenesis kit purchased from Invitrogen. Oligonucleotides for mutagenesis were purchased from Integrated DNA Technologies (Coralville, IA). The following nucleotide sequence changes were performed: for the S12A mutant, codon 12 (TCCser) to (GCCala); for the S21A mutant, codon 21 (AGTser) to (GCTala); for the double mutant S12A-S21A, codon 21 of the S12A mutant (AGTser) to (GCTala); for the triple mutant S6A-S12A-S21A, codon 6 of the S12A-S21A double mutant (AGCser) to (GCCala); for the S12D mutant, codon 12 of the S12A-S21A double mutant (GCCala) to (GACasp); for the S21D mutant, codon 21 of the S12A-S21A double mutant (GCTala) to (GATasp); for the S12D-S21D double mutant, codon 21 of the S12D (GCTala) to (GACasp). Note that the two individual aspartic acid mutants S12D and S21D each had alanine at the other phosphorylation site (S12D is also S21A; S21D is also S12A). The triple serine mutants (S6A-S12A-S21A and S6D-S12D-S21D) were also prepared using this mutation cloning strategy. In each case, the constructs were sequenced in the University of Louisville's Center for Genetics and Molecular Medicine core facility, to assure that the appropriate nucleotide changes had been made.
HepG2 Cell Culture and Transient Transfection
HepG2 cells were cultured in Dulbecco's modified Eagle's medium supplemented with 10% fetal bovine serum and penicillin/streptomycin/Fungizone. Cells were plated in 12-well plates at a cell density of 1.5 × 10⁵ per well. The following day, cells were transiently transfected with various plasmids using LipofectAMINE (Invitrogen, Carlsbad, CA). After transfection, cells were treated at 24 h with several peroxisome proliferators (DHEA, nafenopin, Wy-14643). β-Galactosidase and luciferase activities were determined as described by Falkner et al. (2001). Data are expressed as luciferase activity relative to β-galactosidase activity to correct for transfection efficiency. All transient transfection experiments were performed in triplicate and experiments were performed at least in duplicate.
Statistical Analysis
Experiments were conducted in triplicate or quadruplicate and means ± S.D. were determined. Statistical comparisons among treatment groups were determined using a two-tailed t test, with p < 0.05 as the criterion for significance.
Results
Okadaic Acid Alters Nafenopin-Dependent Induction of PPRELuc Reporter Expression in HepG2 Cells
In our experiments, the role of PPARα phosphorylation was investigated by treatment with different peroxisome proliferators and using protein phosphatase inhibitors. HepG2 cells were transfected with PPARα expression vector in the presence of PPRELuc reporter and treated with various concentrations of okadaic acid (20−40 nM) or 50 μM nafenopin plus okadaic acid for 24 h (Fig. 1). Unexpectedly, okadaic acid itself significantly inhibited the activity of the PPRELuc reporter gene in the absence of cotransfection with the PPARα expression plasmid. PPARα was able to positively regulate the PPRE responsive element, an effect that was reversed with increasing concentration of okadaic acid. In the presence of nafenopin, the activation of the luciferase reporter gene was over 3-fold higher than what was observed in untreated cells. Okadaic acid cotreatment caused a concentration-dependent reversal of nafenopin-induced activation of gene expression under all conditions (Fig. 1).
Fig. 1.
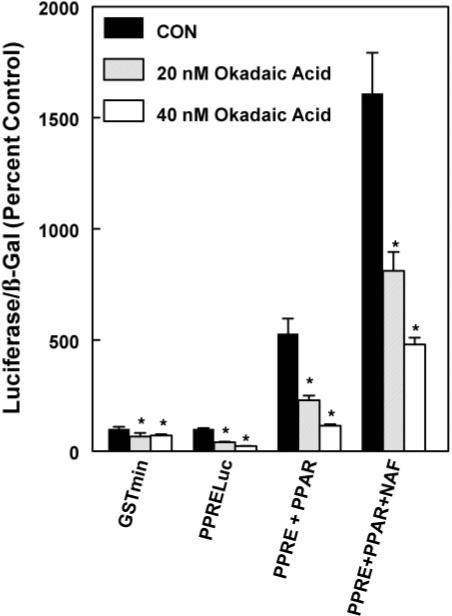
Effect of okadaic acid on activation of a PPARα-dependent FACO luciferase reporter by nafenopin in HepG2 cells. HepG2 cells were treated with various concentrations of okadaic acid in the presence of 50 μM nafenopin and/or expression constructs for PPARα. The luciferase and β-galactosidase were measured as described under Materials and Methods. The values shown are expressed as the average and standard deviation of three separate transient transfection experiments performed in triplicate. Statistical significance: *, p < 0.05
Nafenopin, Wy-14643, and DHEA Induce FACO Activity in Primary Rat Hepatocytes
Based on our previous findings that DHEA does not serve as a direct activator of PPARα to induce PPRE-containing genes in cultured cell lines, but does induce FACO and CYP4A1 mRNA and protein in vivo and in primary cultures of rat hepatocytes, we used primary hepatocytes to evaluate the mechanism of PPARα-dependent induction. Hepatocytes were treated with varying concentrations of DHEA and two other peroxisome proliferators for 48 h. Cell supernatant fractions were obtained by sedimentation at 5000g and FACO activity was measured. Concentrations between 10 and 25 μM of either DHEA, nafenopin, or Wy-14643 caused a 2- to 3.5-fold induction of FACO activity (Fig. 2). Maximal inductive effect was observed at the following concentrations: 25 μM nafenopin (5.5-fold induction), 50 μM Wy-14643 (4-fold induction), and 50 μM DHEA (4-fold induction). These results demonstrate that primary rat hepatocytes display PPARα activation by DHEA to the same level as other PP.
Fig. 2.

Nafenopin, Wy-14643, and DHEA induce FACO activity in primary rat hepatocytes. Primary cultures of rat hepatocytes were treated with various concentrations of inducers for 24 h. As described under Materials and Methods, a 5000g supernatant was collected, and FACO activity was determined using palmitoyl-CoA and NAD+ as substrates. The normalized values shown are expressed as the average and standard deviation of three separate assays performed in triplicate. Significantly different from untreated control. *, p < 0.05; **, p < 0.01.
Effect of Okadaic Acid on Induction of FACO Activity in Primary Cultures of Rat Hepatocytes
To test whether okadaic acid reverses the effect of peroxisome proliferators in primary hepatocytes, cells were pretreated with various concentrations of okadaic acid for 1 h and then treated with 50 μM DHEA for 24 h. Cell supernatant fractions were collected, and FACO activity was measured from cell supernatants. FACO activity was induced approximately 5-fold in DHEA-treated cells relative to control cells. Pretreating cells for 1 h with various concentrations of okadaic acid antagonized the inductive effect of DHEA in a concentration-dependent manner. The suppression by 25 nM okadaic acid reached the level of activity seen in untreated cells (Fig. 3). Similar results were observed with nafenopin (results not shown).
Fig. 3.
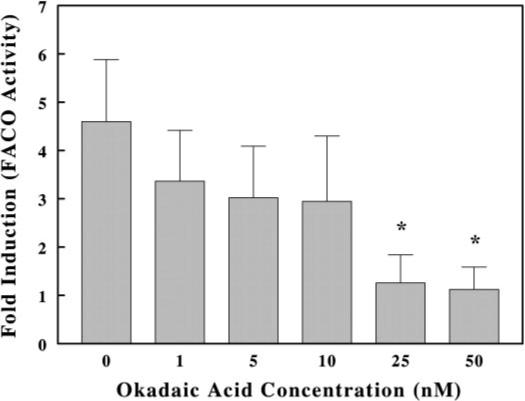
Effect of okadaic acid on induction of FACO activity in cultured rat hepatocytes treated with 50 μM DHEA. Hepatocytes were treated with various concentrations of okadaic acid and 50 μM DHEA for 24 h. FACO activity was determined as described under Materials and Methods. The values shown are expressed as the average and standard deviation of 3 separate assays performed in triplicate. *, p < 0.05.
Effect of DHEA, Nafenopin, and Wy-14643 on PPARα mRNA and Protein Expression in Vivo and in Primary Cultures of Rat Hepatocytes
To verify that these agents altered the levels of PPARα mRNA in vivo, we performed experiments with male Sprague-Dawley rats to demonstrate whether DHEA or nafenopin caused changes in the levels of hepatic PPARα mRNA. The rats were maintained on AIN76A diet and administered i.p. either DHEA or nafenopin in corn oil at a dose of 100 mg/kg body weight daily for 4 days. The mRNA was isolated from liver and analyzed for relative levels of PPARα mRNA using quantitative RT-PCR. As seen in Table 2, DHEA treatment caused a 5.9-fold increase in relative PPARα mRNA levels, whereas nafenopin caused a 30% decrease. Treatment with either DHEA or nafenopin resulted in significant induction of P4504A1, demonstrating that both compounds induced expression of this PPARα target gene. These results document that DHEA does alter the levels of PPARα message in vivo, increasing the mRNA levels by approximately 6-fold; however, Nafenopin did not seem to increase PPARα message levels.
TABLE 2. Relative PPARα mRNA levels in livers of male Sprague-Dawley Rats treated with either DHEA or Nafenopin.
Male Sprague-Dawley rats were maintained on AIN-76A diet and injected i.p. daily for 4 days with corn oil or corn oil containing either DHEA or nafenopin to attain a 100 mg/kg dosage. The rats were euthanized with CO2, and livers were removed to prepare mRNA as described under Materials and Methods. The statistical values are relative to control.
| Treatment Condition | Relative mRNA Expression | P Value |
|---|---|---|
| Control | 100 ± 1 | |
| DHEA | 594 ± 73 | .005 |
| Nafenopin | 69 ± 8 | .05 |
To investigate whether peroxisome proliferators induce the levels of PPARα protein, primary cultures of rat hepatocytes were treated with varying concentrations of DHEA, nafenopin, or WY14643 and receptor mRNA and protein expression was measured. At the protein level, maximal induction by DHEA of 1.5-fold was observed using 10 μM inducer, whereas the cells treated with 25 to 50 μM showed lower PPARα protein levels than those given 10 μM (Fig. 4A). Nafenopin was as potent as DHEA causing a 1.5-fold increase in PPARα levels at 50 μM concentration. Treatment with 50 μM Wy-14643 caused the most pronounced induction of PPARα of 1.7-fold. The levels of PPARα mRNA in primary hepatocytes were also measured after treatment with DHEA, nafenopin, or Wy-14643; all three displayed similar concentration-dependent induction (Fig. 4B) and resulted in a 4- to 5-fold increase in mRNA in the primary hepatocytes cultures.
Fig. 4.

Effect of DHEA, nafenopin, and Wy-14643 on PPARα protein and mRNA expression in primary cultures of rat hepatocytes. A, cells were treated with different concentrations of DHEA, nafenopin and Wy-14643 for 48 h. Cellular protein (20 μg) were analyzed by SDS-PAGE and immunoblotting was performed using anti-PPARα antibody. Images of a representative immunoblot and bar graph of the quantification of scanned blots. B, cells were treated with different concentrations of DHEA, nafenopin, and Wy-14643 (WY) for 24 h. PPARα mRNA was measured by quantitative RT-PCR as described under Materials and Methods. Ribosomal 18S RNA levels were used as normalization standards. The values shown are expressed as the average and S.D. of six separate assays performed in triplicate.
Peroxisome Proliferators Dephosphorylate Serine 12 and 21 of PPARα
Because okadaic acid, a protein phosphatase inhibitor, decreased gene expression, we sought to establish whether DHEA may decrease levels of phosphorylation of PPARα. Primary rat hepatocytes were pretreated with either DMSO or okadaic acid in DMSO for 1 h and then treated with various peroxisome proliferators for 4 h. PPARα phosphorylation status was analyzed by immunoblotting using specific antibodies against monoclonal PPARα phosphoserine 12 and phosphoserine 21. Total PPARα levels were quantitated with a polyclonal antibody against PPARα. It is noteworthy that okadaic acid treatment alone did not cause increased phosphorylation of ser-12, suggesting that the receptor may be maximally phosphorylated under basal conditions (Fig. 5A). A striking decrease in phosphorylation status of serine-12 of around 80% was observed when the cells were treated with DHEA. This effect was partially reversed by okadaic acid pretreatment. Nafenopin also caused a 75% reduction in phosphorylation of the receptor compared with the receptor in untreated cells. In the presence of okadaic acid, a slightly elevated level of phosphorylation was observed (130%). Wy-14643 was less effective than DHEA or nafenopin that it only decreased phosphorylation levels by 40%. Addition of okadaic acid with nafenopin or Wy-14643 only increased phosphorylation to the initial level. This experiment was repeated twice with similar results.
Fig. 5.

Phosphorylation status of serine-12 or serine-21 of PPARα after treatment with peroxisome proliferators. Primary hepatocytes were pretreated with okadaic acid (OA) for 1 h and subsequently treated with 50 μM peroxisome proliferators for 4 h. Cells were collected and the amount of phosphoprotein was determined by immunoblot analysis using an anti-PPARα-phospho-ser-12 antibody. The Images of representative experiments are shown with quantitation of scanned blots. Experiments were performed in duplicate with nearly identical data. A, relative levels of phosphoserine-12 PPARα. B, relative levels of phosphoserine-21 PPARα.
Another serine in the AF-1 region proposed to be phosphor-ylated by action of insulin is serine 21. Upon treatment with DHEA and Wy-14643, the receptor becomes dephosphorylated by approximately 50% or approximately 30% with nafenopin (Fig. 5B). In addition, the levels of dephosphorylation caused by peroxisome proliferators could be prevented by pretreating cells with okadaic acid. In the presence of either DHEA or nafenopin, treatment with okadaic acid caused the level of the phosphoreceptor to be slightly higher than that seen in untreated cells (130−110%). Treatment with Wy-14643 caused a lower level of phosphorylation, but combined treatment with Wy-14643 and okadaic acid did not cause the receptor phosphorylation levels to return toward control levels. Treatment with okadaic acid alone had no effect on the basal level of serine-21 phosphorylation. This experiment was repeated twice with similar results. These results demonstrate that addition of DHEA to cultured rat hepatocytes results in rapid dephosphorylation of serine 12 and serine 21 of PPARα.
Mutation of Phosphorylation Sites in PPARα Receptor Modulates Nafenopin Induction in HepG2 Cells
To test the functionality of the PPARα phosphorylation sites in the AF1 region, mutated PPARα expression vectors were designed. Serine phosphorylation sites at residues 6, 12, and 21 were changed to the apolar alanine residues or the negatively charged aspartic acid residue. HepG2 cells were transfected with the expression plasmid containing the receptor mutated at positions 6, 12, and 21 in the presence of PPRELuc and pCMVβ and were subsequently treated with 50 μM nafenopin or cotreated with nafenopin plus increasing concentrations of okadaic acid for 24 h.
Transfecting the cells with the wild-type receptor resulted in an 3.5-fold induction after nafenopin treatment (data not shown). In the presence of okadaic acid, PPAR-dependent gene expression was less active than after treatment with peroxisome proliferators alone. Mutation from serine to alanine in the position of 6, 12, or 21 significantly increased the transcriptional activity of the receptor (Fig. 6). Mutating all three serine sites (6, 12, and 21) or mutating ser12 to alanine only in the AF-1 region causes a 30 to 40% increase in gene expression. When aspartic acid mutations were introduced at serine 21 or serines 6, 12, and 21, the cells show much less activity (20−30% decrease) after nafenopin induction (Fig. 7). Okadaic acid cotreatment was able to decrease this induction, in a concentration-dependent manner for all mutant PPARαs, suggesting an additional role for other residues in regulation by phosphorylation.
Fig. 6.
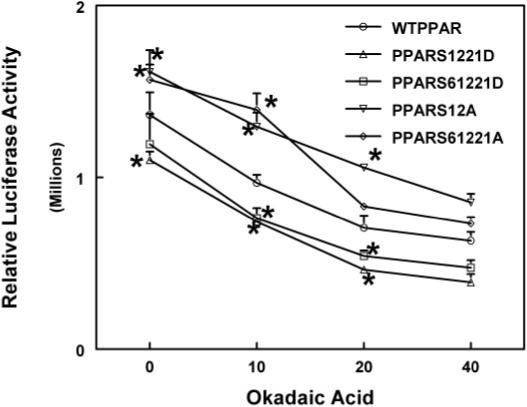
Effect of mutation of serine residues in the AF-1 region of PPARα on transactivation activity. Two alanine [S12A and S6,12,21A] or aspartic acid [S12,21D and S6,12,21D] mutant PPARα expression vectors were prepared as described under Materials and Methods. HepG2 cells were treated with varying concentrations of okadaic acid in the presence of 50 μM nafenopin and/or expression constructs for the mutant, and wild-type PPARα and luciferase and β-galactosidase assays were measured. The values shown are expressed as the average and standard deviation of three separate transient transfection experiments performed in triplicate. *, significantly different from wild type, p < 0.05.
Fig. 7.
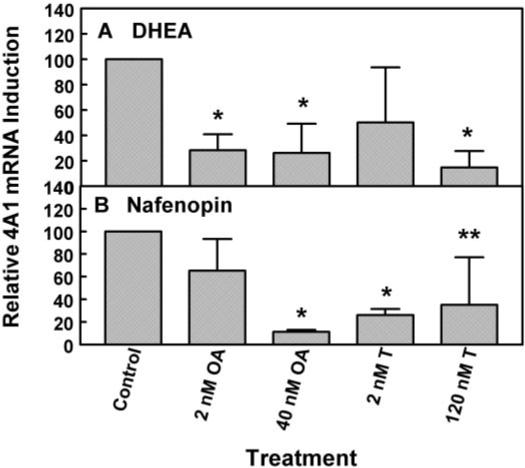
CYP4A1 mRNA induction with DHEA or nafenopin in primary rat hepatocytes after treatment with different phosphatase inhibitors. Cells were pretreated with okadaic acid (OA; 2 or 40 nM) or tautomycin (T; 2 or 120 nM) for 1 h and than treated with either 10 μM DHEA (A) or 50 μM nafenopin (B) for 48 h. CYP4A1 mRNA expression was measured as described under Materials and Methods. Ribosomal 18S RNA levels were used as normalization standards. The values shown are expressed as the average and standard deviation of three separate assays performed in triplicate. All values are relative values to samples treated with peroxisome proliferators only. *, significantly different from control, p < 0.05.
We evaluated the concentration-dependence of activation of the wild-type, S6,12,21A, and S6,12,21D forms of the receptor by nafenopin, Wyeth 14,643, and ciprofibrate in HepG2 cells using the reporter PPRELUC and pCMVβ as a control (data not shown). The maximal level of luciferase expression was greatest with the wild-type PPARα and lowest with the triple and quadruple serine-to-aspartate mutants. However, the concentration to achieve half-maximal activation of the respective receptors was unchanged among the receptor mutants tested (data not shown). These results clearly demonstrate that the mutants that resemble phosphorylated receptor display decreased levels of gene expression.
Protein Phosphatase Inhibitors Modulate CYP4A1 mRNA Induction after Treatment with Peroxisome Proliferators
Based on the hypothesis that peroxisome proliferators can induce PPARα target genes such as CYP4A1 by dephosphorylation of the PPAR receptor, primary rat hepatocytes were treated with specific phosphatase inhibitors such as okadaic acid (IC50 for PP1 is 20−100 nM for PP2A 0.1−1 nM), or tautomycin (IC50 for PP1 is 0.2 nM for PP2A 1−10 nM; Chatfield and Eastman, 2004), followed by treatment with either 10 μM DHEA or 50 μM nafenopin for 48 h (Fig. 7). Okadaic acid at low concentrations (2 nM) caused significant decreases in CYP4A1 induction in cultured rat hepatocytes; the level of inhibition was the same as that seen at 40 nM. However, low concentrations of okadaic acid (2 nM) had little or no effect on nafenopin induction, but higher concentrations, such as 40 nM, almost completely prevented the increase in CYP4A1 mRNA synthesis. Tautomycin (2 nM) was not as effective as okadaic acid in suppressing induction of CYP4A1 message with DHEA but was effective at both concentrations (2 and 120 nM being maximal) in suppressing induction of CYP4A1 mRNA by nafenopin. These data suggest that PP2A is more involved in the DHEA induction of CYP4A1 message than PP1 (Fig. 7). The opposite was observed for nafenopin.
DHEA, but Not Nafenopin, Causes Changes in PP2A mRNA Levels
Primary rat hepatocytes were treated with 10 μM DHEA for 0 to 24 h, and PP2A mRNA was measured. PP2A mRNA increased with time, reaching a 9-fold increase after 8 h (Fig. 8). Thereafter, there was a decline in mRNA levels, possibly because of the low concentration of DHEA used in this experiment. After 8 h, there was a rapid decline in mRNA specific for PP2A, suggesting that this mRNA has a short half-life. These results suggest that DHEA induces PP2A mRNA levels, accounting for the increase in dephosphorylation of serine 12 and serine 21 (Figs. 5, A and B), supporting our results with different phosphatase inhibitors (Fig. 7). Nafenopin treatment (50 μM) did not cause significant changes in PP2A mRNA.
Fig. 8.
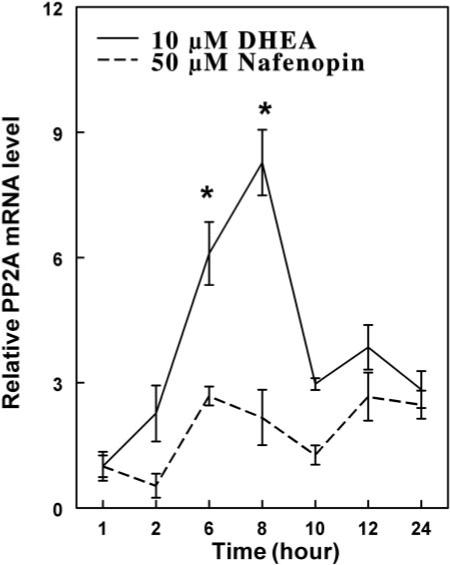
Time-dependent changes in PP2A mRNA levels after treatment with DHEA or nafenopin. Primary rat hepatocytes were treated with 10 μM DHEA or nafenopin for various time periods between 0 and 24 h. PP2A mRNA expression was quantified using quantitative RT-PCR, as described under Materials and Methods. Ribosomal 18S RNA levels were used as normalization standards. The values shown are expressed as the average and standard deviation of three separate assays performed in triplicate. *, p < 0.05.
Discussion
Phosphorylation or dephosphorylation of transcription factors often alters functional activity of that factor. Phosphorylation status of a transcription factor is regulated by action of various kinases and phosphatases, which act in a time-dependent manner (Hunter, 1995). Phosphorylation of nuclear receptors is a major determinant of their transcriptional activity as shown for many nuclear proteins (Sun et al., 1994; Reifel-Miller et al., 1994; Blanquart et al., 2003; Tan et al., 2005). PPARα is also a phosphoprotein, as was shown by Shalev et al. (1996), and its phosphorylation status could be modified by insulin (Juge-Aubry et al., 1999). Indeed, these authors have shown that PPARα is phosphorylated in response to insulin on serine 12 and 21, by action of MAPK pathways leading to increased AF-1 activity of PPARα.
Some peroxisome proliferators, like DHEA, apparently act via PPARα receptor, although not as a direct ligand of the receptor. Our results demonstrate that DHEA treatment elevates PPARα levels in the cell and increases the expression of other proteins involved in regulation of PPARα activation. Besides direct induction of PPARα expression, a second pathway of DHEA action is changing the phosphorylation status of the receptor. In our experiments, okadaic acid, a protein phosphatase inhibitor, reduced PPRE-dependent luciferase activity in nafenopin-treated HepG2 cells, supporting an important role of phosphatases in PPARα action. Okadaic acid also antagonized DHEA induction in primary rat hepatocytes, suggesting that the action of DHEA in inducing PP2A leads to dephosphorylation of PPARα, and the PP2A inhibitor okadaic acid blocks dephosphorylation.
To test the hypothesis that peroxisome proliferators alter phosphorylation status of the receptor, the levels of phosposer-12- and phospo-ser-21-PPARα were determined by Western blot analysis with specific anti-phospho-ser-PPARα antibodies. Both ser-12 and ser-21 are dephosphorylated after treatment with DHEA, and this effect was reversed by okadaic acid. This demonstrated that phosphorylation sites in the AF-1 region of the receptor are important in the regulation with DHEA and perhaps other peroxisome proliferators (Fig. 5, A and B); phosphorylation decreased gene activation, whereas dephosphorylation increased gene activation, as shown in Fig. 9. There seem to be three pathways for activation of PPARα: ligand activation, induction of PPARα levels, and dephosphorylation of PPARα.
Fig. 9.
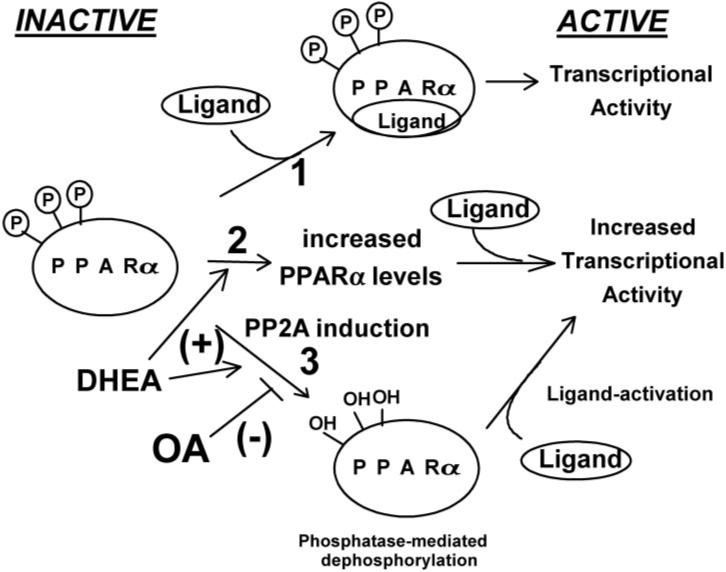
Schematic of three possible pathways for activation of PPARα by peroxisome proliferators. 1) Ligand-induced receptor activation, 2) increased expression of receptor, and 3) dephosphorylation to yield more active transcription factor.
Our results correlate with the work of Passilly et al. (1999), who measured acyl-CoA oxidase activity as a marker gene for PPARα in Fao cells. In their experiments, okadaic acid and vanadate treatment led to decreased acyl-CoA oxidase activity. This negative regulation phenomenon due to phosphorylation status is also observed in PPARγ action; e.g., preadipocytes and adipocytes display similar decreases in PPARγ action, when PPARγ phosphorylation is stimulated by insulin acting through MAPK. The phosphorylation of PPARγ leads to a decrease in PPARγ-mediated preadipocyte differentiation into adipocytes (Zhang et al., 1996; Latruffe et al., 2000). Other phosphorylation pathways stimulated by epidermal growth factor and platelet-derived growth factor acting through MAPK have a negative effect on the PPARγ action (Hu et al., 1996; Adams et al., 1997; Camp and Tafuri, 1997). Additional studies have demonstrated that this negative effect of MAPK was due to the inhibition of ligand binding resulting from an alteration of the three-dimensional structure of the receptor (Shao et al., 1998). Gray et al. (2005) have also demonstrated that protein kinase C is stimulated by the peroxisome proliferators Wy-14,643. Subsequent studies using mutated receptors or overexpressing forms of PKC affected both basal and Wy-14,643–induced PPARα activity. Serine phosphorylation in the DNA binding (C-domain) and hinge (D-domain) were shown to contribute to deceased interaction of PPARα and retinoid X receptor α and therefore DNA binding.
Mutation of PPARα-Ser 6, 12, and 21 sites to alanine, a neutral change in charge to a residue that cannot be phosphorylated, causes an increase in the activity of the receptor after treatment with nafenopin in HepG2 cells, but mutation of serines in the AF-1 region to negatively charged aspartic acid residues, which may mimic the phosphorylated form of the receptor, significantly reduces the transactivation of the gene. It is noteworthy that okadaic acid treatment was still able to reduce the activity after mutating serine residues to alanine, suggesting that other phosphorylation sites may alter activation of PPARα-dependent gene expression. Aspartate mutants (except the Ser12 mutant) were not as sensitive to a phosphatase inhibitor, which demonstrates the importance of the phosphorylation status of these serine sites after nafenopin induction.
Swales and Negishi (2004) reported that transcriptional activity of constitutive androstane receptor is also sensitive to okadaic acid and that this effect could be explained by the action of a specific phosphatase (PP2A), which binds to the receptor after activation and mediates receptor translocation to the nucleus. To investigate the role of phosphatases in PPARα-dependent regulation of rat hepatocytes, changes in CYP4A1 expression were measured after treatment with peroxisome proliferators and specific phosphatase inhibitors. Higher concentrations of okadaic acid (20 −40 nM) are not specific for a certain phosphatase type, but in low concentrations (2 nM), okadaic acid inhibits PP2A, but not members of the PP1 family at this concentration (Chatfield and Eastman, 2004). Tautomycin has an opposite effect; it displays a lower IC50 value for PP1, relative to PP2A. Induction of CYP4A1 message by nafenopin was diminished in the presence of 2 nM tautomycin, but not with 2 nM okadaic acid, suggesting a role for PP1 in activation of gene expression by nafenopin. Induction of CYP4A1 by DHEA was sensitive to low concentrations of okadaic acid, but not for 2 nM tautomycin. This suggests that DHEA induction of CYP4A1 requires PP2A for the receptor dephosphorylation mechanism. Monitoring PP2A mRNA level after DHEA treatment provides further evidence that the sterol induces PPA2 to cause dephosphorylation of the receptor.
In conclusion, peroxisome proliferators such as DHEA regulate PPARα on at least two levels (Fig. 9); they increase PPARα mRNA and protein expression, and they also may change the phosphorylation status of the receptor. Both of these mechanisms result in increases in transcriptional activity of the receptor. However, no evidence exists that DHEA functions as a ligand activator for PPARα in rodents, a third mechanism of receptor regulation.
Acknowledgments
We thank Mary Pendleton for technical assistance in the transient transfection assays and Tom Rushmore and K. Cameron Falkner for expression plasmids.
This work was supported in part by a Predoctoral Fellowship from the Ohio Valley American Heart Association (to K.K.M.), National Research Service Award Fellowship 1F32-ES05927-01 (to S.L.R.) and United States Public Health Service grant DK54774 (to R.A.P.) and the Center for Environmental Genomics and Integrative Biology (1P30-ES014443).
ABBREVIATIONS
- PPARα
peroxisome proliferator-activated receptor α
- PP
peroxisome proliferator
- DHEA
dehydroepiandrosterone
- MAPK
mitogen-activated protein kinase
- FACO
fatty acyl coenzyme oxidase
- Wy-14643
[[4-chloro-6-[(2,3-dimethylamino]-2-pyrimidinyl]thio] acetic acid
- PPRE
peroxisome proliferator-activated receptor responsive element
- RT
reverse transcription
- DMSO
dimethyl sulfoxide
- PP2A
protein phosphatase 2A
- RT
reverse transcription
- PCR
polymerase chain reaction.
References
- Adams M, Reginato MJ, Shao D, Lazar MA, Chatterjee VK. Transcriptional activation by peroxisome proliferator-activated receptor γ is inhibited by phosphorylation at a consensus mitogen-activated protein kinase site. J Biol Chem. 1997;272:5128–5132. doi: 10.1074/jbc.272.8.5128. [DOI] [PubMed] [Google Scholar]
- Auboeuf D, Riusset J, Fajas L, Vallier P, Frering V, Riou JP, Staels B, Auwerx J, Laville M, Vidal H. Tissue distribution and quantification of the expression of mRNAs of peroxisome proliferators-activated receptors and liver X receptor alpha in humans; no alteration in adipose tissue of obese and NIDDM patients. Diabetes. 1997;46:1319–1327. doi: 10.2337/diab.46.8.1319. [DOI] [PubMed] [Google Scholar]
- Bayliss KM, Skett P. Isolation and culture of human hepatocytes. In: Jones GE, editor. Human Cell Culture Protocols. Humana Press, Inc.; Totowa, NJ: 1996. pp. 369–390. [DOI] [PubMed] [Google Scholar]
- Berry MN, Edwards AM, Barritt GJ, Grivell MB, Halls HJ, Gannon BJ, Friend DS. Isolated hepatocytes. In: Burdon R, Van Knippenbur P, editors. Isolated Hepatocytes: Preparation, Properties, and Application. Elsevier Science B.V.; Amsterdam: 1991. pp. 45–47. [Google Scholar]
- Blanquart C, Barbier O, Fruchart JC, Staels B, Glineur C. Peroxisome proliferator-activated receptors: regulation of transcriptional activities and roles in inflammation. J Steroid Biochem Mol Biol. 2003;85:267–273. doi: 10.1016/s0960-0760(03)00214-0. [DOI] [PubMed] [Google Scholar]
- Boie Y, Adam M, Rushmore TH, Kennedy BP. Enantioselective activation of the peroxisome proliferator-activated receptor. J Biol Chem. 1993;268:5530–5534. [PubMed] [Google Scholar]
- Bradford MM. A rapid and sensitive method for the quantitation of microgram quantities of protein utilizing the principle of protein-dye binding. Anal Biochem. 1976;72:248–254. doi: 10.1006/abio.1976.9999. [DOI] [PubMed] [Google Scholar]
- Camp HS, Tafuri SR. Regulation of peroxisome proliferator-activated receptor γ activity by mitogen-activated protein kinase. J Biol Chem. 1997;272:10811–10816. doi: 10.1074/jbc.272.16.10811. [DOI] [PubMed] [Google Scholar]
- Chatfield K, Eastman A. Inhibitors of protein phosphatases 1 and 2A differentially prevent intrinsic and extrinsic apoptosis pathways. Biochem Biophys Res Commun. 2004;323:1313–1320. doi: 10.1016/j.bbrc.2004.09.003. [DOI] [PubMed] [Google Scholar]
- Escher P, Wahli W. Peroxisome proliferators activated receptors: insight into multiple cellular functions. Mutat Res. 2000;448:121–138. doi: 10.1016/s0027-5107(99)00231-6. [DOI] [PubMed] [Google Scholar]
- Falkner KC, Pinaire JA, Xiao GH, Geoghegan TE, Prough RA. Regulation of the rat glutathione S-transferase A2 gene by glucocorticoids: involvement of both the glucocorticoid and pregnane X receptors. Mol Pharmacol. 2001;60:611–619. [PubMed] [Google Scholar]
- Ferrini JB, Ourlin JC, Pichard L, Fabre G, Maurel P. Human hepatocyte culture. In: Phillips IR, Shephard EA, editors. Cytochrome P450 Protocols. Humana Press; Totowa, NJ: 1998. pp. 341–352. [Google Scholar]
- Gardner OS, Dewar BJ, Earp HS, Samet JM, Graves LM. Dependence of peroxisome proliferator-activated receptor ligand-induced mitogen-activated protein kinase signaling on epidermal growth factor receptor transactivation. J Biol Chem. 2003;278:46261–46269. doi: 10.1074/jbc.M307827200. [DOI] [PubMed] [Google Scholar]
- Gray JP, Burns KA, Leas TL, Perdew GH, Vanden Heuvel JP. Regulation of peroxisome proliferator-activated receptor alpha by protein kinase C. Biochemistry. 2005;44:10313–10321. doi: 10.1021/bi050721g. [DOI] [PubMed] [Google Scholar]
- Hu ED, Kim JB, Sarraf P, Spiegelman BM. Inhibition of adipogenesis through MAP kinase-mediated phosphorylation of PPARα. Science. 1996;274:2100–2103. doi: 10.1126/science.274.5295.2100. [DOI] [PubMed] [Google Scholar]
- Hunter T. Protein kinases and phosphatases: the Yin and yang of protein phosphorylation and signaling. Cell. 1995;80:225–236. doi: 10.1016/0092-8674(95)90405-0. [DOI] [PubMed] [Google Scholar]
- Isom HC, Georgoff I. Quantitative assay for albumin-producing liver cells after simian virus 40 transformation of rat hepatocytes maintained in chemically defined medium. Proc Natl Acad Sci U S A. 1984;81:6378–6382. doi: 10.1073/pnas.81.20.6378. [DOI] [PMC free article] [PubMed] [Google Scholar]
- Isseman I, Green S. Activation of a new member of the steroid receptor superfamily by peroxisome proliferators. Nature. 1990;347:545–650. doi: 10.1038/347645a0. [DOI] [PubMed] [Google Scholar]
- Juge-Aubry CE, Hammar E, Siegrist-Kaiser C, Pernin A, Takeshita A, Chin WW, Burger AG, Meier CA. Regulation of the transcriptional activity of the peroxisome proliferator activated receptor α by phosphorylation of ligand-independent transactivating domain. J Biol Chem. 1999;274:10505–10510. doi: 10.1074/jbc.274.15.10505. [DOI] [PubMed] [Google Scholar]
- Laemmli UK. Cleavage of structural proteins during the assembly of the head of bacteriophage T4. Nature. 1970;227:680–685. doi: 10.1038/227680a0. [DOI] [PubMed] [Google Scholar]
- Latruffe N, Cherkaoui MM, Nicolas-Frances V, Clemencet M-C, Jannin B, Berlot J-P. Regulation of the peroxisomal β-oxidation dependent pathway by peroxisome proliferator-activated receptor and kinases. Biochem Pharmacol. 2000;60:1027–1032. doi: 10.1016/s0006-2952(00)00416-0. [DOI] [PubMed] [Google Scholar]
- Lazarow PB. Assay of peroxisomal beta-oxidation of fatty acids. Methods Enzymol. 1981;72:315–319. doi: 10.1016/s0076-6879(81)72021-4. [DOI] [PubMed] [Google Scholar]
- Mukherjee R, Jow L, Croston GE, Patemiti JR., Jr Identification characterization, and tissue distribution of human peroxisome proliferators-activated receptor (PPAR) isoforms PPARγ2 versus PPARγ1 and activation with retinoid X receptor agonists and antagonists. J Biol Chem. 1997;272:8071–8076. doi: 10.1074/jbc.272.12.8071. [DOI] [PubMed] [Google Scholar]
- Palmer CNA, Hsu M-H, Griffin KJ, Raucy JL, Johnson EF. Peroxisome proliferators-activated receptor α expression in human liver. Mol Pharmacol. 1998;53:14–22. [PubMed] [Google Scholar]
- Passilly P, Schohn H, Jannin B, Cherkaoui-Malki M, Boscoboinik D, Dauca M, Latruffe N. Phosphorylation of peroxisome proliferator-activated receptor alpha in rat Fao cells and stimulation by ciprofibrate. Biochem Pharmacol. 1999;58:1001–1008. doi: 10.1016/s0006-2952(99)00182-3. [DOI] [PubMed] [Google Scholar]
- Peters JM, Zhou YC, Ram PA, Lee SS, Gonzalez FJ, Waxman DJ. Peroxisome proliferator-activated receptor α required for gene induction by dehydroepiandrosterone-3 β-sulfate. Mol Pharmacol. 1996;50:67–74. [PubMed] [Google Scholar]
- Prough RA, Webb SJ, Wu HQ, Lapenson DP, Waxman DJ. Induction of microsomal and peroxisomal enzymes by dehydroepiandrosterone and its reduced metabolites in rats. Cancer Res. 1994;54:2878–2886. [PubMed] [Google Scholar]
- Rao S, Subbarao V, Yeldandi SV, Reddy JK. Hepatocarcinogenicity of dehydroepiandrosterone in the rat. Cancer Res. 1992;52:2977–2979. [PubMed] [Google Scholar]
- Reifel-Miller A, Calnek DS, Grinnell BW. Tyrosine phosphorylation regulates the DNA binding activity of a nuclear factor 1-like repressor protein. J Biol Chem. 1994;269:23861–23864. [PubMed] [Google Scholar]
- Ripp SL, Falkner KC, Pendleton ML, Tamasi V, Prough RA. Regulation of CYP2C11 by dehydroepiandrosterone and peroxisome proliferators: identification of the negative regulatory region of the gene. Mol Pharmacol. 2003;64:113–122. doi: 10.1124/mol.64.1.113. [DOI] [PubMed] [Google Scholar]
- Shalev A, Siegrist-Kaiser CA, Yen PM, Wahli W, Burger AG, Chin WW, Meier CA. The peroxisome proliferators-activated receptor α is a phosphoprotein: regulation by insulin. Endocrinology. 1996;137:4499–4502. doi: 10.1210/endo.137.10.8828512. [DOI] [PubMed] [Google Scholar]
- Shao DL, Rangwala SM, Bailey ST, Krakow SL, Reginato MJ, Lazar MA. Interdomain communication regulating ligand binding by PPAR-γ. Nature. 1998;396:377–380. doi: 10.1038/24634. [DOI] [PubMed] [Google Scholar]
- Sher T, Yi HF, McBride OW, Gonzalez FJ. cDNA cloning chromosomal mapping and functional characterization of the human peroxisome proliferators activated receptor. Biochemistry. 1993;32:5598–5604. doi: 10.1021/bi00072a015. [DOI] [PubMed] [Google Scholar]
- Shipley JM, Waxman DJ. Down-regulation of STAT5b transcriptional activity by ligand-activated peroxisome proliferator-activated receptor (PPAR)α and PPARγ. Mol Pharmacol. 2003;64:355–364. doi: 10.1124/mol.64.2.355. [DOI] [PubMed] [Google Scholar]
- Sun P, Enslen H, Myung PS, Mauer RA. Differential activation of CREB by Ca+/calmodulin-dependent protein kinases type II and type IV involves phosphorylation of a site that negatively regulates activity. Genes Dev. 1994;8:2527–2539. doi: 10.1101/gad.8.21.2527. [DOI] [PubMed] [Google Scholar]
- Swales K, Negishi M. CAR, driving into the future. Mol Endocrinol. 2004;18:1589–1598. doi: 10.1210/me.2003-0397. [DOI] [PubMed] [Google Scholar]
- Tan SN, Michalik L, Desvergne B, Wahli W. Multiple expression control mechanisms of peroxisome proliferator-activated receptors and their target genes. J Steroid Biochem Mol Biol. 2005;93:99–105. doi: 10.1016/j.jsbmb.2004.12.025. [DOI] [PubMed] [Google Scholar]
- Tirona RG, Kim RB. Nuclear receptors and drug disposition gene regulation. J Pharm Sci. 2005;94:1169–1186. doi: 10.1002/jps.20324. [DOI] [PubMed] [Google Scholar]
- Towbin H, Staehelin T, Gordon J. Electrophoretic transfer of proteins from polyacrylamide gels to nitrocellulose sheets: procedure and some applications. Proc Natl Acad Sci U S A. 1979;76:4350–4354. doi: 10.1073/pnas.76.9.4350. [DOI] [PMC free article] [PubMed] [Google Scholar]
- Wu HQ, Masset-Brown J, Tweedie DJ, Milewich L, Frenkel RA, Martin-Wixtrom C, Estabrook RW, Prough RA. Induction of microsomal NADPH-cytochrome P450 IVA1 (P450-LAù) by dehydroepiandrosterone in rats: A possible peroxisomal proliferators. Cancer Res. 1989;49:2337–2343. [PubMed] [Google Scholar]
- Zhang B, Berger J, Zhou G, Elbrecht A, Biswas S, White-Carrington S, Szalkowski D, Moller DE. Insulin and mitogen-activated protein kinase-mediated phosphorylation and activation of peroxisome proliferator-activated receptor gamma. J Biol Chem. 1996;271:31771–31774. doi: 10.1074/jbc.271.50.31771. [DOI] [PubMed] [Google Scholar]