

Abstract
Maternal aggression is directed towards intruders by lactating females and is critical for defense of offspring. Within-family selection for increased maternal defense in outbred house mice (Mus domesticus; Hsd:ICR strain) was applied to one selected (S) line, using total duration of attacks a 3-min test as the selection criterion. One control (C) line was maintained and both lines were propagated by 13 families in each generation. Prior to selection, heritability of maternal aggression was estimated to be 0.61 based on mother-offspring regression. Duration of attacks responded to selection with a mean realized heritability of 0.40 (corrected for within-family selection) after eight generations. At generation five, the S and C line also differed significantly for litter size at birth and at mid-lactation (both lower in S), average individual pup mass at mid-lactation (higher in S), and pup retrieval latency (longer in S), but not for other maternal measures that we studied (e.g., dam mass). Additionally, number of entries to middle and closed plus maze compartments was significantly higher in S mice in Generation 5. This is the first study to select for high maternal defense and these mice will be made available as a tool for understanding the genetic and neural basis of maternal aggression.
Keywords: aggression, anxiety, fear, maternal aggression, maternal defense, mice, selective breeding
INTRODUCTION
Maternal defense of offspring (also termed maternal aggression) is a key characteristic of extant birds and mammals, and is widely presumed to be a highly adaptive behavior. In rodents, maternal aggression typically includes fierce attacks against intruders by lactating females and is thought to play a critical role in keeping offspring safe from potential attackers (Agrell et al., 1998; Parmigiani et al., 1999; Wolff, 1985; Wolff, 1993). Various strains of laboratory house mice exhibit maternal aggression (Gammie et al., 2003; Gammie and Nelson, 2001; Svare et al., 1981; Svare and Gandelman, 1973), indicating that this is a robust behavior.
Many studies have examined the basis of maternal defense, but to date only a few genetic approaches have been used. For example, studies of maternal aggression in knockout mice have been useful in identifying genes that may contribute to the behavior (Del Punta et al., 2002; Gammie et al., 2005; Gammie and Nelson, 1999; Stowers et al., 2002). Also, one study of quantitative trait loci identified chromosomal regions that corresponded with levels of maternal behavior, including aggression (Peripato et al., 2002), but the actual genes contributing to the phenotype have not yet been isolated.
Selective breeding has been used in a number of studies to help elucidate the genetic basis of aggressive behaviors. For example, mice have been selected for high intermale (Sandnabba, 1996; van Oortmerssen and Bakker, 1981) and high interfemale (not maternal) aggression (Hyde and Sawyer, 1980). However, to date, no selection study has targeted maternal defense. The aim of these experiments was to use a within-family selection design to increase levels of maternal aggression in outbred mice. We present mother-offspring regression to estimate heritability of maternal aggression in the base population, and also realized heritability after eight generations of selective breeding. Further, we examined traits that might be hypothesized to correlate (positively or negatively) with high aggression, including pup number (litter size), pup mass, pup retrieval, dam mass, and levels of anxiety in the dam using one indirect measure, the elevated plus maze. An important goal of this study was to produce a line a mice that would continue to provide a unique opportunity for examining the genetic and neural basis of maternal aggression.
MATERIALS AND METHODS
Animal Husbandry
Outbred Hsd:ICR (also known as CD-1) (Harlan, Madison, WI) strain house mice (Mus domesticus) were used as the founder population and for intruder males. All focal mice were given ad lib access to Harlan Teklad Mouse Breeder Diet 7004 (Harlan) and tap water. For breeding in all generations (see additional selection details below), females were singly housed with a male mouse from the same group. Following impregnation (~2 weeks), each female mouse was housed individually for the remainder of the study. Just prior to parturition, dams were given precut squares of compressed paper for nesting material. Polypropylene cages were changed once weekly, but after parturition cages were not changed until maternal aggression or elevated plus maze testing was complete. Mice were weaned at 21 days of age and same-sex siblings were group housed (4/cage) until pairing occurred between 40 and 60 days of age. Intruder male mice (~ 2 months old) used in aggression testing were sexually naïve, group-housed (4/cage), and not directly related to test mice. Intruder mice were purchased from vendor (Harlan) in separate batches from original focal mice used for selection or control groups. Intruder males from the same cage were used to test both S and C mice. Intruder males were given ad lib access to regular chow. All animals were housed on a 14:10 light/dark cycle with lights on at 0600 CST. All procedures were approved by the Institutional Animal Care and Use Committee at the University of Wisconsin.
Artificial Selection
Twenty-six male and twenty-six female outbred Hsd:ICR mice were purchased from Harlan with the stipulation that no two mice be siblings. For Generation -1, an equal number of mice were randomly assigned to either the control (C) or selected (S) line (Fig. 1). For Generation -1, thirteen females from each group were then assigned a specific family number (1–13), so that within-family selection could be conducted (Fig. 1). Within-family selection began for S mice beginning in Generation 0. For a given family (e.g., family #1 of S mice), all sibling dams were tested in Generation 0, but only the daughters from the one sister with the highest levels of maternal aggression were mated and tested for aggression in the next generation. Although three measures of maternal aggression were determined (described below), total duration of attacks (also termed time aggressive) was used as the selection criterion. (Number of attacks correlates highly with duration of attacks and hence could have been used as the selection criterion. However, latency to attack as a selection criterion could have allowed for selection of traits not specific to overall levels of aggression per se, such as locomotor quickness. Also, for a subset of mice, a quick attack can be followed by relative quiescence. Therefore, selecting for quick-attacking mice in many cases would not have resulted in selection of mice with the highest duration of attacks.) The daughters of the selected mouse then became the test females for Generation 1 for a given family. For C mice, each generation a dam was randomly chosen and her offspring were paired to be examined in the subsequent generation.
Figure 1.
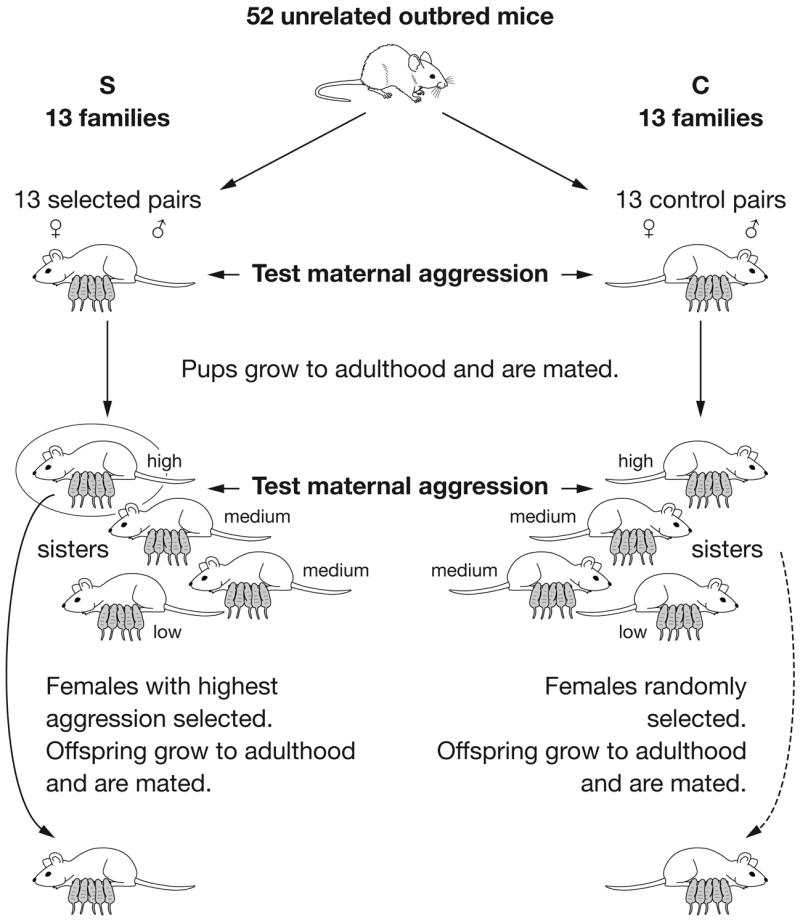
Diagram of within-family selection paradigm used to select for high maternal aggression. In some generations, only a subset of all offspring C mice were tested.
For Generation 0 and subsequent generations, the following stipulations were also used. Pairings only occurred between mice from the same group (e.g., S), but were done such that all the sisters from a given family (e.g., family #1) were paired with brothers from a different family (e.g. family #7). No sibling-sibling pairings ever occurred. The males for all pairings were brothers of the sisters that were assigned to the next generation. For this design, for each generation, the pairings between members of different families (in both S and C groups) were randomly chosen.
Maternal Aggression Testing
On either postpartum Day 4, 5 or 6, each dam was exposed to a novel unrelated intruder male for 3 min in her home cage between 0900 and 1400 h. The pups were removed from the cage just prior to the behavioral test. Removal of the pups from a dam just before an aggressive test does not diminish the expression of maternal aggression in mice (Svare et al., 1981). The days of testing (postpartum Day 4 – 6) occurred within the window of peak maternal aggression that occurs from postpartum Day 4 though 10 in mice (Svare, 1990). An intruder male mouse (unrelated to focal mice) was placed in the dam’s home cage and each test session was recorded on videotape and subsequently analyzed off-line to quantify maternal aggression. Intruder males were never used more than once per day and were used for ~ 3 tests each. Maternal aggression scoring was conducted by individuals blind to experimental conditions and treatments. For quantification of maternal aggression the following features were measured: latency to first attack, number of attacks, and total duration of attacks (Gammie et al., 2000; Gammie and Nelson, 1999). For Generation 5, the amount of time attacking different regions of the male (including head/neck, flank/back, or a combination of these two general regions) was also recorded. At the completion of each test in Generation 5, the pups were randomly scattered in the home cage and the time to retrieve the first and fourth pup to the nest site was recorded. Pup retrieval testing lasted for a maximum of 2 min.
Elevated Plus Maze Testing
The plus-maze apparatus was made of black Plexiglas and had two open arms (35 × 5 cm) and two enclosed arms of the same size with walls 15 cm high. The apparatus was elevated 70 cm above the ground. The arms were connected by a central square (5 × 5 cm). Indirect lighting from a 25 W incandescent bulb was used in an otherwise dark room. All testing for Generation 5 was conducted on the day following the aggression test between 1200 and 1500 h. Mice were tested individually in 5 min sessions. Each mouse was removed from the home cage (pups were left in the cage) and placed on the center platform facing an open arm to initiate the test session. Behaviors scored were latency to enter open arm; number of entries to open arm, closed arm and middle square; and time spent in open arms, closed arms, and middle square of the plus maze. Arm entries were defined as entry of all four paws into the arm. All tests were videotaped and scored off-line by individuals blind to treatment.
Data Analysis
In the case of time to first attack (latency), if an animal was not aggressive (no aggression shown during the test period), then a time of 180 sec was assigned (the maximum possible for the test). For mice that did not retrieve, a score of 120 sec was assigned (the maximum possible for the test). A nested analysis of variance (ANOVA) using Type 3 Tests of Fixed Effects in the SAS (SAS Institute, Cary, NC) MIXED procedure (version 8) was used to compare S and C lines. Family was considered as a random effect nested within line (S versus C), and so the denominator degrees of freedom for determining significance levels (P values) from the F statistics were based on the number of families tested rather than the total number of individuals. All traits were transformed as needed to improve normality of residuals from the nested ANOVAs. Because pup number varied among individuals, it was also included as a continuous covariate in analyses of aggressive behaviors. Although culling of pups in these studies could have been employed to minimize effects of litter size on aggression, removal of a subset of pups would have directly affected the within-family selection paradigm, so this approach was not used. Sex ratios did not differ between S and C mice and sex ratio did not correlate with aggressiveness in either group, so this variable was not used as covariate in analyses.
Initial and Realized Heritability
To estimate heritability in the base population, the average values of maternal aggression in offspring of Generation 0 were regressed on the values for their mothers from generation -1, and the slope was doubled. To determined realized heritability across generations 1–8, the selection differential was first determined for each generation. This differential was the difference between the aggression score for the individual selected for the next generation versus the mean from that given family for the same generation. This number was then divided by two because only selection on females occurred. The differential mean was then determined using data points from each of the 13 S families and then divided by the response to selection. Response to selection was defined as the actual difference in mean duration of attacks between S and C mice for the generation following selection.
Using an established approach (Lynch, 1980; Swallow et al., 1998), the estimate of realized heritability from regression was also adjusted for within-family selection by the following formula:
where h2 is that expected from mass selection or a randomly mating population, h2R is the realized heritability obtained from a within-family selection protocol, r is the coefficient of relationship of full sibs (0.5), and t is the intraclass correlation of full sibs for maternal aggression. The intraclass correlation for duration of attacks (untransformed) was calculated as the among-family component of variance divided by the sum of the among-family plus the within-family components of variance. Variance components were estimated with procedure VARCOMP (REML estimation) in SPSS for Windows version 11.5, based on generation 0 values for the 13 families designated to become the selected line (number of sibs tested per family ranged from 3 to 9, with a mean of 5.6). From this set of animals, the intraclass correlation was estimated as 0.12246.
RESULTS
Response to Selection
For Generations -1 and 0, no significant differences existed between S and C mice in terms of mean duration of attacks, F(1,24) = 0.01, p = 0.94 and F(1,24) = 0.42, p = 0.52, respectively (Fig. 2A). For other measures of maternal defense, including time to first attack and number of attacks, no differences existed between groups for Generations -1 and 0 (Figs. 2B–C).
Figure 2.

Mean levels of aggression in S (black circles) and C (white circles) mice over 8 generations of selection. A) mean duration of attacks (time aggressive) in a 3 min test. B) mean number of attacks. C) mean latency to first attack. D) mean number of pups per dam per generation. Significant differences between the S and C lines are indicated by asterisks. * = p < 0.05; ** = p < 0.01; *** = p < 0.001 (see Methods for statistical methods used). All means were back-transformed from LSMEANS computed by SAS.
The change in mean duration of attacks (the dependent measure used for selection), number of attacks and time to first attack across 5 generations of selection are shown in Fig. 2. Significantly higher levels of mean duration of attacks (time aggressive) for S versus C mice were first detected in Generation 2, F(1,24) = 7.27, p = 0.012. These differences were not significant in Generation 3, F(1,23) = 2.14, p = 0.15, but again reached significance for Generation 4, F(1,24) = 29.24, p = 0.001, and Generations 5–8 (Fig. 2A; Table I). Likewise, number of attacks was significantly higher in S mice in Generation 2, F(1,24) = 7.79, p = 0.01, Generation 4, F(1,24) = 29.26, p = 0.001, and Generations 5–8 (Fig. 2B; Table I). Latency to first attack was significantly shorter for S mice in Generations 4, F(1,24) = 23.81, p = 0.001, and 5–8 (Fig. 2C; Table I).
Table I.
Statistical comparison of aggression profiles (and litter size) for dams in the Selected and Control lines from Generations 5–8. Transformations used to improve normality are indicated. Values are least squares means and corresponding standard errors as computed in SAS using a nested ANOVA (see Methods for more details), and are for transformed data. See Fig. 2 for back-transformed means.
| Trait examined | Transform | Control | Selected | F1,23 | P |
|---|---|---|---|---|---|
| Time aggressive (sec) (Gen 5) | power 0.7 | 2.68 ± 0.94 | 7.12 ± 0.86 | 11.9 | 0.002 |
| Time aggressive (sec) (Gen 6) | power 0.4 | 1.41 ± 0.25 | 2.69 ± 0.22 | 14 | 0.001 |
| Time aggressive (sec) (Gen 7) | power 0.5 | 1.71 ± 0.32 | 3.81 ± 0.29 | 23 | <0.001 |
| Time aggressive (sec) (Gen 8) | power 0.5 | 2.68 ± 0.97 | 3.87 ± 0.31 | 15.9 | <0.001 |
| Number of attacks (Gen 5) | power 0.7 | 1.93 ± 0.36 | 5.02 ± 0.61 | 9.6 | 0.005 |
| Number of attacks (Gen 6) | power 0.6 | 1.81 ± 0.33 | 3.58 ± 0.28 | 16.1 | <0.001 |
| Number of attacks (Gen 7) | power 0.7 | 2.09 ± 0.45 | 5.32 ± 0.39 | 28.6 | <0.001 |
| Number of attacks (Gen 8) | power 0.7 | 2.36 ± 0.47 | 5.40 ± 0.39 | 24 | <0.001 |
| Attack latency (sec) (Gen 5) | power 0.2 | 2.48 ± 0.10 | 2.01 ± 0.09 | 10.9 | 0.003 |
| Attack latency (sec) (Gen 6) | power 0.5 | 10.1 ± 0.69 | 6.60 ± 0.63 | 14.3 | <0.001 |
| Attack latency (sec) (Gen 7) | power 0.3 | 3.70 ± 0.16 | 2.83 ± 0.14 | 15.7 | <0.001 |
| Attack latency (sec) (Gen 8) | power 0.3 | 3.66 ± 0.18 | 2.66 ± 0.15 | 17.4 | <0.001 |
| Number of pups (Gen 5) | power 2.0 | 202.9 ± 12.5 | 159.7 ± 11.3 | 6.52 | 0.017 |
| Number of pups (Gen. 6) | power 1.5 | 45.5 ± 2.38 | 42.10 ± 2.21 | 1.15 | 0.294 |
| Number of pups (Gen. 7) | power 1.8 | 112.5 ± 6.70 | 92.5 ± 5.8 | 5.04 | 0.034 |
| Number of pups (Gen. 8) | power 3 | 2638 ± 152 | 2089 ± 131 | 7.43 | 0.018 |
When pup number was used as a covariate in analysis, it had little effect on differences observed. For example, for Generations 5 and 8, for total duration of attacks the p-values for comparing the Selected and Control line were: 0.0021 (unadjusted nested ANOVA) versus 0.0025 (with pups as covariate, P = 0.9500) (Gen. 5) and 0.0005 (unadjusted nested ANOVA) versus 0.0006 (with pups as covariate, P = 0.9308) (Gen. 8).
In terms of sites of attacks, no differences were observed between groups (data not shown). Overall, for both S and C mice, the breakdown of attacks was approximately as follows: 12% to the belly, 62% to the flank/back, 22% to the head/neck region, and 3% lunges.
Pup Numbers, Pup Retrieval, Pup and Dam Mass, and Latency to Give Birth following Pairing with Male
As shown in Fig. 2D, pup number (litter size at birth and mid-lactation) differed between S and C mice in Generations 5, 7, and 8 (Fig. 2D and Table I). Litter sizes were constant for both S and C mice from birth through mid-lactation.
In terms of time to retrieve first pup, S mice exhibited significantly longer latencies relative to C mice (Table II). Because almost no S or C mice had retrieved the fourth pup within the 2 min window, this measure was not analyzed. Mean individual pup mass was significantly higher in S relative to C mice (Table II). For Table II, the transformation used to improve normality is indicate and both transformed means (± SE) and back-transformed means (shown in parenthesis) are provided.
Table II.
Statistical comparison of dam and pup profiles for Selected and Control lines from Generation 5. The back-transformed means are provided in parentheses prior to least squares means ± SEs for the transformed data. A nested ANOVA was used for analysis (see Methods for more details).
| Trait examined | Transform | Control | Selected | F1,23 | P |
|---|---|---|---|---|---|
| Dam mass Day 1 (g) | power 1.5 | (39.3) 246.5 ± 6.29 | (38.7) 241.3 ± 5.8 | 0.38 | 0.545 |
| Dam mass Day 6 (g) | power 1.5 | (43.0) 281.9 ± 8.49 | (42.2) 274.2 ± 7.86 | 0.43 | 0.516 |
| Pup mass Day 1 (g) | log 10 | (1.81) 0.26 ± 0.009 | (1.86) 0.27 ± 0.008 | 0.7 | 0.410 |
| Pup mass Day 6 (g) | log 10 | (3.98) 0.60 ± 0.011 | (4.26) 0.63 ± 0.010 | 5.22 | 0.031 |
| Latency from pairing to birth(days) | log 10 | (21.8) 1.34 ± 0.00 | (20.8) 1.32 ± 0.00 | 3.11 | 0.091 |
| Retrieval latency 1st pup(sec) | power 3.0 | (87.7) 675923 ± 136993 | (103.4) 1107271 ± 1117846 | 5.7 | 0.025 |
In terms of latency from pairing with a male to birth of offspring, a significant difference was found between S and C mice in Generations 1, F(1,24) = 5.55, p = 0.027, and 2, F(1,24) = 6.44, p = 0.018 with C mice showing a shorter latency. However, differences were not detected in subsequent generations, including Generation 5 (Table II). In no other reproductive measure were differences found between groups (Table II).
Elevated Plus Maze
In terms of number of entries to both middle square and closed arms, S mice showed significantly more entries relative to C mice (Table III). For all other measures, no significant differences between groups were found.
Table III.
Elevated Pus Maze Behavior in S and C mice at Generation 5. The back-transformed means are provided in parentheses prior to least squares means ± SEs for the transformed data. A nested ANOVA was used for analysis (see Methods for more details).
| Trait examined | Transform | Control | Selected | F1,23 | P |
|---|---|---|---|---|---|
| Latency to open arm (sec) | None | 155.9 ± 20.1 | 166.6 ± 17.31 | 0.16 | 0.692 |
| # of entries to open arm | Power 0.4 | (0.6) 0.85 ± 0.12 | (0.8) 0.92 ± 0.11 | 0.19 | 0.668 |
| Time on open arm (sec) | Power 0.4 | (7.26) 2.21 ± 0.35 | (8.7) 2.38 ± 0.31 | 0.14 | 0.717 |
| # of entries to middle square | Power 0.8 | (13.3) 7.96 ± 0.43 | (16.3) 9.36 ± 0.40 | 5.57 | 0.027 |
| Time on middle square (sec) | Power 0.4 | (109) 6.54 ± 0.17 | (124) 6.89 ± 0.15 | 2.19 | 0.152 |
| # of entries to closed arm | Power 0.8 | (11.5) 7.09 ± 0.365 | (14.3) 8.41 ± 0.33 | 7.00 | 0.014 |
| Time on closed arm (sec) | Power 1.4 | (159) 1208 ± 101 | (148) 1096 ± 94 | 0.66 | 0.426 |
Heritability
The duration of attacks (time aggressive) for all dams in Generation -1 is plotted against mean duration of attacks of offspring for that dam in Generation 0 in Fig. 3. The slope of the regression line for parent-offspring regression is 0.305. When this slope is doubled to account for only a single parent contributing to the regression, an estimate of heritability of 0.610 is provided. The average realized heritability for duration of attacks was 0.23 (Table IV), or 0.403 when corrected for within-family selection. A plot of the cumulative response to selection is provided in Fig. 4.
Figure 3.

Plot of levels of total duration of attacks (time aggressive) for all dams (S and C groups) in Generation -1 against mean duration of attacks of their daughters (siblings combined) in Generation 0. Slope of least-squares linear regression = 0.305, but provides an estimate of heritability of 0.610 when the slope is doubled to account for only one parent being used in the equation.
Table IV.
Realized heritability (unadjusted for within-family selection) through Generation 8.
| Generation | Realized h2 |
|---|---|
| 1 | 0.14 |
| 2 | 0.52 |
| 3 | 0.19 |
| 4 | 0.21 |
| 5 | 0.27 |
| 6 | 0.19 |
| 7 | 0.18 |
| 8 | 0.16 |
| Mean | 0.23 |
Figure 4.
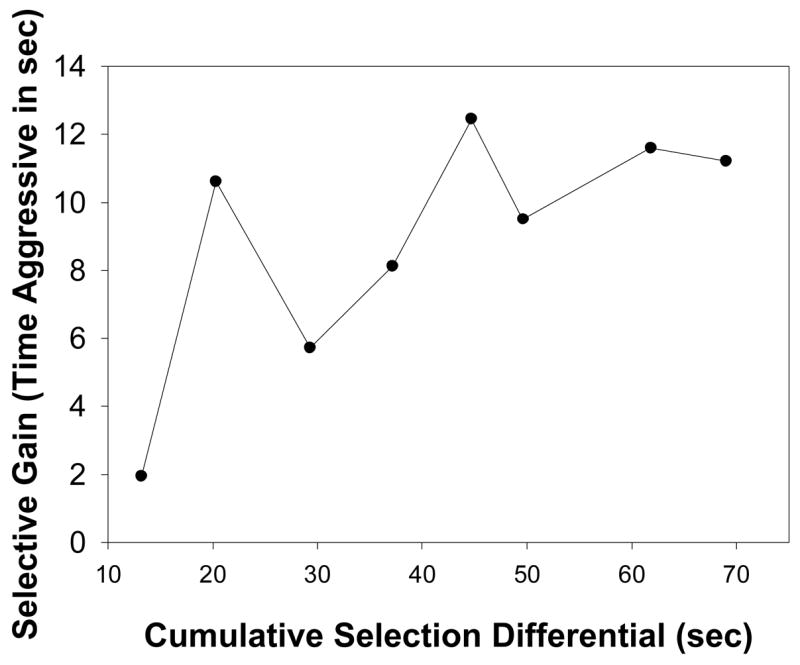
Plot of the response to selection, measured as the deviation between S and C mice against the cumulative selection differential in S mice.
DISCUSSION
Our estimates of heritability for maternal aggression based on mother-offspring regression (h2 = 0.601) and realized across eight generations of selection for high levels of aggression (h2 = 0.403 when corrected for within-family selection) are relatively high. Because we do not have replicated selected lines (see (Swallow et al., 1998; Swallow and Garland, 2005)), one caveat for the high heritability is that this one line may not be representative of the realized heritability of the trait (Konarzewski et al., 2005). The decreasing response to selection with subsequent generations (Fig. 4) suggests the possibility that we are approaching a selection limit. With these caveats, though, the heritability of maternal aggression found here is within the range for other social and reproductive behaviors in rodents. For example, selection for high female-female (not maternal) aggression in wild mice resulted in a realized heritability of 0.13 (Hyde and Sawyer, 1980) and selection for short attack latency in male mice resulted in a realized heritability of 0.30 (van Oortmerssen and Bakker, 1981). High maternal care in mice had a realized heritability of 0.24 (Chiang et al., 2002). Litter size in mice had an estimated heritability of 0.18 (Clutter et al., 1990) and a realized heritability of 0.19 examining response to selection over 122 generations using a residual maximum likelihood analysis (Holt et al., 2005).Quantity of nest building in mice had a realized heritability of 0.18 (unadjusted) and 0.28 (adjusted for within-family selection) when examined over 15 generations (Lynch, 1980).
Differences in maternal aggression between the S and C lines were first evident in Generation 2 and were consistently observed from Generations 4–8. In terms of total duration of attacks, C mice aggression was fairly stable from Generations 0–8. A notable exception is Generation -1, where both C and S mice show higher levels of aggression relative to Generation 0. Why aggression levels differ between the first two generations is unclear, but prepartum stress has been found to elevate maternal aggression in mice in some (Kinsley and Svare, 1988; Meek et al., 2001) but not all (Maestripieri et al., 1991; Pardon et al., 2000) studies, so stress of shipping could have altered aggression in Generation -1 mice.
Uterine and postnatal maternal effects from the dam can contribute to the phenotype of offspring (Rhees et al., 1999). Thus, although the genetics of the offspring may contribute largely to the phenotype, maternal effects still need to be considered. Although sex ratios could have influenced aggression (Svare, 1990), in this study sex ratios were almost identical between S and C mice and sex ratio of a litter was not predictive of aggression. Hence, it is not thought that sex ratios affected phenotype in this study.
In rats and mice, epigenetic effects have been shown to affect behavioral phenotypes. Levels of licking and grooming of pups are epigenetic in that pups exposed to high licking and grooming themselves exhibit higher levels of licking and grooming of their offspring (Caldji et al., 2000a; Caldji et al., 2000b; Caldji et al., 1998; Francis et al., 2002). Because early life events can alter stress reactivity epigenetically, with some strains showing greater responses to early life events (Anisman et al., 1998), an examination of the contribution of epigenetic effects in S and C mice would be valuable in future studies. Our comparisons of the S and C lines reared under identical conditions (except for their maternal “environments”), though, demonstrates a genetic basis for the divergence in maternal aggression phenotype.
In the present selection experiment, an important caveat regarding any apparent correlated response is that we do not have replicate lines (Swallow et al., 1998; Swallow and Garland, 2005). Thus, it is possible that some of the correlated changes may not reflect changes in allele frequencies at loci that actually responded to the selective-breeding protocol. Recent work suggests that with strong separation of the dependent trait (as seen here), correlated traits in selection studies not involving replicated lines can be identified (Konarzewski et al., 2005). However, correlated traits seen here should be viewed as possibilities, but not as necessities. Examinations of correlated traits, such as plus maze performance, when greater separation between groups has occurred should help to clarify possible genetic correlations between different behaviors.
Notwithstanding caveats involving the lack of replication in this selection experiment, the finding of significantly lower number of pups in S mice in Generations 5, 7, and 8 (Table I) suggests the intriguing possibility that there is a genetic relationship between pup number and maternal aggression. In a previous study in mice, pup number and maternal aggression were significantly related to one another using a first order polynomial fit (an inverted U-shaped response) with peak aggression around a mean of 11 pups and decreasing aggression with both higher and lower numbers (Gammie et al., 2003). Other studies have found a simple positive relation between litter size and maternal aggression in voles (Koskela et al., 2000) and mice (Maestripieri, 1990). Interestingly, for the latter study increasing litter size to 8 and 12 relative to 4 conferred increased aggression, but larger litter sizes were not examined. Thus, our finding of about 12 pups per litter for S mice may reflect in part an “optimal” litter size for the production of maternal aggression. The low variance in mean pup number in S mice from generation 3 through 8 (range 12.1 to 12.8) could reflect a stabilizing of pup number that supports peak aggressive output. Additional analysis and studies would be needed, though, to address this issue.
Consistent with other studies (Falconer, 1960), the lower pup number in S mice was associated with a higher per pup size relative to C mice (Table II). Another confound is that, in mice, smaller litters yield larger-sized pups that as adults tend to have larger litters with smaller pups (Falconer, 1960). As a consequence, cyclic changes in pup number and individual body mass may occur.
Previous work has indicated that the neural circuitries controlling pup retrieval and maternal aggression are mostly distinct, with some exceptions: for review, see (Gammie, 2005). Thus, the evolution of longer time to retrieve 1st pup by S mice (Table II) was unexpected. This result could reflect alterations in brain regions that support maternal aggression and that either directly or indirectly negatively impact retrieval behavior. If so, then a “trade-off” between maternal defense performance and other maternal behaviors may exist. On the other hand, some other maternal indices (see Table II) did not change in the S line relative to the C line, indicating that maternal defense can be modified without affecting all maternal profiles. In future studies it would be valuable to reexamine retrieval profiles and to examine additional maternal behaviors, such as time licking and grooming pups, time on nest, time arch back nursing, or time passive nursing; for example, see (Girard et al., 2002).
The lack of a difference in time on the open arm in the plus maze between the two groups is interesting because two previous studies found increased open arm time (thought to reflect decreased anxiety) to be associated with higher levels of maternal aggression (Maestripieri and D’Amato, 1991; Parmigiani et al., 1999). In recent work, we found that open arm time could be increased (via environmental enrichment) without triggering concomitant increases in maternal aggression (Friske and Gammie, 2005), suggesting that open arm and maternal aggression performance can be disassociated. Recent work suggests plus maze performance can reflect both exploratory as well as anxiety levels (Rodgers and Dalvi, 1997; Wall and Messier, 2001; Weiss et al., 1998), and that some aspects of maze performance may largely reflect novelty seeking (Roy et al., 2001). Increased entries by S mice to both the middle square and closed arm (Table III) suggests the possibility that novelty seeking and/or exploratory behaviors differs between S and C mice. Additional tests of novelty seeking and anxiety, such as such as acoustic startle, defensive burying, or the punished drinking paradigm (that have less of an exploratory component) would help address whether anxiety differences exist between groups.
Future studies examining intermale aggression in S mice will be valuable. In previous studies that involved selection for high intermale aggression, maternal aggression was found to be higher in selected mice in two studies (Hood and Cairns, 1988; Sandnabba, 1993), but not another (Benus, 2001). A range of studies suggest both overlapping and unique components of maternal and intermale aggression (Gammie et al., 2003; Gammie et al., 2000; Gammie and Nelson, 1999; Hasen and Gammie, 2005; Lonstein and Gammie, 2002). Hence, if higher levels of intermale aggression are found in S mice, then it is likely that the neural substrate upon which selection for high maternal aggression occurred contributes to production of intermale aggression. We do not feel, though, that we have selected for overall increases in aggression in a generic sense because in periodic testing of S virgin females we have never found aggression.
The development of mice bred for high maternal aggression allows for unique approaches to examine the neural and genetic basis of maternal aggression. Previous selection studies on levels of nest building in mice allowed for identification of differences in levels of the neuropeptide, vasopressin, as a key contributor to this behavior (Bult et al., 1992). Although a number of signaling molecules have been implicated in the control of maternal aggression, such as corticotropin releasing factor (Gammie et al., 2004), urocortin 1 and 3 (D’Anna et al., 2005), nitric oxide (Gammie and Nelson, 1999), and GABA (Mos and Olivier, 1989) (for review, see (Lonstein and Gammie, 2002), what modulations to the CNS occurred in the S mice still needs to be determined. One promising approach for identifying neural changes with selection is to use high density gene arrays, as has recently been done for mice selected for high wheel-running behavior (Bronikowski et al., 2004) and for short attack latency in males (Feldker et al., 2003a; Feldker et al., 2003b).
Acknowledgments
This work was supported by National Institutes of Health Grant R01 MH066086 to S.C.G and by the University of Wisconsin Graduate School and Department of Zoology. The authors wish to thank Emily Bethea, Kelly Clinkenbeard, Kimberly D’Anna, Michael Foley, Nina Hasen, Allen Irgens, Patrick Klevin, Sruthi Swaminathan, and Lindsay Theis for technical assistance and Kate Skogen and Jeff Alexander for animal care. T.G. was supported by National Science Foundation grant IBN-0212567.
References
- Agrell J, Wolff JO, Ylonen H. Counter-strategies to infanticide in mammals: costs and consequences. Oikos. 1998;83:507–517. [Google Scholar]
- Anisman H, Zaharia MD, Meaney MJ, Merali Z. Do early-life events permanently alter behavioral and hormonal responses to stressors? Int J Dev Neurosci. 1998;16:149–64. doi: 10.1016/s0736-5748(98)00025-2. [DOI] [PubMed] [Google Scholar]
- Benus RF. Coping in female mice from lines bidirectionally selected for male aggression. Behaviour. 2001;138:997–1008. [Google Scholar]
- Bronikowski AM, Rhodes JS, Garland T, Jr, Prolla TA, Awad TA, Gammie SC. The evolution of gene expression in mouse hippocampus in response to selective breeding for increased locomotor activity. Evolution. 2004;58:2079–86. doi: 10.1111/j.0014-3820.2004.tb00491.x. [DOI] [PubMed] [Google Scholar]
- Bult A, van der Zee EA, Compaan JC, Lynch CB. Differences in the number of arginine-vasopressin-immunoreactive neurons exist in the suprachiasmatic nuclei of house mice selected for differences in nest-building behavior. Brain Res. 1992;578:335–8. doi: 10.1016/0006-8993(92)90266-c. [DOI] [PubMed] [Google Scholar]
- Caldji C, Diorio J, Meaney MJ. Variations in maternal care in infancy regulate the development of stress reactivity. Biol Psychiatry. 2000a;48:1164–74. doi: 10.1016/s0006-3223(00)01084-2. [DOI] [PubMed] [Google Scholar]
- Caldji C, Francis D, Sharma S, Plotsky PM, Meaney MJ. The effects of early rearing environment on the development of GABAA and central benzodiazepine receptor levels and novelty-induced fearfulness in the rat. Neuropsychopharmacology. 2000b;22:219–29. doi: 10.1016/S0893-133X(99)00110-4. [DOI] [PubMed] [Google Scholar]
- Caldji C, Tannenbaum B, Sharma S, Francis D, Plotsky PM, Meaney MJ. Maternal care during infancy regulates the development of neural systems mediating the expression of fearfulness in the rat. Proc Natl Acad Sci U S A. 1998;95:5335–40. doi: 10.1073/pnas.95.9.5335. [DOI] [PMC free article] [PubMed] [Google Scholar]
- Chiang CF, Johnson RK, Nielsen MK. Selection for maternal behavior in mice - direct and correlated responses. Appl Anim Behav Sci. 2002;79:311–323. [Google Scholar]
- Clutter AC, Nielsen MK, Johnson RK. Alternative methods of selection for litter size in mice. 1 Characterization of base-population and development of methods. J Anim Sci. 1990;68:3536–3542. doi: 10.2527/1990.68113536x. [DOI] [PubMed] [Google Scholar]
- D’Anna KD, Stevenson SA, Gammie SC. Urocortin 1 and 3 impair maternal defense behavior in mice. Behav Neurosci. 2005:161–171. doi: 10.1037/0735-7044.119.4.1061. [DOI] [PubMed] [Google Scholar]
- Del Punta K, Leinders-Zufall T, Rodriguez I, Jukam D, Wysocki CJ, Ogawa S, Zufall F, Mombaerts P. Deficient pheromone responses in mice lacking a cluster of vomeronasal receptor genes. Nature. 2002;419:70–4. doi: 10.1038/nature00955. [DOI] [PubMed] [Google Scholar]
- Falconer DS. The genetics of litter size in mice. J Cell Comp Physiol. 1960;56 (Suppl 1):153–167. doi: 10.1002/jcp.1030560414. [DOI] [PubMed] [Google Scholar]
- Feldker DE, Datson NA, Veenema AH, Meulmeester E, de Kloet ER, Vreugdenhil E. Serial analysis of gene expression predicts structural differences in hippocampus of long attack latency and short attack latency mice. Eur J Neurosci. 2003a;17:379–87. doi: 10.1046/j.1460-9568.2003.02440.x. [DOI] [PubMed] [Google Scholar]
- Feldker DE, Datson NA, Veenema AH, Proutski V, Lathouwers D, De Kloet ER, Vreugdenhil E. GeneChip analysis of hippocampal gene expression profiles of short- and long-attack-latency mice: technical and biological implications. J Neurosci Res. 2003b;74:701–16. doi: 10.1002/jnr.10800. [DOI] [PubMed] [Google Scholar]
- Francis DD, Young LJ, Meaney MJ, Insel TR. Naturally occurring differences in maternal care are associated with the expression of oxytocin and vasopressin (V1a) receptors: gender differences. J Neuroendocrinol. 2002;14:349–53. doi: 10.1046/j.0007-1331.2002.00776.x. [DOI] [PubMed] [Google Scholar]
- Friske JE, Gammie SC. Environmental enrichment alters plus maze, but not maternal defense performance in mice. Physiol Behav. 2005;85:187–94. doi: 10.1016/j.physbeh.2005.03.022. [DOI] [PubMed] [Google Scholar]
- Gammie SC. Current models and future directions for understanding the neural circuitries of maternal behaviors in rodents. Behavioral and Cognitive Neuroscience Reviews. 2005;4:119–35. doi: 10.1177/1534582305281086. [DOI] [PubMed] [Google Scholar]
- Gammie SC, Hasen NS, Rhodes JS, Girard I, Garland T., Jr Predatory aggression, but not maternal or intermale aggression, is associated with high voluntary wheel-running behavior in mice. Horm Behav. 2003;44:209–21. doi: 10.1016/s0018-506x(03)00140-5. [DOI] [PubMed] [Google Scholar]
- Gammie SC, Hasen NS, Stevenson SA, Bale TL, D’Anna KD. Elevated stress sensitivity in corticotropin-releasing factor receptor 2 deficient mice decreases maternal, but not intermale aggression. Behav Brain Res. 2005;160:169–77. doi: 10.1016/j.bbr.2004.11.026. [DOI] [PubMed] [Google Scholar]
- Gammie SC, Huang PL, Nelson RJ. Maternal aggression in endothelial nitric oxide synthase-deficient mice. Horm Behav. 2000;38:13–20. doi: 10.1006/hbeh.2000.1595. [DOI] [PubMed] [Google Scholar]
- Gammie SC, Negron A, Newman SM, Rhodes JS. Corticotropin-releasing factor inhibits maternal aggression in mice. Behav Neurosci. 2004;118:805–14. doi: 10.1037/0735-7044.118.4.805. [DOI] [PubMed] [Google Scholar]
- Gammie SC, Nelson RJ. Maternal aggression is reduced in neuronal nitric oxide synthase-deficient mice. J Neurosci. 1999;19:8027–8035. doi: 10.1523/JNEUROSCI.19-18-08027.1999. [DOI] [PMC free article] [PubMed] [Google Scholar]
- Gammie SC, Nelson RJ. cFOS and pCREB activation and maternal aggression in mice. Brain Res. 2001;898:232–41. doi: 10.1016/s0006-8993(01)02189-8. [DOI] [PubMed] [Google Scholar]
- Girard I, Swallow JG, Carter PA, Koteja P, Rhodes JS, Garland T. Maternal-care behavior and life-history traits in house mice (Mus domesticus) artificially selected for high voluntary wheel-running activity. Behavioural Processes. 2002;57:37–50. doi: 10.1016/s0376-6357(01)00206-6. [DOI] [PubMed] [Google Scholar]
- Hasen NS, Gammie SC. Differential fos activation in virgin and lactating mice in response to an intruder. Physiol Behav. 2005;84:684–695. doi: 10.1016/j.physbeh.2005.02.010. [DOI] [PubMed] [Google Scholar]
- Holt M, Meuwissen T, Vangen O. Long-term responses, changes in genetic variances and inbreeding depression from 122 generations of selection on increased litter size in mice. J Anim Breed Genet. 2005;122:199–209. doi: 10.1111/j.1439-0388.2005.00526.x. [DOI] [PubMed] [Google Scholar]
- Holt M, Vangen O, Farstad W. Components of litter size in mice after 110 generations of selection. Reproduction. 2004;127:587–92. doi: 10.1530/rep.1.00118. [DOI] [PubMed] [Google Scholar]
- Hood KE, Cairns RB. A developmental-genetic analysis of aggressive behavior in mice. II Cross-sex inheritance. Behav Genet. 1988;18:605–19. doi: 10.1007/BF01082312. [DOI] [PubMed] [Google Scholar]
- Hyde JS, Sawyer TF. Selection for agonistic behavior in wild female mice. Behav Genet. 1980;10:349–59. doi: 10.1007/BF01065597. [DOI] [PubMed] [Google Scholar]
- Kinsley C, Svare B. Prenatal stress alters maternal aggression in mice. Physiol Behav. 1988;42:7–13. doi: 10.1016/0031-9384(88)90252-1. [DOI] [PubMed] [Google Scholar]
- Konarzewski M, Ksiazek A, Lapo IB. Artificial selection on metabolic rates and related traits in rodents. Integr Comp Biol. 2005;45:416–425. doi: 10.1093/icb/45.3.416. [DOI] [PubMed] [Google Scholar]
- Koskela E, Juutistenaho P, Mappes T, Oksanen TA. Offspring defence in relation to litter size and age: Experiment in the bank vole Clethrionomys glareolus. Evol Ecol. 2000;14:99–109. [Google Scholar]
- Lonstein JS, Gammie SC. Sensory, hormonal, and neural control of maternal aggression in laboratory rodents. Neurosci Biobehav Rev. 2002;26:869–88. doi: 10.1016/s0149-7634(02)00087-8. [DOI] [PubMed] [Google Scholar]
- Lynch CB. Response to divergent selection for nesting behavior in Mus musculus. Genetics. 1980;96:757–65. doi: 10.1093/genetics/96.3.757. [DOI] [PMC free article] [PubMed] [Google Scholar]
- Maestripieri D. Maternal aggression and litter size in the female house mouse. Ethology. 1990;84:27–34. [Google Scholar]
- Maestripieri D, Badiani A, Puglisi-Allegra S. Prepartal chronic stress increases anxiety and decreases aggression in lactating female mice. Behav Neurosci. 1991;105:663–8. doi: 10.1037//0735-7044.105.5.663. [DOI] [PubMed] [Google Scholar]
- Maestripieri D, D’Amato FR. Anxiety and maternal aggression in house mice (Mus musculus): a look at interindividual variability. J Comp Psychol. 1991;105:295–301. doi: 10.1037/0735-7036.105.3.295. [DOI] [PubMed] [Google Scholar]
- Meek LR, Dittel PL, Sheehan MC, Chan JY, Kjolhaug SR. Effects of stress during pregnancy on maternal behavior in mice. Physiol Behav. 2001;72:473–9. doi: 10.1016/s0031-9384(00)00431-5. [DOI] [PubMed] [Google Scholar]
- Mos J, Olivier B. Quantitative and comparative analyses of pro-aggressive actions of benzodiazepines in maternal aggression of rats. Psychopharmacology (Berl) 1989;97:152–3. doi: 10.1007/BF00442238. [DOI] [PubMed] [Google Scholar]
- Pardon M, Gerardin P, Joubert C, Perez-Diaz F, Cohen-Salmon C. Influence of prepartum chronic ultramild stress on maternal pup care behavior in mice. Biol Psychiatry. 2000;47:858–63. doi: 10.1016/s0006-3223(99)00253-x. [DOI] [PubMed] [Google Scholar]
- Parmigiani S, Palanza P, Rogers J, Ferrari PF. Selection, evolution of behavior and animal models in behavioral neuroscience. Neurosci Biobehav Rev. 1999;23:957–69. doi: 10.1016/s0149-7634(99)00029-9. [DOI] [PubMed] [Google Scholar]
- Peripato AC, De Brito RA, Vaughn TT, Pletscher LS, Matioli SR, Cheverud JM. Quantitative trait loci for maternal performance for offspring survival in mice. Genetics. 2002;162:1341–53. doi: 10.1093/genetics/162.3.1341. [DOI] [PMC free article] [PubMed] [Google Scholar]
- Rhees BK, Ernst CA, Miao CH, Atchley WR. Uterine and postnatal maternal effects in mice selected for differential rate of early development. Genetics. 1999;153:905–17. doi: 10.1093/genetics/153.2.905. [DOI] [PMC free article] [PubMed] [Google Scholar]
- Rodgers RJ, Dalvi A. Anxiety, defence and the elevated plus-maze. Neurosci Biobehav Rev. 1997;21:801–10. doi: 10.1016/s0149-7634(96)00058-9. [DOI] [PubMed] [Google Scholar]
- Roy V, Belzung C, Delarue C, Chapillon P. Environmental enrichment in BALB/c mice: effects in classical tests of anxiety and exposure to a predatory odor. Physiol Behav. 2001;74:313–20. doi: 10.1016/s0031-9384(01)00561-3. [DOI] [PubMed] [Google Scholar]
- Sandnabba NK. Female aggression during gestation and lactation in two strains of mice selected for isolation-induced intermale aggression. Behavioural Processes. 1993;30:157–164. doi: 10.1016/0376-6357(93)90005-C. [DOI] [PubMed] [Google Scholar]
- Sandnabba NK. Selective breeding for isolation-induced intermale aggression in mice: associated responses and environmental influences. Behav Genet. 1996;26:477–88. doi: 10.1007/BF02359752. [DOI] [PubMed] [Google Scholar]
- Stowers L, Holy TE, Meister M, Dulac C, Koentges G. Loss of sex discrimination and male-male aggression in mice deficient for TRP2. Science. 2002;295:1493–500. doi: 10.1126/science.1069259. [DOI] [PubMed] [Google Scholar]
- Svare B. Maternal aggression: hormonal, genetic, and developmental determinants. In: Krasnegor NA, Bridges RS, editors. Mammalian parenting : biochemical, neurobiological, and behavioral determinants. New York: Oxford University Press; 1990. pp. 118–132. [Google Scholar]
- Svare B, Betteridge C, Katz D, Samuels O. Some situational and experiential determinants of maternal aggression in mice. Physiol Behav. 1981;26:253–8. doi: 10.1016/0031-9384(81)90020-2. [DOI] [PubMed] [Google Scholar]
- Svare B, Gandelman R. Postpartum aggression in mice: experiential and environmental factors. Horm Behav. 1973;4:323–324. [Google Scholar]
- Swallow JG, Carter PA, Garland T., Jr Artificial selection for increased wheel-running behavior in house mice. Behav Genet. 1998;28:227–37. doi: 10.1023/a:1021479331779. [DOI] [PubMed] [Google Scholar]
- Swallow JG, Garland T. Selection experiments as a tool in evolutionary and comparative physiology: Insights into complex traits - An introduction to the symposium. Integr Comp Biol. 2005;45:387–390. doi: 10.1093/icb/45.3.387. [DOI] [PubMed] [Google Scholar]
- van Oortmerssen GA, Bakker TC. Artificial selection for short and long attack latencies in wild Mus musculus domesticus. Behav Genet. 1981;11:115–26. doi: 10.1007/BF01065622. [DOI] [PubMed] [Google Scholar]
- Wall PM, Messier C. Methodological and conceptual issues in the use of the elevated plus-maze as a psychological measurement instrument of animal anxiety-like behavior. Neurosci Biobehav Rev. 2001;25:275–86. doi: 10.1016/s0149-7634(01)00013-6. [DOI] [PubMed] [Google Scholar]
- Weiss SM, Wadsworth G, Fletcher A, Dourish CT. Utility of ethological analysis to overcome locomotor confounds in elevated maze models of anxiety. Neurosci Biobehav Rev. 1998;23:265–71. doi: 10.1016/s0149-7634(98)00027-x. [DOI] [PubMed] [Google Scholar]
- Wolff JO. Maternal aggression as a deterrent to infanticide in Peromyscus leucopus and P. maniculatus. Anim Behav. 1985;33:117–123. [Google Scholar]
- Wolff JO. Why are female small mammals territorial. Oikos. 1993;68:364–370. [Google Scholar]