

Abstract
A 24-item short form of the 96-item Developmental Behaviour Checklist was developed to provide a brief measure of Total Behaviour Problem Score for research purposes. The short form Developmental Behaviour Checklist (DBC-P24) was chosen for low bias and high precision from among 100 randomly selected item sets. The DBC-P24 was developed from epidemiological data in the first three waves of the Australian Child to Adult Development study, and cross validated for groups with autism, fragile X, Prader-Willi, and Williams in this longitudinal study and in cross sectional Dutch, English, and Finnish samples of young people with intellectual disability. The DBC-P24 has low bias and high precision in cross-validation samples and achieves high sensitivity and specificity to full DBC-P based caseness decisions.
The Developmental Behaviour Checklist (DBC), a tool for the assessment of behavioral and emotional disturbance in individuals with intellectual disability, has achieved wide acceptance. Detailed accounts of its development and psychometric properties are available (Dekker, Nunn, & Koot, 2002; Einfeld & Tonge, 1995, 2002; Hastings, Brown, Mount, & Cormack, 2001). The original form of the DBC is the DBC-P, completed by parents or careproviders who provide information on the behavior of young people with intellectual disability ages 4 to 18 years. It consists of 95 substantive items, scored according to the scheme 0: not true as far as [the informant] know[s], 1: somewhat or sometimes true, and 2: very true or often true, based on a scheme developed by Achenbach (1991). Item 96 is an overall assessment of the young person’s behavior. The DBC-P has an overall Total Behaviour Problem Score calculated as the sum of responses to all but the last item and scores on five subscales. The Total Behaviour Problem Score is an overall measure of psychopathology in young people with an intellectual disability.
The DBC-P usually takes 10 to 15 minutes to complete, which is convenient for assessments of individuals and in many research applications. However, in some circumstances, an even shorter assessment may be desirable. The most likely circumstance is when a measure of behavioral and emotional disturbance forms only one part of a battery of assessments, and the overall time demands on participants can easily become burdensome. This has led to requests for a short form of the DBC-P, which will furnish a reliable estimate of Total Behaviour Problem Score (or equivalently of Mean Behaviour Problem Score, the mean score on all the items). In this paper we introduce a 24-item short form of the DBC-P, suitable for this purpose.
Constructing a short form of a checklist consists of making a judicious selection of a suitably small number of the items. In deciding how many is a suitably small number, there is a tension between the time the short form will take to complete and the amount of information it potentially contains, which in part determines how reliable it will be. We decided on a short form of 24 items, which would require about 4 to 5 minutes, on average, to complete for an informant who knows the young person well and that will fit comfortably on one side of a standard sheet of paper.
Our aim is to provide as good an estimate as possible of the overarching measure Mean Behavior Problem Score only, within the limits set by the restricted size of the short form item set. With this aim in mind, a good short form should have the following properties: (a) Unbiasedness: For ease of use, the mean of the short form items should be the estimate of the Mean Behavior Problem Score. The mean of an unbiased short form would require no further treatment, such as the application of a conversion formula or the looking up of a table. (b) Precision: The unbiased-short form-based estimate of Mean Behavior Problem Score should, on average, not miss its target (the true Mean Behavior Problem Score for the young person) by very much. That is, this unbiased estimate would be precise (have small variance).
In summary, a good short form should give minimally biased and precise estimates of the construct that the checklist is designed to measure. It is well-known from statistical theory that the mean of a randomly selected sample is an unbiased estimator of an unknown mean, and that in a wide variety of circumstances, it is less variable than any other unbiased estimator (Wilks, 1962). Therefore, the mean of a randomly selected sample of 24 DBC-P items is, in principle, a good estimator of Mean Behavior Problem Score.
To those unfamiliar with statistical theory, the use of random selection to construct a short form may appear arbitrary. Random selection, it may be objected, takes no account of the meanings of the items nor of the possibility that some items may be more strongly related to the Mean Behavior Problem Score than others. A natural nonrandom strategy for constructing a short form is to select items on the basis of the amount of information they contain about the underlying concept (behavioral and emotional disturbance or psychopathology in the case of the DBC), of which the overall summary score (for the DBC, Mean Behavior Problem Score) is a measure. Many short forms in the psychological literature have been constructed on this basis (e.g., the GHQ-28 (Goldberg & Hillier, 1979), the Treatment Evaluation Inventory (Newton & Sturmey, 2004), the Spielberger State-Trait Anxiety Inventory (Bekker & Marteau, 1992), for which few have considered it necessary to offer any justification. The Pearson correlation of an item with the overall score is a common measure of the information the item contains, and Cronbach’s alpha, a measure of internal consistency of a summated scale, is often quoted in confirmation of the appropriateness of the short form. Cross validation of the short form by testing it in other relevant data sets, an issue of critical importance, is rarely addressed.
Selection of items for a short form on the basis of their correlation with the overall score may be a reasonable strategy in situations where it may be assumed that the responses to all the items have a common underlying distribution. We show that this assumption is untenable in the case of the DBC items and that, consequently, the method of choosing items on the basis of their high correlations with the overall measure resultsin grossly biased (inflated) and inefficient estimates.
Another approach to item selection is to use item response theory, a concept developed in the field of educational measurement (Bock, 1997). Proponents of this theory assume that the items in question are all measures of a single, unidimensional construct, such as mathematical ability, and that both the items and the study participants may be arranged along this dimension. A major concern of item response theory is the power of an instrument to discriminate among the subjects, being able to distinguish, for example, those with high mathematical ability from those with lower mathematical ability. Only those with high ability, in item response theory, will be able to respond correctly to items with a high degree of mathematical difficulty. Thus, in the mathematics context, the participants (students) are thought of as being arranged along a spectrum of mathematical ability, whereas the test items are thought of as being arranged along a corresponding spectrum of mathematical difficulty. In the DBC context, the participants may be thought of as being arranged along a spectrum of psychopathology, but it is difficult to imagine the DBC items being arranged along a level-of-pathology spectrum analogous to mathematical difficulty.
Method and Samples
To develop the short form, we used data from the first three data-collection time points (waves) of the Australian Child to Adult Development study (Einfeld & Tonge, 1996a, 1996b; Tonge & Einfeld, 2003), in which the DBC-P was used for all respondents. The DBC-A (Mohr, Tonge, & Einfeld, 2005), a version developed for adults with intellectual disability who were 19 years and above, was used for most Australian Child to Adult Development participants in Wave 4 and for all in Wave 5, the data collection in progress at the time of the present study. Our development sample consisted of the DBC-P responses of individuals within the epidemiological subset within the Australian Child to Adult Development study; their mean ages at Waves 1, 2, and 3 were 12.1, 16.5 and 19.5 years. The epidemiological subset was based on a virtually complete identification of children and adolescents with moderate or severe intellectual disability and those with mild intellectual disability who used any health, education, or welfare service in representative regions in New South Wales and Victoria. We restricted eligibility for the development sample to those who were under 19 years of age at the time of the first wave of data collection.
For the purpose of cross-validation, we used data from the first three waves of the Australian Child to Adult Development study genetic syndrome subgroups and the cross-sectional Dutch, English, and Finnish samples. The samples of individuals with autism (n = 119) and with Williams (n = 63), Prader-Willi (n = 51), and fragile X (n = 64) groups were small samples recruited through specialist genetics clinics and parent support organizations in New South Wales. They are considered to be representative of those with these syndromes who come to medical attention and receive a diagnosis through the health, education, and welfare services (Tonge & Einfeld, 2003). The Dutch sample (n = 1,057) was randomly selected from special school settings in a study of educable and trainable young people with intellectual disability, who were aged from 6 to 18 years (Dekker, Nunn, & Koot, 2002). The English sample (n = 419) was randomly sampled from a special educational needs database in Manchester (Emerson, Robertson, & Wood, 2004), and the Finnish sample (n = 85) was recruited from children aged 6 to 13 years with mild to profound intellectual disability (Koskentausta & Almqvist, 2004).
We made 100 random selections of 24 of the 95 substantive DBC-P items by repeatedly taking the first 24 item numbers from the list 1, 2, ..., 94, 95 after it had been randomly reordered using a program that generates uniformly distributed random numbers. In our development sample (the Australian Child to Adult Development epidemiological sample), we checked the performance of each of these random selections of items (candidate short forms) by comparing the estimates they provided with the corresponding values of Mean Behavior Problem Score in each of three data waves. We eliminated the potential short forms with relatively high bias (i.e., those that consistently over- or underestimated the Mean Behavior Problem Score by more than a chosen amount. Among the remaining low-bias short forms, we chose on the basis of precision of measurement. Precision was measured by the standard deviation (SD) of the bias measure. We judged precision by considering the bootstrap distribution (Davison & Hinkley, 1997; Efron & Tibshirami, 1986) of 1,000 SD estimates for each short form. The bootstrap is a computing-intensive technique for investigating the behavior of statistics, such as the SD, under repeated sampling, made practicable recently by the advent of fast, inexpensive computing.
The sole survivor of this process was our short form. We checked its performance in several cross-validation samples: subsamples of the Australian Child to Adult Development study representing young people with fragile X, Prader Willi, and Williams syndromes and autism as well as in the Dutch, English, and Finnish samples.
Results
Item Response Distributions
Responses to DBC-P items are not identically distributed. Their distributions differ considerably both in mean (ranging from near 0 to over 1) and in SD (ranging from .2 to over .8). Moreover, the means and SDs of the item responses are closely related in a nonlinear way, as is shown in Figure 1. A parabola is plotted though the 95 item points to emphasize the curvilinear relationship that holds between SD and mean. This relationship is not unexpected because the item responses would have binomial distributions if the two nonzero response options were both coded as 1 and a parabolic relationship is known to hold between the variance and the mean of a binomial distribution as the probability of the event being registered varies. The items in the final short form are represented by filled circles. It may be observed that the short form items represent the relationship between SD and mean quite well.
Figure 1.
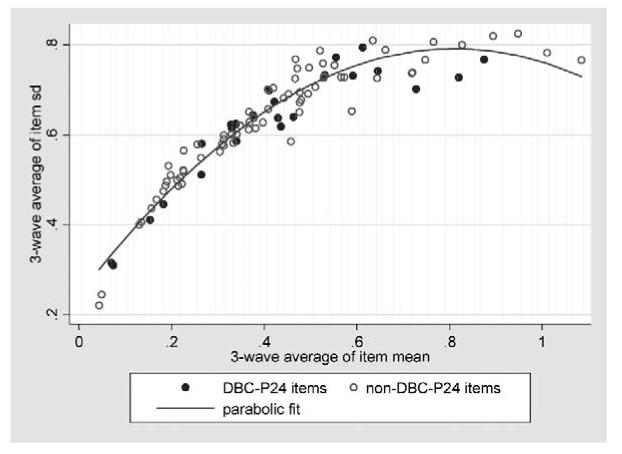
Three-wave average of item SD versus three-wave average of item mean, showing curvilinear relationship, with DBC-P24 (random selection based short form) shown by filled circles.
Distribution of means of 100 random samples of 24 items
The mean of 539 individual Mean Behavior Problem Score values in the epidemiological sample in the first wave of the Australian Child to Adult Development study was .450. The 100 estimates of this target value provided by the 100 randomly selected 24-item candidate short form scales were approximately normally distributed, with a mean of .457 and SD of .044. A visual check on the approximation to normality is given by a plot of the percentiles of the sample of short form means against the percentiles that would be expected in a sample drawn from a normal distribution with the same mean and SD (see Figure 2). A 95% confidence interval for the mean of their distribution is (.448, .466). These two results confirm the properties of means of random samples, even of random variables with very asymmetric discrete distributions on three values (such as those of the DBC-P item responses), guaranteed by the extended form of the Central Limit Theorem: that the means will be normally distributed around the overall population mean, despite their not being identically distributed, if n is “large” (Feller, 1967). (Here n was only 24.) The corresponding results in Waves 2 and 3 were very similar.
Figure 2.
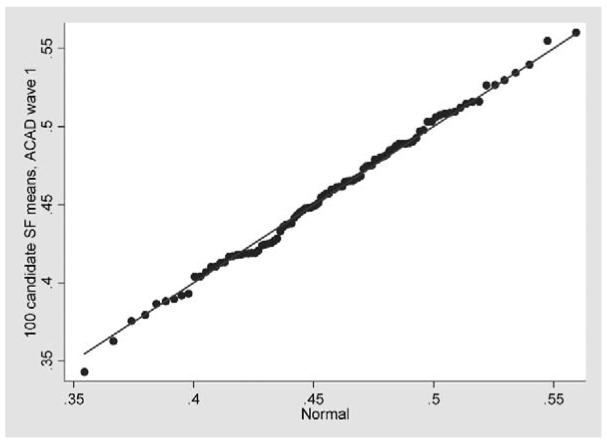
Quantile-quantile plot comparing the distribution of 100 candidate short-form means in Wave 1 of the Australian Child to Adult Development data with a normal distribution with the same mean and SD.
Bias and Precision
The bias involved in using a short form mean to estimate Mean Behavior Problem Score was calculated (as short form mean - Mean Behavior Problem Score) for each person in the epidemiological sample of the Australian Child to Adult Development study at each of the three data waves. The absolute value (magnitude) of this bias is a measure of the closeness of the short form mean to the Mean Behavior Problem Score. The SD of the bias measures the precision of the short form estimate of Mean Behavior Problem Score.
Figure 3 plots for each candidate short form its average across the three waves of the average across persons of its absolute bias (on the vertical axis) against its average across the three waves of the SD across persons of its bias (on the horizontal axis). The lower the average absolute bias, the more accurate, on average, is the short form mean as an estimate of the Mean Behavior Problem Score. The lower the average SD, the steadier, from person to person, is the bias of the short form mean. This steadiness, or low variability, is what we mean by precision.
Figure 3.
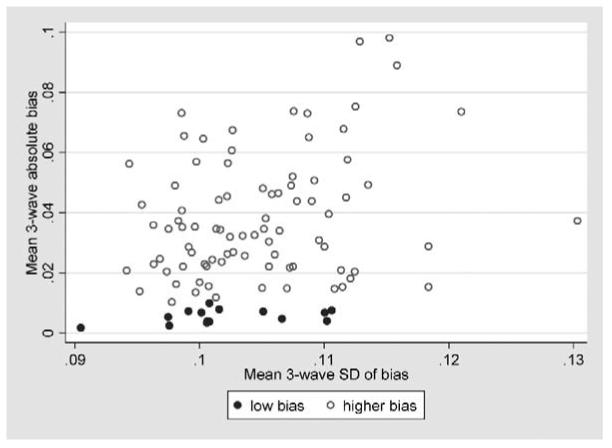
Absolute bias and precision of 100 candidate short forms, based on three-wave averages.
Our criterion was to choose the steadiest among the more accurate on average short forms. This short form is represented by the furthest left of the filled circles (representing short forms with low, under 0.01, average absolute bias) in Figure 3. This most precise among the more accurate short forms also happened to be the most accurate. In the following discussion, we refer to this short form as DBC-P24.
The average in the three data waves of the SD of the bias of DBC-P24 is shown in Figure 3 as being just above .09. To estimate the accuracy of this figure, we used bootstrap resampling with 1,000 replications. The resulting 95% confidence intervals were (.087, .100), (.087, .101) and (.077, .090), respectively, for Data Waves 1, 2, and 3. The estimate of about .09 is reliable.
Short Form Based on the Most Informative (High Correlation With Overall Scale Score) Items
To provide a formal basis for the popular alternative strategy of selecting items for a short form on the basis of their high correlations with the overall scale score, we estimated a confirmatory factor analysis model with behavioral and emotional disturbance as the single underlying factor explaining the 95 substantive DBC-P items, in each of the three waves of the Australian Child to Adult Development study.
The comparative fit indices from the confirmatory factor analysis for Data Waves 1, 2, and 3 were .455, .442, and .433, respectively. These compare with corresponding comparative fit indices of .606, .612, and .611 for confirmatory factor analysis based on the published five-factor model of the DBC-P (Dekker, Nunn, Einfeld, Tonge, & Koot, 2002), indicating the comparative inadequacy of a single-factor explanation.
We selected as the 24 most informative items about behavioral and emotional disturbance those with the highest mean R2 statistics (which hardly varied across data waves) for their estimated regressions on behavioral and emotional disturbance. These items are represented by the filled circles in Figure 4, a variant on Figure 1. It may be observed that most of the high-information items lie within the relatively high .6 to .8 band of three-wave average SD, reflecting the close relationship in statistical theory between the concepts of information and variability. In consequence, their means are also relatively high, because of the strong relationship between SDs and means of the item response distributions, so that the corresponding high-correlations-based short form is strongly biased upwards giving estimates of Mean Behavior Problem Score that are much too high.
Figure 4.
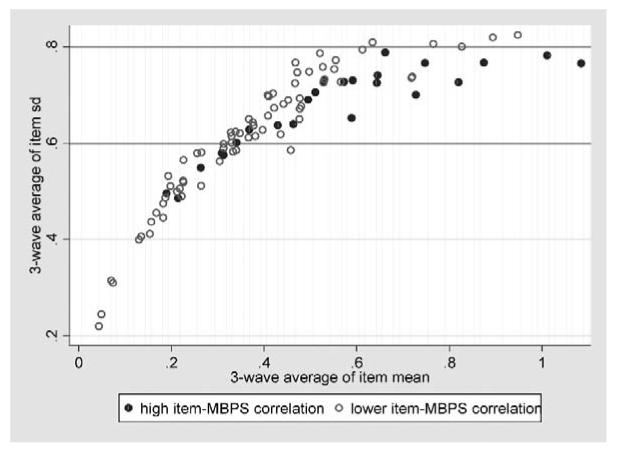
Three-wave average of item SD versus three-wave average of item mean, with 24 most informative items shown by filled circles.
Comparison of Mean Behavior Problem Score and short form estimates
Table 1 compares Mean Behavior Problem Score with its estimates based on DBC-P24 and on the short form consisting of items with high correlations with Mean Behavior Problem Score in the development sample, namely, the epidemiological subset of the Australian Child to Adult Development study restricted to young people with intellectual disability who were under the age of 19 at the first data wave. The DBC-P24 differs in overall mean from the Mean Behavior Problem Score only in the 3rd decimal place in each data wave. In contrast, the high-item Mean Behavior Problem Score correlation short form consistently overestimates Mean Behavior Problem Score, by amounts varying from 25% to 37%.
Table 1.
Mean Behaviour Problem Score (MBPS) and Two Short Form Estimators in the Epidemiological Sample of the ACAD Study
| Wave 1 (n = 539) |
Wave 2 (n = 432) |
Wave 3 (n = 403) |
||||
|---|---|---|---|---|---|---|
| Measure | Mean | SD | Mean | SD | Mean | SD |
| MBPS | .450 | .253 | .423 | .250 | .403 | .245 |
| DBC-P24a | .451 | .272 | .421 | .265 | .405 | .258 |
| High item-MBPS correlation short form | .618 | .389 | .551 | .388 | .503 | .377 |
Note. ACAD = Australian Child to Adult Development.
Random selection based short form.
The mean of DBC-P24 is only very slightly more variable than the Mean Behavior Problem Score. The high-item Mean Behavior Problem Score correlation short form mean is 43% to 46% more variable than that of DBC-P24.
Figure 5 shows the similarity between the distributions of Mean Behavior Problem Score and the mean of DBC-P24 in the epidemiological sample of the Australian Child to Adult Development study in Data Waves 1, 2, and 3.
Figure 5.
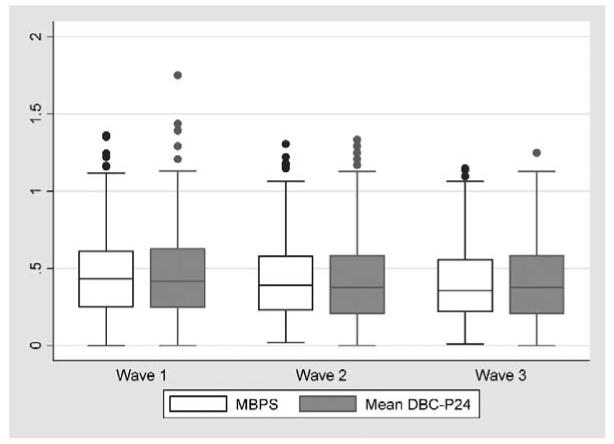
Comparison of the distributions of Mean Behavior Problem Score (Mean Behaviour Problem Score) and mean of DBC-P24 (random selection based short form) in three waves of the Australian Child to Adult Development study (epidemiological sample).
Cross Validation
Table 2 provides a summary of the bias (DBC-P24 mean - Mean Behavior Problem Score) in the genetic syndrome groups recruited by the Australian Child to Adult Development study, in the first three data waves. The absolute value of the mean bias is under .01 in the autism and fragile X groups and under .04 in the Prader-Willi and Williams groups. The mean and SD are overall figures for the three waves; the numbers of different bias values (observations) and the number of persons contributing them (participants) are also shown. The SDs are of similar size to those estimated for the epidemiological sample.
Table 2.
Bias Statistics for DBC-P24 in Syndrome Groups in Three Waves of ACAD Study
| Syndrome group | Bias |
Observations | Participants | |
|---|---|---|---|---|
| Mean | SD | |||
| Autism | .002 | .094 | 309 | 119 |
| Fragile X | .009 | .084 | 176 | 64 |
| Prader-Willi | .034 | .101 | 116 | 51 |
| Williams | -.039 | .090 | 164 | 63 |
Note. DBC-P24 = Random selection based short form. ACAD = Australian Child to Adult Development.
A common research use for DBC-P24 will be to generate a “caseness” classification. The DBC-P manual (Einfeld & Tonge, 2002) gives 46 as a cutoff for the Total Behaviour Problem Score. A score of 46 or more qualifies an individual to be regarded as showing evidence of psychopathology. The corresponding cutoff for Mean Behavior Problem Score is .48 (= 46/95). Table 3 shows sensitivity and specificity statistics for the use of this cutoff with the DBC-P24 mean to decide caseness relative to the same decision based on the Mean Behavior Problem Score for the Australian Child to Adult Development genetic syndrome groups.
Table 3.
Sensitivity and Specificity of Caseness Based on DBC-P24
| Autism |
Fragile X |
Prader Willi |
Williams |
|||||
|---|---|---|---|---|---|---|---|---|
| Wave | Sensitivity | Specificity | Sensitivity | Specificity | Sensitivity | Specificity | Sensitivity | Specificity |
| 1 | .89 | .89 | .95 | .98 | .97 | .90 | .80 | .83 |
| 2 | .92 | .77 | .85 | .92 | .95 | .83 | .91 | 1.00 |
| 3 | .92 | .95 | .87 | .90 | .90 | .93 | .78 | .96 |
| Mean | .91 | .87 | .89 | .93 | .94 | .89 | .83 | .93 |
Note. DBC-P24 = Random selection based short form.
Table 4 provides similar summaries for the cross-sectional Dutch, English, and Finnish data. Again, biases are low, precision is similar to that achieved in the Australian Child to Adult Development sample, and specificities and sensitivities are high.
Table 4.
Cross-Validation in Samples From Three Non-Australian Cross Sectional Studies
| Bias statistics |
DBC-P24a caseness |
||||
|---|---|---|---|---|---|
| Sample | n | Mean | SD | Sensitivity | Specificity |
| Dutch | 1,057 | -.029 | .086 | .81 | .97 |
| English | 419 | .008 | .098 | .93 | .94 |
| Finnish | 85 | .001 | .089 | .82 | .91 |
Random selection based short form.
Discussion
We have developed a short form of the DBC-P suitable for estimating the Mean Behavior Problem Score (or equivalently the Total Behaviour Problem Score); the DBC-P24 has excellent specificity and sensitivity characteristics if values above a cutoff score are taken as indicating significant levels of psychopathology, as is done with the Mean Behavior Problem Score. The short form, which we call the DBC-P24, is intended for these uses only in research, and not as an instrument for estimating any DBC-P subscores. For researchers and clinicians interested in subscores, the DBC-P itself is a sufficiently compact instrument. The DBC-P24 is also not recommended for clinical use with individual clients because the full DBC-P provides a much richer account of psychopathology, subscale scores, and screening for a number of individual psychiatric disorders.
We have relied on statistical theory of long-standing—the Central Limit Theorem and the concepts of bias and precision in estimation—rather than on specifically psychological measurement concepts. The strategy of choosing items for a short form on the basis of their high correlations with the overall measure was shown to be seriously deficient if used with sets of items, such as the set comprising the DBC-P, with nonidentical distributions whose means are related to their variability, which is an index of the amount of information they contain. The deficiency of this strategy in the DBC-P context was shown in inflated estimates, which were also considerably less precise than those provided by the DBC-P24.
The DBC-P24 performed very well in terms of low bias and high precision in cross validation, the acid test of performance so often neglected by developers of short forms of psychometric instruments. In particular, it was shown to have excellent sensitivity and specificity properties when used in the same way as the Mean Behavior Problem Score to classify caseness, which will be a verycommon use of the short form. On the basis of these considerations, we are confident that the DBC-P24 will be accurate and reliable in giving estimates of Mean Behavior Problem Score and caseness decisions in research contexts where a compact instrument is required. The items comprising DBC-P24, together with their item numbers in the DBC-P, are provided in Appendix A.
Acknowledgments
The authors gratefully acknowledge continuing funding for the Australian Child to Adult Development study from the Australian National Health and Medical Research council. The work was also partly supported by the National Institute of Mental Health Grant MH61809-02 to Bruce Tonge.
Appendix A
The DBC-P Items Comprising the Developmental Behaviour Checklist (DBC-P24) Short Form
| DBC-P item no | Item |
|---|---|
| 7 | Becomes overexcited |
| 10 | Chews or mouths objects or body parts |
| 13 | Confuses the use of pronouns (e.g., uses you instead of I) |
| 17 | Doesn’t show affection |
| 29 | Grinds teeth |
| 30 | Has nightmares, night terrors, or walks in sleep |
| 35 | Impatient |
| 36 | Inappropriate sexual activity with another |
| 39 | Jealous |
| 40 | Kicks, hits others |
| 42 | Laughs or giggles for no obvious reason |
| 58 | Preoccupied with only one or two particular interests |
| 59 | Refuses to go to school, activity center, or workplace |
| 63 | Repeats the same word or phrase over and over |
| 64 | Smells, tastes, or licks objects |
| 72 | Switches lights on and off, pours water over and over, or similar repetitive behavior |
| 74 | Stubborn, disobedient, or uncooperative |
| 77 | Says he/she can do things that he/she is not capable of |
| 79 | Sees, hears, something that isn’t there, hallucinations |
| 83 | Tells lies |
| 85 | Tense, anxious, worried |
| 88 | Underreacts to pain |
| 91 | Upset or distressed over small changes in routine or environment |
| 94 | Wanders aimlessly |
Contributor Information
John R. Taffe, Centre for Developmental Psychiatry and Psychology, Monash University (Melbourne, Australia)
Kylie M. Gray, Centre for Developmental Psychiatry and Psychology, Monash University (Melbourne, Australia)
Stewart L. Einfeld, University of New South Wales (Sydney, Australia)
Marielle C. Dekker, Erasmus MC-Sophia Children’s Hospital (The Netherlands)
Hans M. Koot, Vrije Universiteit (Amsterdam, The Netherlands)
Eric Emerson, Institute for Health Research, Lancaster University (United Kingdom).
Terhi Koskentausta, Pääjärvi Rehabilitation Centre (Lammi, Finland).
Bruce J. Tonge, Centre for Developmental Psychiatry and Psychology, Monash University
References
- Achenbach TM. Manual for the Child Behavior Checklist/4-18 and 1991 profile. University of Vermont, Department of Psychiatry; Burlington: 1991. [Google Scholar]
- Bekker H, Marteau TM. The development of a six-item short-form of the state scale of the Spielberger State-Trait Anxiety Inventory (STAI) British Journal of Clinical Psychology. 1992;31:301–306. doi: 10.1111/j.2044-8260.1992.tb00997.x. [DOI] [PubMed] [Google Scholar]
- Bock RD. A brief history of item response theory. Educational Measurement: Issues and Practice. 1997;16(4):21–33. [Google Scholar]
- Davison AC, Hinkley DV. Bootstrap methods and their application. Cambridge University Press; Cambridge: 1997. [Google Scholar]
- Dekker MC, Nunn RJ, Einfeld SE, Tonge BJ, Koot HM. Assessing emotional and behavioral problems in children with intellectual disability: Revisiting the factor structure of developmental behavior checklist. Journal of Autism and Developmental Disorders. 2002;32:601–610. doi: 10.1023/a:1021263216093. [DOI] [PubMed] [Google Scholar]
- Dekker MC, Nunn R, Koot HM. Psychometric properties of the revised Developmental Behaviour Checklist scales in Dutch children with intellectual disability. Journal of Intellectual Disability Research. 2002;46:61–75. doi: 10.1046/j.1365-2788.2002.00353.x. [DOI] [PubMed] [Google Scholar]
- Efron B, Tibshirani R. Bootstrap measures for standard errors, confidence intervals, and other measures of statistical accuracy. Statistical Science. 1986;1:54–77. [Google Scholar]
- Einfeld SL, Tonge BJ. The Developmental Behaviour Checklist: The development and validation of an instrument to assess behavioural and emotional disturbance in children and adolescents with mental retardation. Journal of Autism and Developmental Disorders. 1995;25(2):81–104. doi: 10.1007/BF02178498. [DOI] [PubMed] [Google Scholar]
- Einfeld SL, Tonge BJ. Population prevalence of psychopathology in children and adolescents with intellectual disability: I. Rationale and methods. Journal of Intellectual Disability Research. 1996a;40:91–98. doi: 10.1046/j.1365-2788.1996.767767.x. [DOI] [PubMed] [Google Scholar]
- Einfeld SL, Tonge BJ. Population prevalence of psychopathology in children and adolescents with intellectual disability: II. Epidemiological findings. Journal of Intellectual Disability Research. 1996b;40:99–109. doi: 10.1046/j.1365-2788.1996.768768.x. [DOI] [PubMed] [Google Scholar]
- Einfeld SL, Tonge BJ. Manual for the Developmental Behaviour Checklist: Primary Carer Version (DBC-P) and Teacher Version (DBC-T) 2nd ed. Monash University Centre for Developmental Psychiatry and Psychology; Clayton, Melbourne. Australia: 2002. [Google Scholar]
- Emerson E, Robertson J, Wood J. The mental health needs of children and adolescents with intellectual disabilities in an urban conurbation. Lancaster University, Institute for Health Research; 2004. [DOI] [PubMed] [Google Scholar]
- Feller W. An introduction to probability: Theory and its applications. Wiley; New York: 1967. [Google Scholar]
- Goldberg DP, Hillier VF. A scaled version of the General Health Questionnaire. Psychological Medicine. 1979;9:139–145. doi: 10.1017/s0033291700021644. [DOI] [PubMed] [Google Scholar]
- Hastings RP, Brown T, Mount RH, Cormack KFM. Exploration of psychometric properties of the Developmental Behaviour Checklist. Journal of Autism and Developmental Disorders. 2001;31:423–431. doi: 10.1023/a:1010668703948. [DOI] [PubMed] [Google Scholar]
- Koskentausta T, Almqvist F. Developmental Behaviour Checklist (DBC) in the assessment of psychopathology in Finnish children with intellectual disability. Journal of Intellectual and Developmental Disability. 2004;29:27–39. doi: 10.1016/j.ridd.2003.12.001. [DOI] [PubMed] [Google Scholar]
- Mohr C, Tonge BJ, Einfeld SL. The development of a new measure for the assessment of psychopathology in Finnish children with intellectual disability. Journal of Intellectual and Developmental Disability. 2005;29:27–39. doi: 10.1111/j.1365-2788.2005.00701.x. [DOI] [PubMed] [Google Scholar]
- Newton JT, Sturmey P. Development of a short form of the Treatment Evaluation Inventory for acceptability of psychological interventions. Psychological Reports. 2004;94:475–481. doi: 10.2466/pr0.94.2.475-481. [DOI] [PubMed] [Google Scholar]
- Tonge BJ, Einfeld SL. Psychopathology and intellectual disability: The Australian Child to Adult longitudinal study. In: Glidden LM, editor. International review of research in mental retardation. Vol. 26. Academic Press; San Diego: 2003. pp. 61–91. [Google Scholar]
- Wilks SS. Mathematical statistics. Wiley; New York: 1962. [Google Scholar]