

Abstract
Multi-photon excitation fluorescence microscopy is a state-of-the-art confocal imaging technique ideal for deep optical sectioning of living tissues. It is capable of performing ultra-sensitive, quantitative imaging of organ functions in health and disease with high spatial and temporal resolution that other imaging modalities can not achieve. For more than a decade, multi-photon microscopy has been successfully used with various in vitro and in vivo experimental approaches to study many functions of organs, including the kidney. This mini-review focuses on recent advances in our knowledge of renal (patho)physiological processes made possible by the use of this imaging technology. Visualization of cellular variables like cytosolic calcium, pH, cell-to-cell communication and signal propagation, interstitial fluid flow in the juxtaglomerular apparatus (JGA), real-time imaging of tubuloglomerular feedback (TGF) and renin release mechanisms are reviewed. Brief summary is provided how one can perform quantitative imaging of kidney functions in vivo including glomerular filtration and permeability, concentration, dilution, and activity of the intra-renal renin-angiotensin system using this minimally invasive approach. New visual data challenge a number of existing paradigms in renal (patho)physiology. Also, quantitative imaging of kidney function with multi-photon microscopy has excellent potential to eventually provide novel non-invasive diagnostic and therapeutic tools for future applications in clinical nephrology.
Imaging of JGA functions in vitro
Multi-photon fluorescence microscopy offers the advantages of deep confocal sectioning of living tissue with minimal phototoxicity and high, subcellular resolution.1 In combination with in vitro experimental models, both cortical and medullary structures freshly dissected from the rabbit kidney have been successfully visualized.2 Since multi-photon microscopy can section through an entire glomerulus (about 100 μm in diameter), it has been used with the isolated microperfused afferent arteriole-glomerulus technique to study dynamic processes of (juxta)glomerular structures.2–8 Fig. 1A shows a representative preparation and illustrates how the combination of conventional transmitted light (DIC) detection with two-photon fluorescence imaging of cellular or subcellular structures (for example renin granular content) provides additional, enhanced detail. Since the low cytotoxicity of multi-photon excitation allows continuous imaging of living tissues, real-time imaging of the tubuloglomerular feedback (TGF) and renin release mechanisms became possible.5–6 This visual approach provided significant new information on these fundamental mechanisms regulating renal blood flow, glomerular filtration rate and activating the renin-angiotensin system. Novel, TGF-associated morphological findings include significant cell volume changes of the macula densa under isotonic3 or hypertonic conditions4, the existence of bulk fluid flow in the JGA8, a sphincter-like contraction of the terminal, intraglomerular afferent arteriole2,3, and the TGF-associated contraction of not only the afferent arteriole, but the entire intraglomerular mesangium.3,5 Spreading of the TGF vasoconstrictor signal in the JGA and beyond involves an extracellular ATP-mediated purinergic calcium wave5. This wave was directly visualized with confocal microscopy (Fig. 1B), propagating from the macula densa and extraglomerular mesangial area to the afferent arteriole, along the vasculature to adjacent glomeruli and also to all cells of the glomerulus including the most distant podocytes.5 Propagation of the TGF calcium wave from afferent arteriole smooth muscle cells to the underlying endothelium was also observed in these studies.5 This phenomenon may provide a negative feedback and helps to balance the TGF vasoconstriction by triggering endothelium-derived vasodilator mechanisms. These imaging studies further emphasized the roles of both gap junctional communication and extracellular ATP as integral components of TGF. In addition, these studies provided functional evidence that complementing the afferent arteriolar vasoconstriction, all cells of the glomerulus actively participate in TGF by contracting the glomerular tuft, thereby helping to reduce the rate of glomerular filtration. The unexpected finding that the calcium wave of TGF was mediated by extracellular ATP provided further support that ATP itself is directly involved in TGF and not only through its breakdown to adenosine.5
Figure 1.

Multi-photon imaging of the juxtaglomerular apparatus using the microperfused afferent arteriole (AA)-glomerulus (G)-attached macula densa (MD) preparation. A: Visualization of individual renin granules and exocytosis of granular content in JG granular cells using quinacrine (green). Differential interference contrast (DIC) overlay. B: Fluo-4 and Fura red ratiometric calcium imaging. High ratio values indicate significant elevations in [Ca2+]i in both AA and intraglomerular cells after TGF activation. Bar is 20 μm. EA: efferent arteriole.
Renin release is the first, and at least initially, the rate-limiting step in the activation of the renin-angiotensin system which helps to maintain body salt and water balance. Additional details of the renin release mechanism were also observed using the multi-photon imaging approach. Acidotropic fluorophores including quinacrine and LysoTracker dyes (Invitrogen) are highly membrane permeant weak base compounds that rapidly accumulate in acidic cellular organelles. They have been successfully used to label renin granular content both in vitro6–7 and in vivo7–10, and even as a counter stain on histological sections.6 Imaging the entire granular content as opposed to labeling specific molecules of interest (renin itself) is a great advantage when studying the mechanism and regulation of renin granule exocytosis. For example, there is a renewed interest in prorenin which is part of the granular content and therefore its release is also visualized, but it can not be detected by existing assays measuring renin activity since it is enzymatically inactive. Renin exocytosis has been visualized in real-time and on the individual renin granule level in response to a number of physiological stimuli including beta-adrenergic activation, low perfusion pressure and the macula densa mechanism.2,6 Dimming and disappearance of the entire granular content (quantal release) was observed within 2–300 ms.6 A significant number of renin granules released into the interstitial side of the JGA, in addition to the vascular lumen.6 Not only the degranulation process, but enzyme activity of the released renin (angiotensin I generation) was visualized in real-time using a FRET-based renin substrate.6,9 Together with imaging the actual renin content, this approach is very useful to monitor the status of the intra-renal renin-angiotensin system, an important target of anti-hypertensive therapy.9
Quantitative imaging of kidney functions in vivo
The first years after multi-photon microscopy became commercially available (around 1995) was the “awe” period of in vivo organ imaging. The emphasis however, soon shifted from just generating pretty images to the development of quantitative imaging techniques for the evaluation of organ function. Studies aimed to establish new procedures or to extend existing methods in fluorescence imaging to directly observe and quantify basic physiological parameters of the kidney10–18 including single nephron glomerular filtration rate (SNGFR), glomerular permeability, blood flow, tubular flow, tubular reabsorption, urinary concentration/dilution, renin content and release, as well as more integrated and complex functions like the tubuloglomerular feedback (TGF)-mediated oscillations in glomerular filtration and tubular flow.10 Fig. 2 provides examples for some of these approaches. Using multi-photon techniques, dynamic processes such as glomerular filtration13,18, proximal tubule endocytosis15, apoptosis13, microvascular function13,14, protein expression16, renal cysts17 have been visualized and studied down to the subcellular level. A ratiometric intravital two-photon microscopy technique based on the generalized polarity concept has been recently applied to quantify glomerular filtration and tubular reabsorption.18 Yu et al also reported a new ratiometric measurement technique based on intravital fluorescence microscopy that allows rapid evaluations of renal function in rodent models.19 By using this technique, plasma clearance rates of a fluorescent GFR marker can be measured in less than five minutes following a bolus infusion of a fluorescent dye mixture into the blood stream. Intravital multi-photon imaging provided evidence for intense proximal tubular reabsorption of negatively charged macromolecules (albumin, dextran) which provided further explanation for their low amounts in the urine.14,20 Also, the glomerular filter appears to normally leak albumin at nephrotic levels. 20 These important findings question the paradigms of charge selectivity of the glomerular filtration barrier and the mechanism of albuminuria. Instead, they strongly support the new concept that albuminuria does not occur because of the filtered albumin load is avidly bound and retrieved by the proximal tubule. Dysfunction of this retrieval pathway leads to albuminuria. 20
Figure 2.
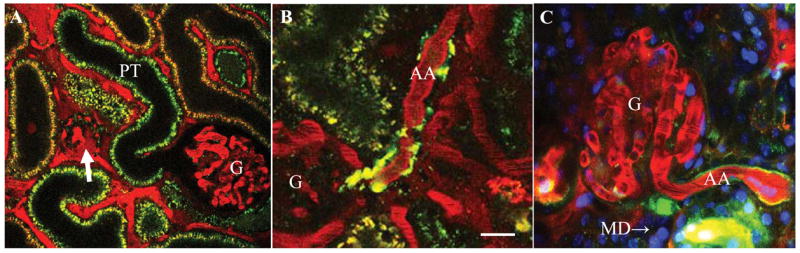
In vivo multi-photon imaging of the intact rodent kidney (A–B: rat, C: mouse). Rhodamine B-conjugated 70 kD dextran (red) was given iv to label the cortical vasculature (plasma). Quinacrine (green) is a strong marker of renin granular content in the afferent arteriole (AA) and it also weakly stains renal tubules (proximal tubule, PT). A: In vivo imaging of the STZ-diabetic kidney and visualization of glomerular permeability. A sclerotic (arrow) and a hyperfiltering glomerulus (G) are shown. Note the intense ultrafiltration of the high molecular weight (70 kD) dextran-rhodamine B (red) from the plasma into the Bowman’s space in the sclerotic, but not in the hyperfiltering glomerulus. B: In vivo imaging of the juxtaglomerular renin content in the diabetic kidney treated with an angiotensin II type 1 receptor (AT1) blocker. Note the significantly increased renin content around the juxtaglomerular portion of the afferent arteriole (AA). C: Multi-photon image of the proximal (P) and juxtaglomerular (JG) segments of the afferent arteriole (AA) in mouse. Content of individual renin granules is labeled by quinacrine (green). The vascular endothelium is labeled by the endocytosis of lucifer yellow (yellow). Note the intense and continuous yellow labeling in the proximal AA segment compared to the weakly fluorescent dash-dot pattern in the JG, renin-positive part. MD: macula densa. Scale is 20 μm.
Multi-photon quantitative imaging techniques were applied to disease models including renal ischemia20, diabetes9,10, cystic kidney17 and also to directly visualize and quantify drug delivery21 and the effects of therapeutic interventions9,21. For example, increased SNGFR and glomerular permeability were observed in untreated STZ-diabetic rats10 (Fig. 2A). Angiotensin II AT1 receptor inhibition improved many functional parameters12, but also caused a significant increase in JGA renin content9 (olmesartan, Fig. 2B).
Intravital multi-photon microscopy was used to directly visualize fenestration of the afferent arteriole endothelium in the renin expressing segment, bulk fluid flow in the JGA originating from the afferent arteriolar ultrafiltration of plasma into the JGA interstitium as well as the flow of glomerular filtrate in the Bowman’s space back into the extraglomerular mesangium.8 Labeling the afferent arteriole endothelium by the endocytosis of the fluid marker lucifer yellow revealed heterogeneity of the preglomerular vasculature (Fig. 2C). LY stained the proximal and JG AA endothelium segments differently. In the proximal portion, the endothelium appeared as a solid and intensely fluorescent line, but it was weakly fluorescent with a discontinuous line pattern in the JG segment (Fig. 2C). These studies concluded that significant and dynamic fluid flow exists in the JGA which may help filter the released renin into the renal interstitium (endocrine function). It may also modulate TGF and renin signals in the JGA (hemodynamic function). These findings challenge the existing paradigm of the stable and isolated JGA environment.
Imaging cytosolic ion concentrations in vivo
In vitro model systems, cell cultures and isolated, microperfused renal tissue techniques have been widely used in combination with fluorescence imaging to measure cytosolic ion concentrations and variables including pH, Ca2+, Na+, Cl−, cell volume, etc.22 However, it may be desirable to confirm if these measurements, cellular processes are relevant to in vivo conditions and also exist in the intact kidney. One or two-photon excitation confocal imaging, depending on the tissue depth, is ideally suited to achieve this task with close to real-time, subcellular resolution. Fig. 3 demonstrates that it is possible to measure cytosolic ion concentrations (for example pH and calcium) in superficial tubular segments (both in proximal and distal tubules) with conventional one-photon fluorescence excitation. For optical sectioning of deeper structures, two-photon may be required. Loading of tubular epithelial cells with a fluorophore is technically the easiest in the distal nephron (Fig. 3A) taking advantage of the high luminal dye concentrations there attained by the renal concentrating mechanism. Using mice, a single iv bolus injection of the calcium sensitive dye Fluo-4 results in sufficient loading of the distal nephron (Invitrogen, 50 μg AM form dissolved in 1 μl DMSO and diluted in 50 μl Ringer solution, excitation at 488 nm, emission at 520 nm). In preliminary experiments a number of cells in the cortical collecting duct showed intense calcium oscillations (Fig. 3A). In contrast, in cortical structures where blood flow or tubular flow and consequently washout of the dye are high (glomerulus, proximal tubule), injecting fluorophores locally, under the renal capsule may be a better loading strategy. Fig. 3B exemplifies loading of proximal tubule cells with the pH sensitive dye BCECF injected under the renal capsule (prepared the same way as above for Fluo-4, excitation at 488 nm by the Argon laser or at 800 nm by the MP laser, emission at 530 nm). In preliminary assays in mice, loading required ~5–10 min, during which time BCECF fluorescence intensity stabilized at values of at least one order of magnitude greater than background fluorescence. Fig. 3B shows that BCECF fluorescence intensity was the highest (indicating high, alkalotic pHi) in the brush-border membrane area, consistent with significant bicarbonate reabsorption into the relatively small cytosolic volume of apical microvilli. Developing a reproducible method to measure Na+/H+ exchanger activity in vivo will be an important tool to directly assess the role of the proximal tubule in salt and water reabsorption under various conditions.
Figure 3.

In vivo imaging of cell [Ca2+] in the intact mouse cortical collecting duct (CCD) (A) and cell pH in the proximal tubule (PT) (B). Fluo-4 or BCECF was loaded in the living kidney to measure cell [Ca2+] and pH, respectively. Note the diffuse cytosolic distribution of Fluo-4 fluorescence in the CCD, but the primarily apical, microvillar BCECF fluorescence in the PT. Intense [Ca2+] oscillations were observed in some CCD cells (arrow). On panel A, the intense, patchy labeling in the PT is mainly tissue autofluorescence, typical for this tubular segment. Rhodamine B-conjugated 70 kD dextran (red) was given iv to label peritubular capillaries (plasma). DT: distal tubule containing highly fluorescent, concentrated tubular fluid. Scale is 20 μm.
Conclusion
Multi-photon excitation fluorescence microscopy is an excellent imaging technique for the study of the complex renal (patho)physiological mechanisms in the living kidney both in vivo and in vitro. New visual data challenge a number of existing paradigms in renal physiology. Also, quantitative imaging of kidney function with multi-photon microscopy has excellent potential to eventually provide novel non-invasive diagnostic and therapeutic tools for future applications in clinical nephrology.
Acknowledgments
This work was supported by grants from NIH DK064324, and AHA Established Investigator Award 0640056N to JPP. We thank the Sankyo Company in Tokyo, Japan for providing olmesartan. L. Rosivall was a Fulbright Fellow at the University of Southern California during parts of these studies.
References
- 1.Zipfel WR, Williams RM, Webb WW. Nonlinear magic: multiphoton microscopy in the biosciences. Nat Biotechnol. 2003;11:1369–77. doi: 10.1038/nbt899. [DOI] [PubMed] [Google Scholar]
- 2.Peti-Peterdi J. Multiphoton imaging of renal tissues in vitro. Am J Physiol Renal Physiol. 2005;288:F1079–83. doi: 10.1152/ajprenal.00385.2004. [DOI] [PubMed] [Google Scholar]
- 3.Peti-Peterdi J, Morishima S, Bell PD, et al. Two-photon excitation fluorescence imaging of the living juxtaglomerular apparatus. Am J Physiol Renal Physiol. 2002;283:F197–201. doi: 10.1152/ajprenal.00356.2001. [DOI] [PubMed] [Google Scholar]
- 4.Komlosi P, Fintha A, Bell PD. Unraveling the relationship between macula densa cell volume and luminal solute concentration/osmolality. Kidney Int. 2006;70:865–71. doi: 10.1038/sj.ki.5001633. [DOI] [PubMed] [Google Scholar]
- 5.Peti-Peterdi J. Calcium wave of tubuloglomerular feedback. Am J Physiol Renal Physiol. 2006;291:F473–80. doi: 10.1152/ajprenal.00425.2005. [DOI] [PubMed] [Google Scholar]
- 6.Peti-Peterdi J, Fintha A, Fuson AL, et al. Real-time imaging of renin release in vitro. Am J Physiol Renal Physiol. 2004;287:F329–35. doi: 10.1152/ajprenal.00420.2003. [DOI] [PubMed] [Google Scholar]
- 7.Toma I, Kang JJ, Peti-Peterdi J. Imaging renin content and release in the living kidney. Nephron Physiol. 2006;103:p71–4. doi: 10.1159/000090622. [DOI] [PubMed] [Google Scholar]
- 8.Rosivall L, Mirzahosseini S, Toma I, et al. Fluid flow in the juxtaglomerular interstitium visualized in vivo. Am J Physiol Renal Physiol. 2006;291:F1241–7. doi: 10.1152/ajprenal.00203.2006. [DOI] [PubMed] [Google Scholar]
- 9.Kang JJ, Toma I, Sipos A, et al. Imaging the renin-angiotensin system: an important target of anti-hypertensive therapy. Adv Drug Deliv Rev. 2006;58:824–33. doi: 10.1016/j.addr.2006.07.006. [DOI] [PubMed] [Google Scholar]
- 10.Kang JJ, Toma I, Sipos A, et al. Quantitative imaging of basic functions in renal (patho)physiology. Am J Physiol Renal Physiol. 2006;291:F495–502. doi: 10.1152/ajprenal.00521.2005. [DOI] [PubMed] [Google Scholar]
- 11.Simeoni M, Boyde A, Shirley DG, et al. Application of red laser video-rate scanning confocal microscopy to in vivo assessment of tubular function in the rat: selective action of diuretics on tubular diameter. Exp Physiol. 2004;89:181–5. doi: 10.1113/expphysiol.2003.002643. [DOI] [PubMed] [Google Scholar]
- 12.Li B, Yao J, Kawamura K, et al. Real-time observation of glomerular hemodynamic changes in diabetic rats: effects of insulin and ARB. Kidney Int. 2004;66:1939–48. doi: 10.1111/j.1523-1755.2004.00979.x. [DOI] [PubMed] [Google Scholar]
- 13.Dunn KW, Sandoval RM, Kelly KJ, et al. Functional studies of the kidney of living animals using multicolor two-photon microscopy. Am J Physiol Cell Physiol. 2002;283:C905–16. doi: 10.1152/ajpcell.00159.2002. [DOI] [PubMed] [Google Scholar]
- 14.Molitoris BA, Sandoval RM. Intravital multiphoton microscopy of dynamic renal processes. Am J Physiol Renal Physiol. 2005;288:F1084–9. doi: 10.1152/ajprenal.00473.2004. [DOI] [PubMed] [Google Scholar]
- 15.Sandoval RM, Kennedy MD, Low PS, et al. Uptake and trafficking of fluorescent conjugates of folic acid in intact kidney determined using intravital two-photon microscopy. Am J Physiol Cell Physiol. 2004;287:C517–26. doi: 10.1152/ajpcell.00006.2004. [DOI] [PubMed] [Google Scholar]
- 16.Tanner GA, Sandoval RM, Molitoris BA, et al. Micropuncture gene delivery and intravital two-photon visualization of protein expression in rat kidney. Am J Physiol Renal Physiol. 2005;289:F638–43. doi: 10.1152/ajprenal.00059.2005. [DOI] [PubMed] [Google Scholar]
- 17.Tanner GA, Sandoval RM, Dunn KW. Two-photon in vivo microscopy of sulfonefluorescein secretion in normal and cystic rat kidneys. Am J Physiol Renal Physiol. 2004;286:F152–60. doi: 10.1152/ajprenal.00264.2003. [DOI] [PubMed] [Google Scholar]
- 18.Yu W, Sandoval RM, Molitoris BA. Quantitative intravital microscopy using a Generalized Polarity concept for kidney studies. Am J Physiol Cell Physiol. 2005;289:C1197–1208. doi: 10.1152/ajpcell.00197.2005. [DOI] [PubMed] [Google Scholar]
- 19.Yu W, Sandoval RM, Molitoris BA. Rapid Determination of Renal Filtration Function Using an Optical Ratiometric Imaging Approach. Am J Physiol Renal Physiol. 2007 doi: 10.1152/ajprenal.00218.2006. Epub ahead of print. [DOI] [PubMed] [Google Scholar]
- 20.Russo LM, Sandoval RM, McKee M, et al. The normal kidney filters nephrotic levels of albumin retrieved by proximal tubule cells: retrieval is disrupted in nephrotic states. Kidney Int. 2007;71:504–13. doi: 10.1038/sj.ki.5002041. [DOI] [PubMed] [Google Scholar]
- 21.Molitoris BA, Sandoval RM. Pharmacophotonics: utilizing multi-photon microscopy to quantify drug delivery and intracellular trafficking in the kidney. Adv Drug Deliv Rev. 2006;58:809–23. doi: 10.1016/j.addr.2006.07.017. [DOI] [PubMed] [Google Scholar]
- 22.Bell PD, Lapointe JY, Peti-Peterdi J. Macula densa cell signaling. Annu Rev Physiol. 2003;65:481–500. doi: 10.1146/annurev.physiol.65.050102.085730. [DOI] [PubMed] [Google Scholar]