

Abstract
Objective
To assess the effects of interference screws, which are commonly used to surgically fix an anterior cruciate ligament (ACL) graft in the ACL-deficient knee, and magnetic field strength on cartilage volume and thickness measurements with quantitative MRI (qMRI).
Methods
Five cadaver knees were imaged using a cartilage-sensitive sequence (T1-weighted WE-3D FLASH) on 1.5T and 3T scanners with and without interference screws implanted. The tibiofemoral articular cartilage was segmented and reconstructed from the MR images, and volume and thickness measurements were made on the resulting three-dimensional models.
Results
Although several load-bearing regions showed significant differences in volume and thickness between magnet strengths, most showed no significant difference between screw conditions. The medial tibial cartilage showed a mean decrease in volume of 5.9% and 8.0% in the presence of interference screws at 3T and 1.5T, respectively. At 3T and 1.5T, the medial tibial cartilage showed a mean decrease in thickness of 7.0% and 12.0%, respectively, in the presence of interference screws.
Conclusions
Caution should be used when interpreting thickness and volume of cartilage at 3T in the presence of interference screws, particularly in the medial tibial compartment. Additionally, 3T and 1.5T qMRI should not be used interchangeably to assess structural changes in tibiofemoral articular cartilage during longitudinal studies.
Keywords: Imaging, MRI, knee, ligament, ACL, cartilage, morphometry, osteoarthritis
Introduction
Patients who undergo anterior cruciate ligament (ACL) reconstruction may be at greater risk for early osteoarthritis (OA). Although many studies have evaluated the success of these procedures, few have attempted to examine the condition of the articular cartilage following surgery 1-5. There is some evidence to suggest that ACL-reconstructed knees will exhibit signs of cartilage degeneration within five years of surgery using subjective radiographic grading techniques 1, 3, 6, 7. Objective methods that could quantify temporal changes in articular cartilage morphometry would be useful to document the natural history of OA in the ACL-injured knee, and to evaluate long-term outcomes in response to different treatment options.
Quantitative magnetic resonance imaging (qMRI) provides a way to directly assess the integrity and composition of the articular cartilage in vivo 8-11. qMRI could provide insight into the mechanisms of OA in the ACL-injured and reconstructed knee by documenting temporal changes in articular cartilage volume and thickness associated with OA progression. With qMRI, three-dimensional virtual cartilage models are constructed from segmented MR images of articular cartilage using cartilage-sensitive pulse sequences. These models are then used to document changes in cartilage geometry over time 8, 9, 12. The precision of MRI-based cartilage volume measurements has been reported to range between 1-4% 11, 13-15. High degrees of reliability (interclass correlation coefficients greater than 0.92) have also been published 8. Using qMRI, the cartilage volume of the tibiofemoral joint has been shown to decrease 0.3-0.5% per year with natural aging 11, as compared to 4-6.5% per year in patients with radiographic evidence of OA 11, 16-18.
In one method commonly used to reconstruct the torn ACL, the proximal and distal bone blocks of the bone-patellar tendon-bone graft are typically fixed using titanium interference screws; one is placed in the femoral bone tunnel, and the other in the tibial bone tunnel. The screws, however, produce artifacts on MR images from magnetic susceptibility, or local distortions in the uniformity of the magnetic field lines, which could potentially affect the reliability of cartilage volume and thickness measurements. These artifacts are seen on MR images at the interface between materials of different magnetic susceptibility, such as metallic implants and surrounding tissues. Ferromagnetic metals, such as nickel, iron, and cobalt, exhibit large magnetic susceptibility and produce significant artifacts, while non-ferrous metals, such as titanium, show lower magnetic susceptibility, and therefore less artifact 19. Artifacts, which generally appear in the image as a signal void in the region around the implant (Figure 1), are directly proportional to the magnetic field strength, and are inversely proportional to the readout gradient strength and voxel size 19-22. The pulse sequence selected for MR imaging also influences image degradation. Susceptibility artifacts are greater for gradient-echo pulse sequences and are less conspicuous using turbo or fast spin-echo pulse sequences when compared to conventional spin-echo sequences 20, 23.
Figure 1.
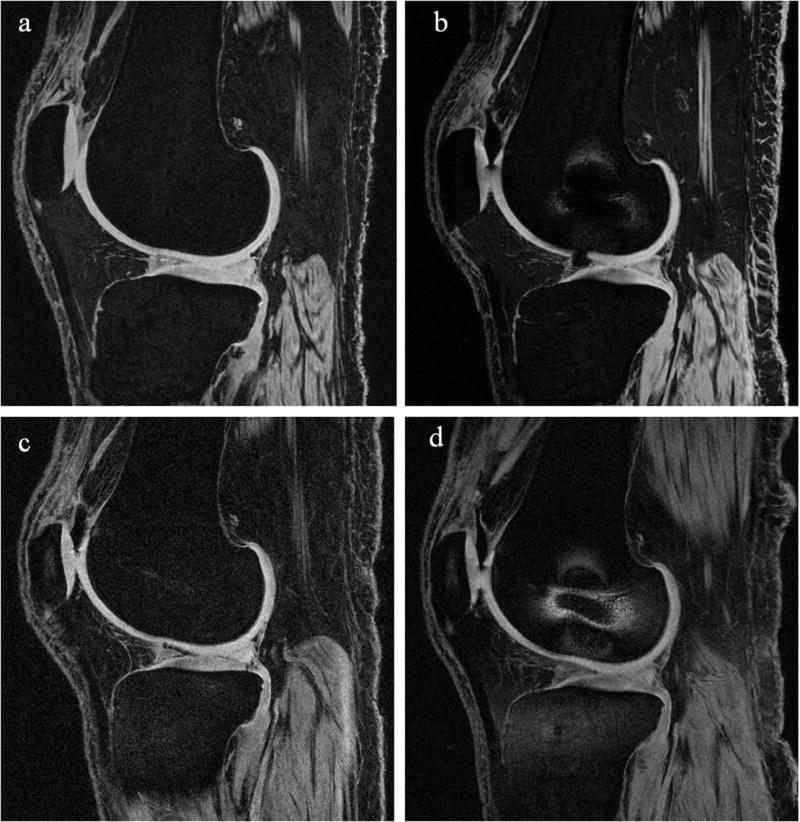
Representative sagittal-plane images of a single cadaver specimen imaged using the T1-weighted WE-3D FLASH sequence (a) at 3T without interference screws, (b) at 3T with interference screws, (c) at 1.5T without interference screws, and (d) at 1.5T with interference screws. These slices capture the lateral femoral condyle, so only the femoral interference screw is visible. It can be seen that the distortion is relatively localized around the femoral screw, and did not affect the overall cartilage segmentations of the tibiofemoral joint. Image (b) shows an air artifact near the anterior portion of the meniscus. Segmentation was interpolated over air artifacts.
MR imaging at 3T rather than 1.5T has recently been recommended for qMRI because the higher magnetic field strength provides greater resolution and a higher signal-to-noise ratio for detecting early changes in cartilage morphometry 13, 24. However, magnetic susceptibility artifacts could be amplified at 3T because of the higher field strength, or they may be less conspicuous because of the smaller voxel size.
The effect of magnetic susceptibility artifacts on images obtained from knees containing titanium interference screws is not known. Thus, it is necessary to evaluate any errors the screws may introduce before qMRI can be used to document the progression of OA in the ACL-reconstructed patient. The objectives of this study were to assess the effect of tibial and femoral interference screws on articular cartilage volume and thickness measurements from segmented images obtained on both 1.5T and 3T scanners. We hypothesized that: 1) there would be no significant difference in the tibial and femoral cartilage volume and thickness measurements with and without interference screws placed in the knee; and 2) the cartilage volume and thickness measurements reconstructed from 1.5T and 3T images would be equivalent.
Materials and Methods
SPECIMENS
Five fresh frozen, intact, right human cadaver knees (3 female, 2 male) were acquired for this study. The mean age of the subjects from whom the specimens were obtained was 56 (range, 51-59) years. The specimens had no evidence of ligament or meniscal tears. Three of the specimens had signs of articular cartilage surface wear (2 mild, 1 moderate) by visual inspection.
MR IMAGING
All knees were imaged on 1.5T and 3T magnets (Siemens Symphony and Trio, respectively; Erlangen Germany), using commercially available polarized knee coils. The manufacturers of the quadrature knee coils were Siemens Medical Systems (Erlangen, Germany) and USA Instruments, Inc. (Aurora, OH) for the 1.5T and 3T magnets, respectively. In a preliminary evaluation of several pulse sequences frequently used for quantitative cartilage segmentation, we found that the T1-weighted, water-excitation, three-dimensional fast low-angle shot (WE-3D FLASH) sequence on the 3T scanner minimized image distortion from magnetic susceptibility artifacts and maximized cartilage-bone contrast compared to fat-saturated, intermediate-weighted spin echo pulse sequences (Table 1). A similar WE-3D FLASH sequence was adopted for use on the 1.5T magnet (Table 1).
Table 1.
Pulse sequences employed on the 3T and 1.5T scanners.
| 3 Tesla | 1.5 Tesla | |
|---|---|---|
| qMRI | T1-weighted water-excitation three-dimensional fast low-angle shot (WE-3D FLASH): 20/7.6 [TR(ms)/ TE(ms)]; 12° [flip angle]; 160mm [field of view]; 0.3125mm/1.5mm/0mm [in-plane resolution/slice thickness/interslice gap]; 80 slices per slab; 130 hz/pixel [bandwidth]; 512×512 [matrix]; right/left [phase encoding direction]; one average of two excitations. (With screws: SNR = 72.9, SNRe = 3.6sec-1/2; without screws: SNR = 41.3, SNRe = 2.1sec-1/2). | T1-weighted WE-3D FLASH: 17.2/7.3; 30°; 160mm; 0.3125mm/2mm/0mm [in-plane resolution/slice thickness/interslice gap]; 52 slices per slab; 160 hz/pixel; 512×512; anterior-posterior; one average. (With screws: SNR = 25.6, SNRe = 1.2sec-1/2; without screws: SNR = 19.2, SNRe = 0.9sec-1/2). |
ACL INTERFERENCE SCREWS
Two 9×20mm titanium interference screws (Arthrex, Inc; Naples FL) were placed in the tibia and femur with the aid of an arthroscope and a commercial drill guide system for ACL reconstruction (Arthrex, Inc; Naples FL). The screw locations were selected to duplicate those typically used to affix an ACL allograft during surgery. Complete ACL reconstruction was not performed.
TEST PROTOCOL
After thawing, the specimens were wrapped in plastic bags to protect the scanning equipment from biohazard contamination. Each knee was placed in full extension and positioned within a transmit-receive knee surface coil and the magnet following the manufacturer-recommended protocol for positioning a patient for a knee evaluation. All scans were performed by certified MR technologists.
Each knee was scanned on the 1.5T and 3T scanners, both with and without the interference screws implanted. To minimize bias, test order was determined using a block randomization procedure. Specimens were first randomized by screw condition (screws implanted versus no screws implanted), and then within each screw condition, they were randomized by magnetic field strength (1.5T versus 3T). A total of 20 volumetric scans were performed (2 screw conditions × 2 magnetic field strengths × 5 specimens) using the T1-weighted WE-3D FLASH sequence.
SEGMENTATION TECHNIQUE
The femoral and tibial articular cartilage structures of each specimen were manually segmented in the sagittal plane and reconstructed using commercial software (Mimics 9.11; Materialise, Ann Arbor, MI). Three-dimensional voxel models were generated and wrapped with a triangular mesh to create a virtual solid model of each cartilage structure. The solid models captured both articular cartilage volume and morphology.
TIBIOFEMORAL ARTICULAR CARTILAGE VOLUME
The three-dimensional femoral articular cartilage model was cropped in order to isolate the tibiofemoral joint. Cropping was performed along the anterior-posterior axis such that the posterior half of the distal femur was selected. The volume was then further separated into those of the medial and lateral femoral condyles for each screw and magnet condition. The volume of each three-dimensional model of the articular cartilage structures was determined by surface integration. Preliminary data showed coefficients of variation (CVs) of 1.8% and 2.8% for the femoral and tibial cartilage volumes, respectively (n = 7), indicating that these measurements are repeatable.
CARTILAGE THICKNESS
We focused our thickness measurements on specific load-bearing regions of interest (ROIs). A cylinder was fit to the bone-cartilage interface of the femoral cartilage model of the tibiofemoral joint (Figure 2). The notch marking the junction between the tibiofemoral and patellofemoral joints on the lateral condyle was identified on one sagittal MR image. A line was drawn from the notch (0°) to the center of the cylinder. Each condyle of the tibiofemoral joint was then divided at 40°, 70°, 100°, and 130° from the notch point (anterior) toward the posterior aspect of the condyle to create 6 patches of cartilage (3 medial, 3 lateral); the medial-lateral width of each patch was 20% of the overall medial-lateral width of the femoral cartilage and centered about the midline of each condyle.
Figure 2.
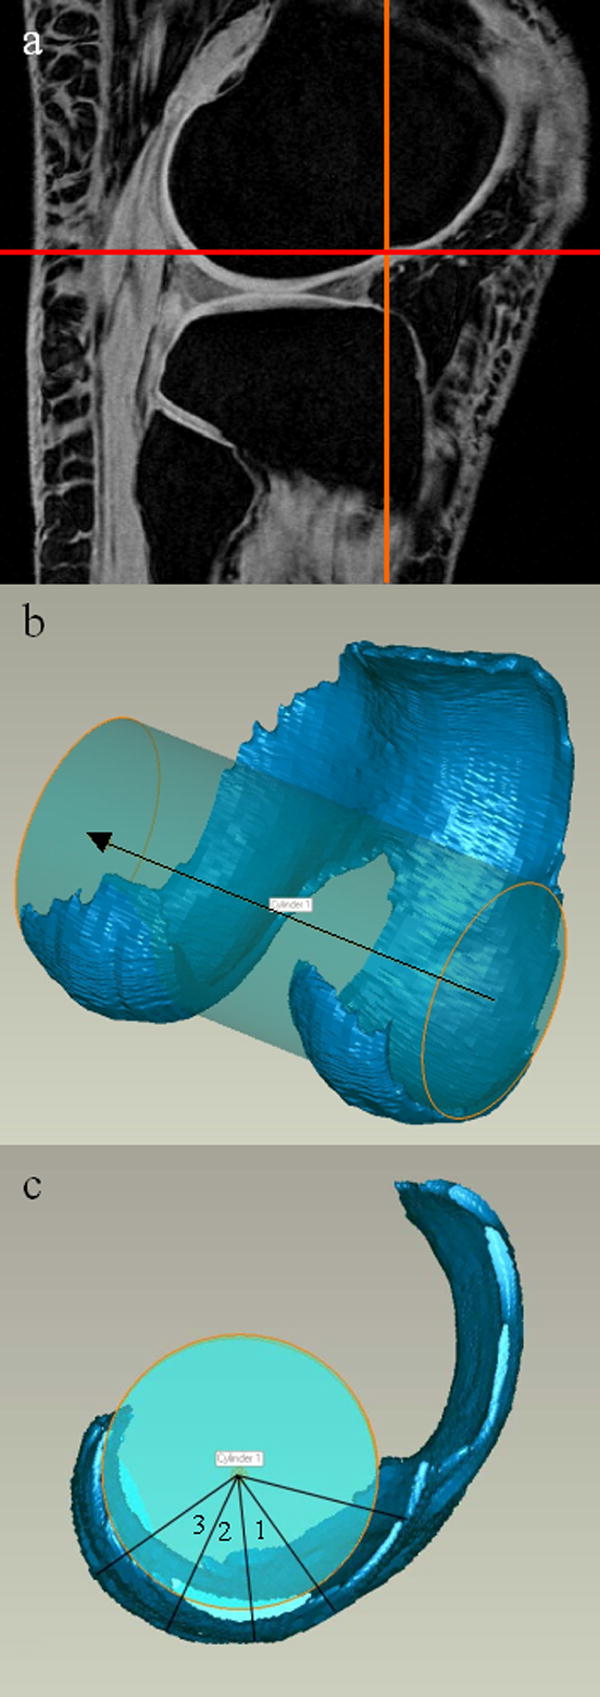
(A) The “notch” is marked by crosshairs on the lateral side of the TF joint, seen in the sagittal plane. (B) A cylinder was fit to the femoral condyles. (C) A line was drawn from the notch to the cylinder axis. The location of each ROI in the sagittal plane of the femur is shown.
Two regions on the tibial cartilage (1 medial, 1 lateral) were defined by calculating the centroids of each segmented cartilage region (compartment) using MATLAB (The Mathworks, Inc., Natick, MA). The inertial axes of the medial compartment were also determined using MATLAB, and axes of the same orientation were centered about the centroids of both the medial and lateral tibial compartments. The ROI for each compartment was then defined as the area ±20% of the overall anterior-posterior depth and ±15% of the overall medial-lateral width from the centroid (Figure 3). The average thickness of each patch was calculated by a closest point algorithm using MATLAB.
Figure 3.
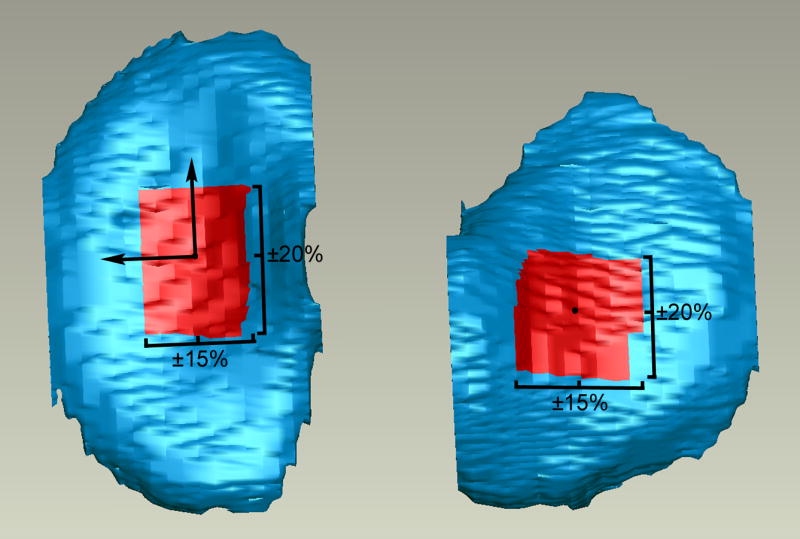
The ROIs for the tibial compartments are shown. Axes with the same orientation as those from the medial compartment were centered about the centroid of the lateral compartment to establish the coordinate system in that ROI. The orthogonal was oriented out of the page.
Preliminary data showed mean coefficients of variation (CVs) of 4.7% and 2.7% for the thicknesses of the femoral and tibial ROIs, respectively (n = 7), indicating that both the coordinate system and the ROI thickness determination are repeatable.
STATISTICAL ANALYSIS
Based on preliminary data, the sample size for this study was derived to have sufficient power (80%) to detect a 10% difference in tibial articular cartilage volume between experimental conditions. A two-way repeated measures analysis of variance was performed to compare (1) the cartilage volumes of the proximal tibia and distal femur in response to screw condition (screws versus no screws) and magnetic field strength (1.5T versus 3T), and (2) the cartilage thickness of each ROI in response to screw condition and magnetic field strength. Fisher’s least significant difference test was used to make pair-wise comparisons between conditions. Statistical significance was set at p<0.05.
Results
TIBIOFEMORAL ARTICULAR CARTILAGE VOLUME
There were no significant differences in the medial femoral cartilage volumes between magnet (12% reduction at 1.5T, p=0.07) or screw (1.0% reduction in the presence of screws, p=0.85) conditions (Table 2). For the lateral femoral cartilage volumes, there was a significant difference between magnet strengths (12.5% reduction at 1.5T, p=0.006), but not screw conditions (4.2% reduction in the presence of screws, p=0.16) (Table 2). No significant interaction was found between the screws and magnetic field strength conditions for either compartment (p>0.46).
Table 2.
Mean (±1 standard deviation) tibiofemoral cartilage volumes for each magnet and screw condition.
| Femoral Volume (mm3) | Tibial Volume (mm3) | ||||
|---|---|---|---|---|---|
| Magnet | Screw | Medial | Lateral | Medial | Lateral |
| 3T | No | 2896 (±1142) | 3711 (±1502) | 2265 (±898) | 3193 (±1205) |
| 3T | Yes | 2978 (±1409) | 3611 (±1534) | 2043 (±902) | 2915 (±1233) |
| 1.5T | No | 2722 (±1090) | 3429 (±1370) | 2159 (±796) | 2754 (±1046) |
| 1.5T | Yes | 2583 (±1188) | 3230 (±1326) | 1999 (±658) | 2790 (±1052) |
For the medial tibial cartilage volume, there was no significant difference between magnet strengths (5.9% reduction at 1.5T, p=0.46) (Table 2). There was, however, a trend for a screw effect (p=0.08). The mean decrease in cartilage volume due in the presence of the interference screws was less than 9% for this compartment. No significant interaction was found between screw condition and magnetic field strength (p=0.75). For the lateral tibial cartilage volumes, there was no significant difference between screw conditions (4.1% reduction in the presence of screws, p=0.30), but there was a significant difference between magnet strengths (p=0.03) (Table 2). The mean increase in the lateral tibial cartilage volume at 3T compared to 1.5T was 9.1%. No significant interaction was found between screw condition and magnetic field strength (p=0.19).
CARTILAGE THICKNESS
For the most anterior ROI on the medial femoral condyle (40-70°; Region 1 in Figure 2c), there was no significant difference in the mean thickness values between magnet strengths (8.8% reduction at 1.5T, p=0.09) or screw conditions (3.5% reduction in the presence of screws, p=0.39). For the central ROI on the medial femoral condyle (70-100°; Region 2 in Figure 2c), there was no significant difference in thickness between magnet strengths (3.4% reduction at 1.5T, p=0.46) or screw conditions (0.0% change in the presence of screws, p=0.99). For the posterior ROI on the medial femoral condyle (100-130°; Region 3 in Figure 2c), there was no significant difference in thickness between magnet strengths (1.8% increase at 1.5T, p=0.60) or screw conditions (1.3% increase in the presence of screws, p=0.81). No significant interactions were found between the screws and magnetic field strength conditions for any ROI (p>0.51) (Figure 4).
Figure 4.
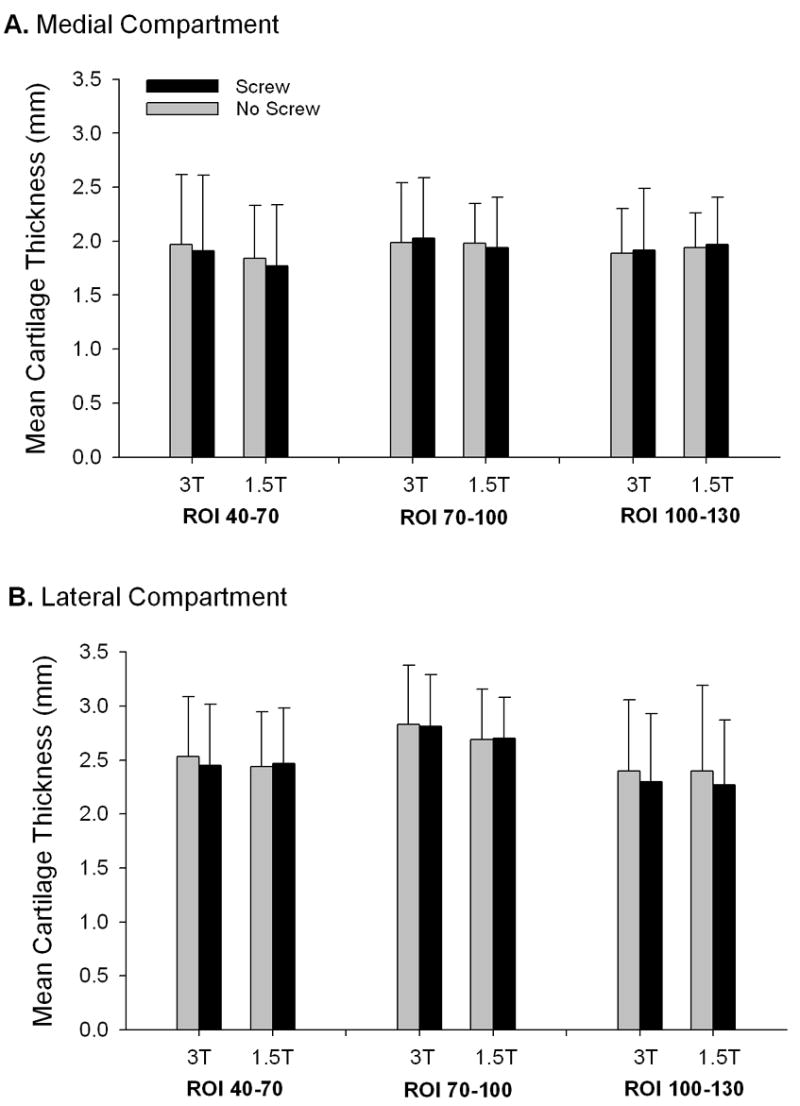
The mean femoral cartilage thicknesses for both screw condition and magnetic field strengths (error bars represent 1 standard deviation). (A) On the medial femoral condyle, there were no significant differences in thickness between magnet strengths or screw conditions for any ROI. (B) On the lateral femoral condyle, the 70-100° ROI showed a strong trend for interaction between magnet strengths (p=0.053). No other ROI on the lateral femoral condyle showed any significant differences in thickness between magnet strengths or screw conditions.
For the most anterior ROI on the lateral femoral condyle (40-70°) there was no significant difference in thickness between magnet strengths (0.1% increase at 3T, p=0.72) or screw conditions (0.9% decrease in the presence of screws, p=0.79). For the central ROI on the lateral femoral condyle (70-100°), there was no significant difference in thickness between screw conditions (0.0% decrease in the presence of screws, p=0.998), but there was a strong trend for an interaction between magnet strength and the presence of the screw, suggesting that the screw effect was magnet-dependent (p=0.053). For this ROI, there was a 1.5% mean difference in thickness between screw conditions at 3T, but only a 0.5% mean difference in thickness at 1.5T. In both cases, the thickness was greater in the presence of interference screws than without the screws. For the posterior ROI on the lateral femoral condyle (100-130°), there was no significant difference in thickness between magnet strengths (2.3% decrease at 1.5T, p=0.83) or screw conditions (4.9% decrease in the presence of screws, p=0.09) (Figure 5).
Figure 5.
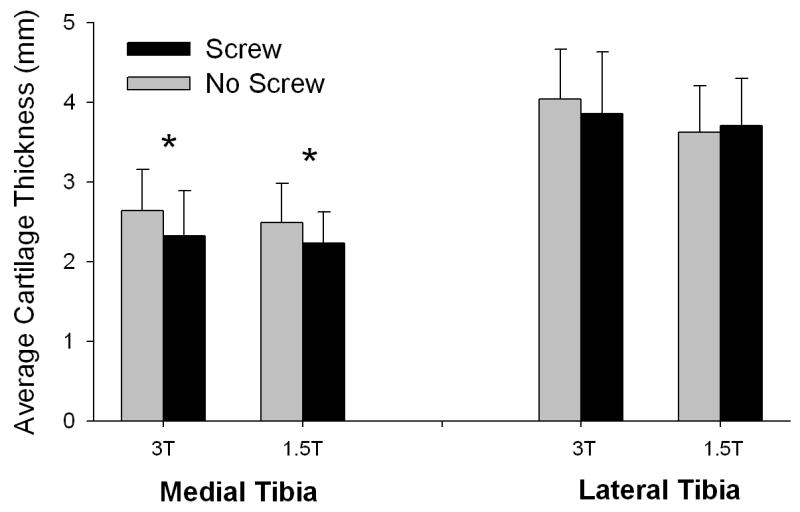
Average medial and lateral tibial cartilage thicknesses for both screw conditions and magnetic field strengths (error bars represent 1 standard deviation). For the medial tibial ROI, there was no significant difference in thickness between magnet strengths (p=0.35), but there was a significant difference in thickness between screw conditions (p=0.03). For the lateral tibial ROI, however, there was a significant difference in thickness between magnet strengths (p=0.004), but not screw conditions (p=0.57). No significant interaction was found between screw condition and magnetic field strength for any tibial ROI (p>0.11).
For the medial tibial ROI, there was no significant difference in thickness between magnet strengths (8.2% decrease at 1.5T, p=0.35), but there was a significant decrease in thickness in the presence of interference screws (p=0.03). The mean difference in thickness between screw conditions for this ROI was 11.5%. For the lateral tibial ROI, however, there was a significant increase in thickness at 3T compared to 1.5T (6.7% increase, p=0.004), but there was no significant difference in thickness between screw conditions (1.2% reduction in the presence of screws, p=0.57). No significant interaction was found between screw condition and magnetic field strength for any tibial ROI (p>0.11) (Figure 5).
Discussion
There is clinical evidence to suggest that patients who undergo ACL reconstruction continue to exhibit progressive articular cartilage damage in the reconstructed knee 1-3, 5, 25-28. However, there are many factors that may effect cartilage degeneration in the ACL-injured and reconstructed knee (i.e. initial subchondral trauma, concomitant injuries of the meniscus, general inflammation, altered joint motion and abnormal joint contact stresses) 29, 30. A quantitative method that is sensitive to early changes in articular cartilage structure, and that could be applied to patients who have undergone ACL reconstruction with titanium interference screws, would enable researchers to evaluate potential mechanisms of OA progression in this patient population. qMRI with cartilage-sensitive pulse sequences meets these requirements within certain constraints.
The T1-weighted WE-3D FLASH sequence is effective in tracking structural changes in articular cartilage for patients with OA 9. Bauer et al concluded that based on signal-to-noise and contrast-to-noise ratios, the water-excitation gradient-echo sequence at 3T is superior to both the fat-saturated gradient-echo sequence at 3T or 1.5T and to the turbo spin-echo sequence for volumetric cartilage calculations 31. The article did not investigate the water-excitation gradient-echo sequence at 1.5T. Our investigation used the water-excitation gradient-echo sequence on both the 3T and 1.5T magnets. Our study showed a slight increase in both SNR and the effective SNR (SNRe) in the presence of interference screws (Table 1). As expected, there was also a notable increase in both SNR and SNRe at 3T compared to 1.5T. To minimize the expected magnetic susceptibility artifacts on the gradient echo sequence, we selected MR imaging parameters to minimize voxel size. Our data demonstrate that measurements of tibiofemoral cartilage volume and thickness were largely unaffected by the presence of titanium interference screws, and that the lack of the screw effect was independent of magnetic field strength. Although most ROIs showed no differences in volume and thickness between screws or magnet strength, some differences were noted. The medial tibial cartilage volume showed a trend for a 9% reduction in cartilage volume when the screws were present. Similarly, the medial tibial ROI showed a significant decrease of 11.5% in the mean thickness value when the screw was present (p=0.03). The sensitivity of the medial tibial compartment to the presence of the screw is not surprising, because the screw is located just proximal to this compartment. Therefore, caution must be used when interpreting qMRI volume and thickness measurements in the medial compartment of the tibia in the presence of metallic interference screws. Although this does not exclude the use of qMRI for tracking changes in the other regions of the tibiofemoral joint, any changes in thickness less than approximately 0.30mm (11.5%) in the medial tibial compartment may be due to artifact and not cartilage degeneration. In contrast, the lateral femoral interference screw is farther away from the lateral femoral articular cartilage.
Kornaat et al imaged knees of ten healthy volunteers on both 1.5T and 3T scanners using a sagittal fat-suppressed 3D-steady-state-free-precession (SSFP) sequence, a sagittal Dixon 3D-SSFP sequence, and a 3D spoiled gradient recall echo sequence to measure cartilage thickness of the distal femur from each sequence 24. Although improvements were seen with respect to the signal-to-noise and contrast-to-noise ratios with the 3T scanner, no significant differences in cartilage thickness were reported between scanners or sequences 24. The thickness of the tibial cartilage was not evaluated 24. Eckstein et al also evaluated the precision of qMRI when performed on 1.5T and 3T magnets 13. They determined that cartilage volume and thickness measurements decreased with reductions in slice thickness, and that these measurements from the 1.5T and 3T MR images were highly correlated 13. When the qMRI data of these investigations are considered in conjunction with those of the present study, the potential benefits for using 3T are highlighted. These results suggest, at the very least, that it is prudent to use the same magnetic field strength when tracking longitudinal changes in cartilage volume within a patient.
There are several limitations of this study. First, the findings apply directly to articular cartilage segmentation based on the T1-weighted WE-3D FLASH sequence. The results of other cartilage-sensitive pulse sequences may be different. Prior to this study, we evaluated another cartilage-sensitive pulse sequence, the frequency selective fat-saturation turbo spin-echo intermediate-weighted sequence. Counterintuitively, we found that the T1-weighted WE-3D FLASH sequence minimized image distortion in the vicinity of the interference screws (Figure 1) while the fat-saturation turbo spin-echo intermediate-weighted sequence tended to increase magnetic susceptibility artifact. The T1-weighted 3D gradient echo sequence was superior to the turbo spin echo sequence with respect to both signal-to-noise and contrast-to-noise ratios for articular cartilage imaging 31. Thus, the T1-weighted WE-3D FLASH sequence was selected for this study.
The images used in this study were acquired from cadaver specimens, and were not compromised by either knee motion or blood flow artifacts. It is possible that the errors would be greater if the images were acquired in vivo 13. Nonetheless, the cadaver model was beneficial because it allowed us to systematically measure the effects of interference screws and magnetic field strength, using each specimen as its own control.
The articular cartilage segmentations in this study were performed manually using commercial software (Mimics 9.11). Semi-automated techniques have been developed to increase the accuracy and efficiency of segmentation 8, 24, 32, 33. To reduce potential sources of error and to minimize this concern, the cartilage segmentations in the present study were performed by a single trained examiner under the direction of a musculoskeletal radiologist.
Additionally, segmentations were not compared to a true gold standard in the present study. Preliminary data did, however, show mean CVs of 4.7% and 2.7% for the thicknesses of the femoral and tibial ROIs, respectively, and 1.8% and 2.8% for the femoral and tibial cartilage volumes, respectively, indicating that these measurements are repeatable.
Standard size (9 × 20mm) titanium interference screws were used in this study. We cannot determine from the present study whether larger or smaller interference screws would influence the results of qMRI differently. In general, one would expect that a larger interference screw would cause some increase in the size of the magnetic susceptibility artifact, though the relationship is not linear. The extent of the artifact also depends on the position and composition of the interference screw, as well as the selected pulse sequence parameters. However, because standard size screws were used in this study, the results apply to the majority of screws used for ACL reconstruction.
Complete ACL reconstructions were not performed on the cadavers imaged in this study. While it cannot be determined from our results whether the outcome would change if a complete ACL reconstruction were performed, we would not expect to see a chance in outcome with complete reconstruction because the interference screws would still be placed in the same locations, and other changes would involve only soft tissues. Since the ACL autograft courses through the intercondylar notch, and is not proximal to the femoral or tibial articular cartilage, one would not expect a major impact of the graft on imaging of the femoral or tibial articular cartilage, and therefore on volume and thickness measurements of this cartilage.
Freeze-thaw cycles and surgical intervention have the potential to introduce air artifacts into cadaver specimens. Although air and articular cartilage have vastly different intensities on MR images, these artifacts cannot be entirely eliminated. In the present study, segmentation in post-operative limbs was conducted by interpolating over air artifacts when present. This interpolation was performed to minimize the effects of any air artifacts. In future studies, saline could be injected into the joints post-operatively to attempt to eliminate air artifacts.
Although the data suggest that the medial tibial cartilage volume is affected by magnetic field strength, we did not determine which field strength provides the most accurate measurement. We assume that the 3T images are more accurate because more slices are used to reconstruct the 3-D models. The slice thickness was 1.5mm for the 3T magnet and 2.0mm for the 1.5T magnet. The slice thickness for each magnet was selected to keep the sequence acquisition time under 10 minutes, which is practical when imaging subjects. Therefore, less interpolation was required when the 3-D voxel models were created from the segmented 3T MR images. A comparison to a known standard would be required in order to evaluate the accuracy of segmented volumes based on MR imaging at different field strengths.
Finally, the effect of magnetic field strength on medial tibial cartilage volume was marked by a strong trend, but it was not statistically significant (p=0.08). This study was 80% powered to detect a 10% difference in cartilage volume based on our sample size. The mean difference in medial tibial cartilage volume was less than 6% between magnetic field strengths.
The results of the present study suggest that caution should be used when interpreting thickness and volume of the medial tibial cartilage at 3T in the presence of interference screws. Additionally, 3T and 1.5T qMRI should not be used interchangeably to assess structural changes in articular cartilage during longitudinal studies.
Acknowledgments
The authors gratefully acknowledge the support of Dr. Charles B. Eaton (NIH Osteoarthritis Initiative) for providing us access to the 3T MR system at Memorial Hospital (Pawtucket, RI), and the technical expertise of Dan Arcuri, Lynn Fanella and Theodore Trafton. The statistical analyses were performed by Gary Badger from the Department of Medical Biostatistics at the University of Vermont.
The project was supported by grants from the National Institutes of Health (AR047910, AR047910S1), the Department of Diagnostic Imaging at Rhode Island Hospital, and the RIH Orthopaedic Foundation, Inc. The interference screws were donated by Arthrex, Inc (Naples FL).
Footnotes
Conflict of Interest None of the authors have any personal or financial relationships that could bias this work. However, the interference screws that were used for this study were donated by Arthrex, Inc.
Publisher's Disclaimer: This is a PDF file of an unedited manuscript that has been accepted for publication. As a service to our customers we are providing this early version of the manuscript. The manuscript will undergo copyediting, typesetting, and review of the resulting proof before it is published in its final citable form. Please note that during the production process errors may be discovered which could affect the content, and all legal disclaimers that apply to the journal pertain.
References
- 1.Daniel DM, Stone ML, Dobson BE, Fithian DC, Rossman DJ, Kaufman KR. Fate of the ACL-injured patient: A prospective outcome study. Am J Sports Med. 1994;22:632–44. doi: 10.1177/036354659402200511. [DOI] [PubMed] [Google Scholar]
- 2.Fink C, Hoser C, Benedetto KP. Development of arthrosis after rupture of the anterior cruciate ligament. A comparison of surgical and conservative therapy. Unfallchirurg. 1994;97:357–61. [PubMed] [Google Scholar]
- 3.Howe JG, Johnson RJ, Kaplan MJ, Fleming BC, Jarvinen M. Anterior cruciate ligament reconstruction using quadriceps patellar tendon graft. Part I. Long-term followup. Am J Sports Med. 1991;19:447–62. doi: 10.1177/036354659101900505. [DOI] [PubMed] [Google Scholar]
- 4.Johma NM, Borton DC, Clingeleffer AJ, Pinczewski LA. Long term osteoarthritic changes in anterior cruciate ligament reconstructed knees. Clin Orthop. 1999;358:188–93. [PubMed] [Google Scholar]
- 5.Lohmander LS, Roos H. Knee ligament injury, surgery and osteoarthrosis. Truth or consequences? Acta Orthop Scand. 1994;65:605–9. doi: 10.3109/17453679408994613. [DOI] [PubMed] [Google Scholar]
- 6.Kannus P, Jarvinen M, Paakkala T. A radiological scoring scale for evaluation of post-traumatic osteoarthritis after knee ligament injuries. Int Orthop. 1988;12:291–7. doi: 10.1007/BF00317827. [DOI] [PubMed] [Google Scholar]
- 7.Kellgren JK, Lawrence JS. Radiological assessment of osteoarthritis. Ann Rheum Dis. 1957;15:494–501. doi: 10.1136/ard.16.4.494. [DOI] [PMC free article] [PubMed] [Google Scholar]
- 8.Eckstein F, Glaser C. Measuring cartilage morphology with quantitative magnetic resonance imaging. Sem Musculoskeletal Radiol. 2004;8:329–53. doi: 10.1055/s-2004-861579. [DOI] [PubMed] [Google Scholar]
- 9.Eckstein F. Noninvasive study of human cartilage structure by MRI. Methods Molec Med. 2004;101:191–218. doi: 10.1385/1-59259-821-8:191. [DOI] [PubMed] [Google Scholar]
- 10.Burstein D, Gray M. New MRI techniques for imaging cartilage. J Bone Joint Surg Am. 2003;85:70–7. doi: 10.2106/00004623-200300002-00009. [DOI] [PubMed] [Google Scholar]
- 11.Gray ML, Eckstein F, Peterfy C, Dahlberg L, Kim YJ, Sorensen AG, et al. Toward imaging biomarkers for osteoarthritis. Clin Orthop. 2004;427:S175–S81. doi: 10.1097/01.blo.0000144972.50849.d9. [DOI] [PubMed] [Google Scholar]
- 12.Koo S, Gold GE, Andriacchi TP. Considerations in measuring cartilage thickness using MRI: factors influencing reproducibility and accuracy. Osteoarthritis Cartilage. 2005;13:782–9. doi: 10.1016/j.joca.2005.04.013. [DOI] [PubMed] [Google Scholar]
- 13.Eckstein F, Charles HC, Buck RJ, Kraus VB, Remmers AE, Hudelmaier M, et al. Accuracy and precision of quantitative assessment of cartilage morphometry by magnetic resonance imaging at 3.0 T. Arthritis Rheum. 2005;52:3132–6. doi: 10.1002/art.21348. [DOI] [PubMed] [Google Scholar]
- 14.Eckstein F, Heudorfer L, Faber SC, Burgkart R, Englmeier KH, Reiser M. Long-term and resegmentation precision of quantitative cartilage MR imaging (qMRI) Osteoarthritis Cartilage. 2002;10:922–8. doi: 10.1053/joca.2002.0844. [DOI] [PubMed] [Google Scholar]
- 15.Glaser C, Burgkart R, Kutschera A, Englmeier KH, Reiser M, Eckstein F. Femoro-tibial cartilage metrics from coronal MR image data: Technique, test-retest reproducibility, and findings in osteoarthritis. Magn Reson Med. 2003;50:1229–36. doi: 10.1002/mrm.10648. [DOI] [PubMed] [Google Scholar]
- 16.Cicuttini FM, Forbes A, Yuanyuan W, Rush G, Stuckey SL. Rate of knee cartilage loss after partial meniscectomy. J Rheumatol. 2002;29:195–1956. [PubMed] [Google Scholar]
- 17.Cicuttini FM, Wluka AE, Wang Y, Stuckey SL. Longitudinal study of changes in tibial and femoral cartilage in knee osteoarthritis. Arthritis Rheum. 2004;50:94–7. doi: 10.1002/art.11483. [DOI] [PubMed] [Google Scholar]
- 18.Wluka AE, Stuckey S, Snaddon J, Cicuttini FM. The determinants of change in tibial cartilage volume in osteoarthritic knees. Arthritis Rheum. 2002;46:2065–72. doi: 10.1002/art.10460. [DOI] [PubMed] [Google Scholar]
- 19.Suh JS, Jeong EK, Shin KH, Cho JH, Na JB, Kim DH, et al. Minimizing artifacts caused by metallic implants at MR imaging: experimental and clinical studies. Am J Roentgen. 1998;171:1207–13. doi: 10.2214/ajr.171.5.9798849. [DOI] [PubMed] [Google Scholar]
- 20.Czervionke LF, Daniels DL, Wehrli FW, Mark LP, Hendrix LE, Strandt JA, et al. Magnetic susceptibility artifacts in gradient-recalled echo MR imaging. Am J Neuroradiol. 1988;9:1149–55. [PMC free article] [PubMed] [Google Scholar]
- 21.Farhani K, Dinha U, Sinha S, Chiu LC-L, Lufkin RB. Effect of field strength on susceptibility artifacts in magnetic resonance imaging. Comput Med Imaging Graph. 1990;14:409–13. doi: 10.1016/0895-6111(90)90040-i. [DOI] [PubMed] [Google Scholar]
- 22.Petersilge CA, Lewin JS, Duerk JL, Yoo JU, Ghaneyem AJ. Optimizing imaging parameters for MR evaluation of the spine with titanium pedicle screws. Am J Roentgenol. 1996;166:1213–8. doi: 10.2214/ajr.166.5.8615272. [DOI] [PubMed] [Google Scholar]
- 23.Tartaglino LM, Flanders AE, Vinitski S, Friedman DP. Metallic artifacts on MR images of the postoperative spine: reduction with fast spin-echo techniques. Radiol. 1994;190:565–9. doi: 10.1148/radiology.190.2.8284417. [DOI] [PubMed] [Google Scholar]
- 24.Kornaat PR, Reeder SB, Koo S, Brittain JH, Yu H, Andriacchi TP, et al. MR imaging of articular cartilage at 1.5T and 3.0T: Comparison of SPGR and SSFP sequences. Osteoarthritis Cartilage. 2005;13:338–44. doi: 10.1016/j.joca.2004.12.008. [DOI] [PubMed] [Google Scholar]
- 25.DeVita P, Hortobagyi T, Barrier J. Gait biomechanics are not normal after anterior cruciate ligament reconstruction and accelerated rehabilitation. Med Sci Sports Exerc. 1998;30:1481–8. doi: 10.1097/00005768-199810000-00003. [DOI] [PubMed] [Google Scholar]
- 26.Johnson RJ, Eriksson E, Haggmark T, Pope MH. Five- to ten-year follow-up evaluation after reconstruction of the anterior cruciate ligament. Clin Orthop. 1984;183:122–40. [PubMed] [Google Scholar]
- 27.Von Porat A, Roos EM, Roos H. High prevalence of osteoarthritis 14 years after an anterior cruciate ligament tear in male soccer players: a study of radiographic and patient relevant outcomes. Ann Rheum Dis. 2004;63:269–73. doi: 10.1136/ard.2003.008136. [DOI] [PMC free article] [PubMed] [Google Scholar]
- 28.Fithian DC, Paxton EW, Stone ML, Luetzow WF, Csintalan RP, Phelan D, et al. Prospective trial of a treatment algorithm for the management of the anterior cruciate ligament–injured knee. Am J Sports Med. 2005;33:335–46. doi: 10.1177/0363546504269590. [DOI] [PubMed] [Google Scholar]
- 29.Andriacchi TP, Mundermann A, Smith RL, Alexander EJ, Dyrby CO, Koo S. A framework for the in vivo pathomechanics of osteoarthritis at the knee. Ann Biomed Engin. 2004;33:447–57. doi: 10.1023/b:abme.0000017541.82498.37. [DOI] [PubMed] [Google Scholar]
- 30.Fleming BC, Hulstyn MJ, Oksendahl HL, Fadale PD. Ligament injury, reconstruction, and osteoarthritis. Curr Opin Orthop. 2005;16:354–62. doi: 10.1097/01.bco.0000176423.07865.d2. [DOI] [PMC free article] [PubMed] [Google Scholar]
- 31.Bauer J, Krause S, Ross C, Krug R, Carballido-Gamio J, Ozhinsky E, et al. Volumetric Cartilage Measurements of Porcine Knee at 1.5-T and 3.0-T MR Imaging: Evaluation of Precision and Accuracy. Radiol. 2006;241:399–406. doi: 10.1148/radiol.2412051330. [DOI] [PubMed] [Google Scholar]
- 32.Stammberger T, Eckstein F, Englmeier KH, Reiser M. Determination of 3D cartilage thickness data from MR imaging: computational method and reproducibility in the living. Magn Res Med. 1999;41:529–36. doi: 10.1002/(sici)1522-2594(199903)41:3<529::aid-mrm15>3.0.co;2-z. [DOI] [PubMed] [Google Scholar]
- 33.Gougoutas AJ, Wheaton AJ, Borthakur A, Shapiro EM, Kneeland JB, Udupa JK, et al. Cartilage volume quantification via Live Wire segmentation. Acad Radiol. 2004;11:1389–95. doi: 10.1016/j.acra.2004.09.003. [DOI] [PubMed] [Google Scholar]