

Abstract
In RNA site-directed spin labeling (SDSL) studies, structural and dynamic information at the individual RNA nucleotide level is derived from the observed electron paramagnetic resonance spectrum of a covalently attached nitroxide. A systematic approach for RNA SDSL is to establish a library that categorizes observed spectral lineshapes based on known RNA structures, thus enabling lineshape-based structure identification at any RNA site. To establish the first RNA SDSL library, selective secondary structure elements have been systematically engineered into a model RNA. Nitroxide lineshapes reporting features specific to each element were obtained utilizing a new avidin-tethering scheme for suppressing spectral effects due to uniform RNA tumbling. The data demonstrated two key features required for a SDSL library with a predicting power: (i) spectral divergence—distinctive lineshape for different elements; and (ii) spectral convergence—similar lineshape for the same element in different contexts. This sets the foundation for further RNA SDSL library development.
Keywords: RNA, Site-directed spin labeling, Secondary structure, Lineshape, Library
RNA is a versatile molecule both in terms of structure and function. Recent advances in high-resolution structure determination of large RNAs [1–3] and RNPs, particularly the ribosome [4–6], have drastically expanded the scope of the available RNA structural information. However, understanding the structure/function relationship in RNA requires information that goes beyond the static structure and tools that provide time-dependent structural information under physiological conditions are needed. Recently, the technique of site-directed spin labeling (SDSL) has been utilized to study RNAs with complex three-dimensional structures (see review [7]). SDSL utilizes a site-specifically attached nitroxide moiety that contains a stable, unpaired electron, and obtains local structural information by analyzing the electron paramagnetic resonance (EPR) spectrum of the nitroxide [8]. It is capable of providing information on high molecular weight assemblies under physiological conditions using a small amount of sample (∼5 μl of 50 μM of sample per measurement), and has been utilized to monitor solution structure and conformational changes at specific sites of RNA molecules [9–16] and to measure distances between two labeled sites within RNAs [17–20].
An important source of information in RNA SDSL is the spectral lineshape of a singly labeled nitroxide [7]. In the conventional X-band measurements, the observed lineshape changes dramatically as the overall motion of a nitroxide, characterized by its rotational correlation time τ, varies in the 0.1−50 ns regime [8]. Three modes of motions affect τ and consequently influence the observed EPR spectra: (i) the tumbling of the entire molecule (τR); (ii) torsional oscillations about bonds that connect the nitroxide moiety to the macromolecule (τi); and (iii) local macromolecule structural fluctuations at the labeling site (τB). Although changes of τR can be used to probe RNA/RNA interactions in solution [11], τR itself does not contain site-specific information. τi and τB are both affected by the local environment and serve as the major source of information in SDSL studies [7].
Many examples have shown that the observed nitroxide spectra can yield solution structural and dynamic information at the level of individual RNA nucleotide [7,9,10,13,16]. However, currently there is no systematic method for deducing RNA structural information from a given nitroxide spectrum. A promising systematic approach for correlating lineshape to structure in RNA SDSL is to survey nitroxide spectral lineshapes at sites with known structures. Analyzing the observed lineshapes will establish a SDSL library that reveals: (i) spectral convergence—same or similar spectra for the same structural element in different contexts; and (ii) spectral divergence—distinctive spectra for different elements. A library with these two features will allow one to identify the structure of a new site by comparing measured lineshapes to library entries, thus enabling lineshape-based structure identification at a given RNA site. Furthermore, quantitative investigations (such as spectral simulation) of each class of library entry will reveal how particular RNA structural features dictate nitroxide motion, thus providing a quantitative foundation for extracting RNA structural and dynamic information from observed nitroxide spectra.
Here we present work towards generating the first RNA SDSL library for a nitroxide that has been previously utilized to study RNA solution conformational changes [13,15]. A dodecamer RNA duplex with a known structure [21], designated SDR, is utilized as a model system. A nitroxide was attached at a specific uridine base position within SDR, and the RNA secondary structures at the labeling site were systematically varied. Aqueous EPR spectra reporting features specific to each element were obtained utilizing a new scheme, where the 7.6 kDa SDR duplex was tethered to an avidin molecule (∼60 kDa) to minimize spectral effects due to uniform molecular tumbling. The data showed clear spectral divergence in SDR, where different lineshapes were obtained for different secondary structures, including single-strand, stacked A/U pair, and U/U mismatch. Furthermore, the data also revealed an example of spectral convergence, where the stacked A/U pair spectrum in the SDR system shows very similar feature to that observed in a different RNA molecule. These studies thus establish the feasibility of establishing an RNA SDSL library with a predicting power.
Materials and methods
RNA synthesis
The model RNA, designated SDR, was shown in Fig. 1A. Sequences of RNAs utilized in this study are listed in Table 1. All RNAs were chemically synthesized by Dharmacon, Inc. (Lafayette, CO). The RNAs were purified either by 20% denaturing polyacrylamide gel, or by anion exchange HPLC as previously described [11]. The concentrations of RNA were determined by measuring the absorbance at 260 nm, using extinction coefficients of 121,800 M−1 cm−1 and 148,800 M−1 cm−1 for SDR1 and SDR2, respectively.
Fig. 1.
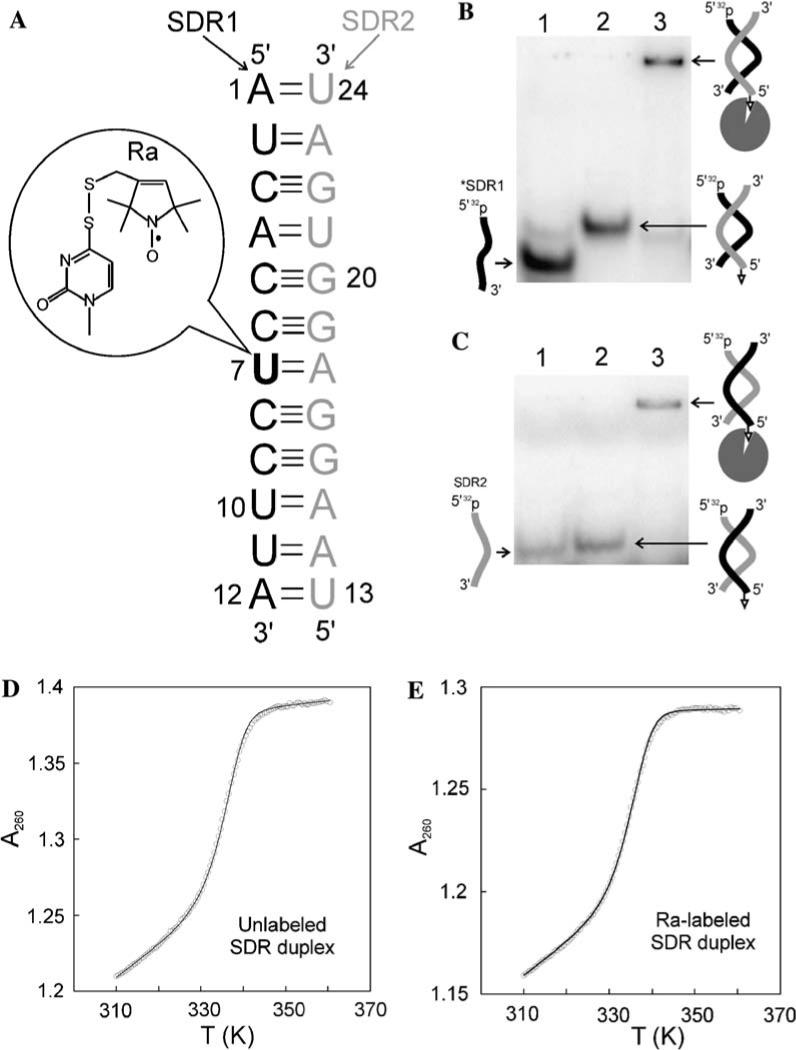
The SDR model RNA. (A) Sequence and numbering scheme for the SDR duplex. The SDR1 strand contains nucleotides 1 to 12, while the SDR2 strand contains nucleotides 13 to 24. Position 7 within the SDR1 strand (bolded) was spin labeled at the base position, using a scheme described previously (inset, [13]). Following a previously reported procedure [13,25], τR for the 7578 Da SDR duplex was calculated to be 4.3 ns in aqueous solution at 25 °C. (B) Tethering of the SDR duplex to avidin as detected by native gel, with radio-labeled SDR1 (*SDR1) as the probe. The biotin was covalently linked to SDR2. Lane 1: *SDR1 only; lane 2: *SDR1 + bSDR2 (1 μM); lane 3: *SDR1 + bSDR2 (1 μM) + avidin (3 μM). (C) Tethering of the SDR duplex to avidin as detected using radio-labeled SDR2 (*SDR2) as the probe. Lane 1: *SDR2 only; lane 2: *SDR2 + bSDR1 (1 μM); lane 3: *SDR2 + bSDR1 (1 μM) + avidin (3 μM). (D) Thermal denaturation of the unlabeled SDR duplex. The experimental data (open circles) shown were obtained with a total strand concentration of 5.13 μM. The solid curve represented data fitting according to Eqs. (1)–(3). The fitting parameters were mds = 2.14 × 10⁻³ bds = 0.546, mss = 3.24 × 10⁻⁴, bss = 1.27, ΔH0 = 129.9 kcal/mol, and ΔS = 0.361 kcal/mol/K, respectively. The resulting was 18.0 kcal/mol. (E) Thermal denaturation of the Ra-labeled SDR duplex. The experimental data (open circles) shown were obtained with a total strand concentration of 4.76 μM. The solid curve represented data fitting according to Eqs. (1)–(3). The fitting parameters were mss = 1.59 × 10⁻³, bds = 0.667, mss = 5.12 × 10⁻⁵, bss = 1.27, ΔH0 = 128.7 kcal/mol, and ΔS0 = 0.358 kcal/mol/K, respectively. The resulting was 17.7 kcal/mol.
Table 1.
Nomenclatures of RNAs used in this work
| Name | Sequence |
|---|---|
| SDR1a | 5′ A1 UC, ACC, UCC, UUA12 |
| bSDR1b | 5′ biotin-AUC, ACC, UCC, UUA |
| bSDR1su7c | 5′ biotin-AUC, ACC, sU7CC, UUA |
| SDR2a | 5′ U13AA, GGA, GGU, GAU24 |
| bSDR2b | 5′ biotin-UAA, GGA, GGU, GAU |
| SDR2-u18d | 5′ UAA, GGu, GGU, GAU |
See Fig. 1A for the numbering scheme.
Biotin attached to the 5′ phosphate via a (CH2)6 linker during chemical synthesis.
sU = 4-thio-uridine.
An adenine to uridine mutation (lower case letter) introduced at the 18th position.
Native gel binding assay
Radio-labeling at the 5′ terminus of RNA strands was carried out as described [22]. To form RNA duplexes, appropriate amount of each RNA strands was mixed in buffer A (300 mM NaCl and 10 mM sodium phosphate, pH 6.8), heated at 90 °C for 1 min, and cooled to 20 °C at a rate of 6 °C/min. If required, appropriate amount of avidin (NeutrAvidin™, Pierce Biotechnology, Inc.) was added, and the mixture was incubated for 1 h at room temperature. The RNA samples were loaded on a 15% native polyacrylamide gel that was prepared in a TBM buffer containing 89 mM Tris, pH 7.8, 0.2 M boric acid, and 5 mM MgCl2. The native gel was run in the TBM buffer at room temperature. RNA species were visualized by autoradiography.
RNA spin labeling
The thiol-reactive nitroxide derivative, 1-oxyl-3-methanesulfonylthiomethyl-2,5-dihydro-2,2,5,5-tetramethyl-1H-pyrrole (Toronto Research Chemicals, Inc., Ont., Canada), was attached to the SDR1su7 RNA that contains a 4-thio-U modified base following a published procedure [13]. The nitroxide side chain was designated Ra, and the labeled RNA was designated SDR1su7-Ra (Fig. 1A). Briefly, up to 0.1 mM of a 4-thio-U-substituted RNA was mixed with 1 mM Ra in a solution containing 100 mM sodium phosphate, pH 6.8. The reaction proceeded in dark overnight at room temperature under constant shaking. The labeled RNA was purified using anion exchange HPLC as described [11]. Alternatively, excess free spin labels were removed by size-exclusion chromatography using a PD-10 column (Amersham Biosciences). The reaction mixture was loaded on a PD-10 column equilibrated in water. Elution fractions (500 μl each) were collected, and those containing RNAs were identified by absorbance at 260 nm. The eluted RNA fractions were combined and lyophilized. The labeled RNAs were subjected to an additional round of ethanol precipitation to remove the remaining free spin labels.
EPR sample preparation
For EPR measurement of avidin-tethered RNA, bSDR1su7-Ra was mixed with avidin (avidin/RNA ∼ 1.1:1) in ∼1 ml of buffer B (100 mM NaCl, 10 mM sodium phosphate, pH 6.8). If required, the complementary strand (either wild type or mutant SDR2, in molar ratio of 1.1:1) was heated to 90 °C for 1 min, cooled at room temperature for 2 min, and added to the solution of avidin/bSDR1su7-Ra. The mixture was incubated at 4 °C for 30 min. Finally, the mixture was passed through a MW 30 kDa filter (Millipore) to remove low molecular weight species such as free nitroxides and unbound RNAs.
For EPR measurements in the absence of avidin, bSDR1su7-Ra was diluted into buffer B without avidin. If required, the SDR2 RNA was heated to 90 °C for 1 min, cooled at room temperature for 2 min, and then added to the SDR1su7-Ra (SDR1su7-Ra/SDR2 ∼ 1: 1.1). The mixture was incubated at room temperature for 1 h, followed by ethanol precipitation to remove the free spin label. The labeled duplexes were then placed in the appropriate buffer (+/− sucrose, see Fig. 2) for EPR spectrum measurement.
Fig. 2.
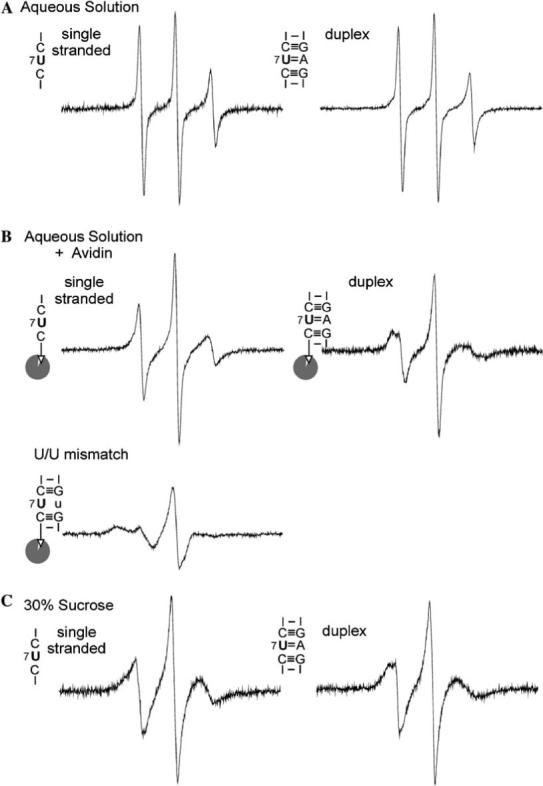
EPR spectra for various secondary structure elements at position 7 of the SDR RNA, obtained according to procedures described in Materials and methods. The corresponding secondary structure elements, as defined by nearest neighbor sequences around the labeling site, were indicated next to each spectrum. (A) Spectra obtained in an aqueous solution containing 100 mM NaCl and 10 mM sodium phosphate, pH 6.8. The SDR1su7-Ra concentration was 43 μM. (B) Spectra obtained with avidin-bound bSDR1su7-Ra in an aqueous solution containing 100 mM NaCl and 10 mM sodium phosphate, pH 6.8. The labeled RNA concentrations were estimated to be ∼50 μM, with an avidin/RNA ratio of 1.1:1. The avidin contains four biotin binding sites [34]. Control experiments showed that lowering the avidin/RNA ratio to 0.28:1 did not affect the observed EPR spectrum, thus excluding interference from possible spin–spin interaction due to two labeled RNAs binding to the same avidin molecule. Formations of RNA duplexes in the A/U pair and U/U mismatch were confirmed by native gel shift assays. (C) Spectra obtained in 100 mM NaCl, 10 mM sodium phosphate (pH 6.8), and 30% (w/v) sucrose. The presence of 30% sucrose increases the estimated τR of the SDR duplex to 13 ns, thus minimizing spectral effects due to uniform molecular tumbling. Signal from a small amount of free nitroxide was subtracted as described [13].
EPR measurements
X-band EPR spectra were obtained at room temperature on a Bruker EMX spectrometer equipped with a HS resonator (Bruker Biospin). Samples of 5 μl were loaded into 0.84 mm OD capillaries (VitroCom Inc., Mountain Lakes, NJ) that were sealed on one end. All spectra were acquired at X-band using a 2 mW incident microwave power and a 100 Gauss scan width. The 100 kHz field modulation amplitude and time constant of the detector were optimized to provide maximum signal-to-noise ratio with no line broadening. For comparison, the spectra were normalized with respect to the total number of spins [11,13]. Simulations of nitroxide spectra were carried out as reported [13], using the MOMD program developed by Freed and co-workers [23].
Thermodynamic analyses of SDR duplexes
Thermal denaturation of RNA was carried out using a DU800 UV–vis spectrometer (Beckman Coulter, Fullerton, CA) as previously reported [13]. RNA duplexes (0.2−7.5 μM in 380 μl) were dissolved in buffer B. Temperature was increased from 20 °C to 90 °C at a rate of 0.5 °C/min. Absorbance at 260 nm was recorded at every 0.5 °C.
Thermodynamic data for the duplex to single-strand transition were obtained using the two-state model [24]. Melting curves were fit to the following equation:
| (1) |
The constants mds, bds, mss, and bss specify the lower and upper baselines and were determined by linear fit to the corresponding base line regions of the observed melting curve. α is the fraction of duplex RNA and is related to K, the equilibrium constant of duplex to single-strand transition, according to:
| (2) |
and
| (3) |
where Ct represents the total RNA strand concentrations and was determined using A260 values at 85 °C. Fitting the observed melting curves to Eqs. (1)–(3) gave ΔH0 and ΔS0. The ΔH0 and ΔS0 values obtained from different Ct (differ by 5−10-fold) were averaged to give the reported mean values and errors for ΔH0 and ΔS0, from which values of were determined.
Results
The model SDR RNA for establishing an RNA SDSL library
The model system for establishing a SDSL lineshape library was chosen to be a dodecamer RNA duplex designated as SDR (following its pdb code 1SDR, Fig. 1A) [21]. The SDR RNA adopts an A-type helix with standard Watson–Crick base pairs throughout [21]. It contains non-self-complementary sequences, thus avoiding potential interference from spin–spin interactions due to simultaneous presence of two nitroxides. Each strand of the SDR RNA is easily produced using solid phase chemical synthesis, thus facilitating RNA sequence manipulation. In addition, the 2.6Å resolution crystal structure of SDR [21] is advantageous for correlating observed nitroxide spectra to RNA structural features.
In aqueous solution, uniform tumbling of the SDR duplex (τR ∼ 4.3 ns, Fig. 1 caption) results in significant average of the anisotropic nuclear–electron interactions at X-band, thus obscuring site-specific features in the EPR spectrum. In order to minimize the τR effect without perturbing the labeling site, our studies explore a new scheme in which the RNA was tethered to an avidin (∼60 kDa) via a biotin moiety incorporated at the 5′ terminus of one of the SDR strands. The overall SDR/avidin complex has an estimated τR > 31 ns in aqueous solution at 25 °C [13,25], slow enough so that uniform molecular tumbling will no longer dominate the EPR spectra (vide infra).
Avidin-tethering was first tested using a native gel assay (Figs. 1B and C). As shown in Fig. 1B, addition of a biotinated SDR2 (bSDR2) to a radio-labeled SDR1 (*SDR1) led to a single band with retarded mobility as compared to that of *SDR1, indicating the formation of the SDR duplex. Adding avidin to the *SDR1/bSDR2 mixture super-shifted the RNA band, consistent with the formation of the high molecular weight avidin/RNA complex. The mobility change is absent if bSDR2 was omitted in the reaction, suggesting both RNA duplex formation and biotin/avidin interaction are required for the avidin/RNA complex formation. Similar avidin-dependent mobility retardation for the SDR duplex was observed when the biotin was attached to the 5′ terminus of SDR1 (Fig. 1C), indicating avidin-tethering was independent of biotin position. We also noted that the single-stranded SDR2 migrated with similar mobility as that of the SDR duplex (Fig. 1C), indicating self-interaction within SDR2 even though no hairpin or self-dimer structures can be predicted. Based on this result, the SDR1 strand was chosen as the one for spin labeling.
Detecting site-specific EPR spectral features utilizing the avidin-tethering scheme
To initiate the SDSL library study, the nitroxide derivative Ra (Fig. 1A inset), which has been shown to be capable of reporting the structural state of an RNA base [13], was chosen as the probe. Ra was attached at a uridine base position located at the middle of the SDR1 sequence following a previously reported procedure [13], and the labeled RNA was designated as bSDRsu7-Ra (Fig. 1A). Thermal melting studies yielded an average = 18.3 ±0.3 kcal/mol for the unlabeled SDR duplex and = 17.8 ± 0.1 kcal/mol for the Ra-zlabeled duplex (Figs. 1D and E). The small difference (0.5 kcal/mol) indicates that nitroxide does not significantly disrupt the SDR duplex.
To explore spectral divergence and convergence in the SDR model RNA, EPR spectra of bSDR1su7-Ra were obtained with various partners under different conditions (Fig. 2). In aqueous solution in the absence of avidin, the spectra for the single-strand (∼3.7 kDa) and the duplex (7.6 kDa) are both dominated by motion related to τR. Both spectra showed a nitroxide undergoing fast, isotropic tumbling, and there is little difference between them (Fig. 2A). To minimize the τR effect without perturbing the labeling site, a new avidin-tethering scheme was employed (vide supra). In the avidin-bound spectra, reduction in the overall tumbling of the avidin/SDR complex leads to spectral broadening for both the single-strand and the duplex (compare respective spectra in Figs. 2A and B). Most importantly, spectral differences between the single-strand and duplex were apparent in the avidin-bound spectra (Fig. 2B): the single-strand spectrum retained the characteristics of isotropic motions, consistent with a lack of restraints at the labeled RNA base; the duplex spectrum showed a broader centerline with a closely spaced double peak at the low field region, indicating restricted, anisotropic nitroxide motion that is consistent with the structural restrictions imposed within a duplex.
In previous RNA SDSL studies [10,13,15], uniform RNA tumbling was minimized via adding sucrose, which increases solvent viscosity and globally reduces molecular motion. For the single-stranded and the duplex SDR RNA, spectra obtained with avidin-tethered RNAs have similar characteristic lineshapes as those observed in the presence of 30% sucrose (w/v) (Figs. 2B and C). This again indicates that reduction of overall RNA tumbling was achieved using avidin-tethering. We noted that for each class of RNA structural elements, the lineshape of the avidin-tethered RNA is not identical to that observed in sucrose. This is expected given that the mechanisms for reducing τR are different in the two methods.
To examine whether the avidin-tethering scheme is sufficient to reveal spectral changes due to RNA secondary structure difference, we mutated the pairing partner of U7 from A to U, thus generating a U/U mismatch at the labeling site (Fig. 2B). Under the experimental setup, the native gel assay showed that the U/U mismatch mutation does not interfere with tethering the SDR duplex to avidin. The U/U spectrum is strikingly different from both the single-strand and the duplex A/U spectrum. The observed U/U spectrum showed a broad centerline with a large hyperfine splitting, indicating that the nitroxide is much less mobile than that attached to an A/U pair. As a U/U mismatch is thermodynamically less stable than an A/U pair [26], the observed nitroxide mobility reduction is likely due to additional nitroxide/RNA interactions induced by the U/U mismatch. Interestingly, a previous study in a different RNA has reported two U/U mismatches spectra with lower mobility than the A/U pair [13]. It will be interesting to investigate whether this is a general feature in RNA SDSL.
A similar lineshape for stacked A/U pairs in two RNA molecules
The observed spectra for the A/U pair in the SDR duplex, obtained either utilizing the avidin scheme or in the presence of sucrose, showed a closely spaced double peak at the low field region (Figs. 2 and 3). This spectrum is very similar to a Ra spectrum previously observed at a site within a 23-nucleotide RNA designated as “TLR” (Fig. 3) [13], which has a different overall sequence and adopts a different structure. In both cases, the labeling site under consideration can be categorized by the same secondary structure element—a canonical Watson–Crick A/U pair stacked between two RNA base pairs within the helix (Fig. 3). The spectral similarity between the two sites indicates that it is possible to maintain the same characteristic EPR lineshape for an RNA secondary structural element embedded within different sequence and structural context. This provides the first example of spectral convergence.
Fig. 3.
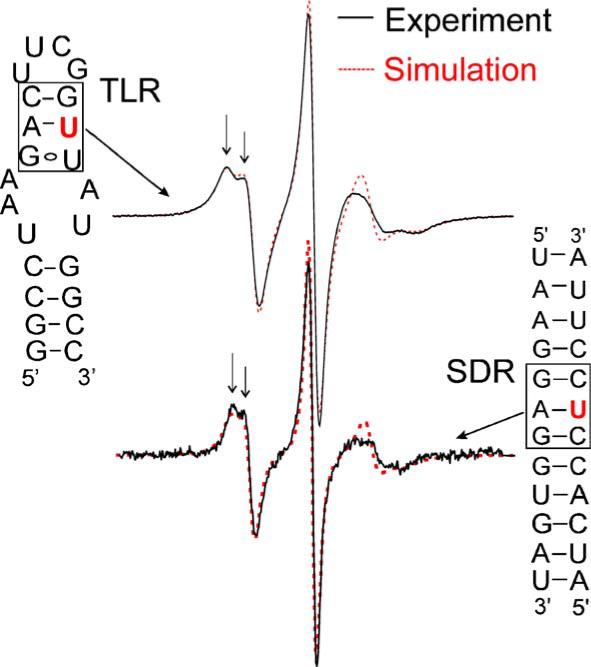
Spectra at stacked A/U pairs. Spectra (solid line) of Ra labeled at base positions of uridines situated in stacked Watson–Crick “A/U” pairs (indicated by boxes) in two different RNAs are shown. The two spectra are very similar, with splitting at the low field peak (indicated by arrows) indicating anisotropic motion of the nitroxide. Spectral simulations using the MOMD model are shown as dotted lines. The spectrum for the TLR site was obtained in 500 mM NaCl, 50 mM Mops, pH 6.6, and 33.8% (w/v) sucrose, and was simulated using rotational diffusion tensors Rx = 1.45 ns, Ry = 1.42 ns, Rz = 1.24 ns, and an order parameter of 0.46 [13]. The spectrum for the SDR site was obtained in buffer B using an avidin-tethered RNA as described (Materials and methods), and was simulated using Rx = 1.05 ns, Ry = 1.05 ns, Rz = 1.45 ns, and an order parameter of 0.36. The same set of g tensor, A tensor, and diffusion tilt angle (βD) values was used in the SDR and TLR simulations [13].
The characteristic lineshape of the stacked A/U pair has been observed in previous investigations of lipid bilayer [27] and protein [28], and has been shown to originate from a nitroxide undergoing restricted, anisotropic rotation [13,28]. In the TLR studies, the A/U site spectrum has been quantitatively simulated using a “MOMD” (Microscopic Ordered Macroscopic Disordered) model developed by Freed and co-workers [23], which uses an order parameter (S20) and an effective correlation time (τ) to describe diffusive motion of the nitroxide under the restraint of an ordering potential. Under the MOMD framework, a simulated spectrum that closely reproduces the experimental SDR1su7-Ra duplex spectrum was obtained (Fig. 3), suggesting that the nitroxide motion in the SDR duplex studied here can be sufficiently described by the same anisotropic motion model utilized in previous TLR studies [13].
While the two A/U spectra have the same characteristic lineshape (indicative of the same mode of motion), the respective rate and amplitude of motion of the nitroxide are not identical, as indicated by the differences in the line-widths and the τ and S20 values obtained from simulations (Fig. 3). Such differences in the details of the nitroxide motion could be due to variations in the experimental conditions. It might also reflect differences in the surrounding RNA environment—the labeling site is stacked with a G/C pair in SDR, while the corresponding stacking partner in TLR is a G/U pair. The degree of spectral variations within the same family of RNA secondary structure elements is an important subject for future investigations. We note that the SDR RNA contains an additional six Watson–Crick A/U base pairs that vary in their stacking partners and their locations within the RNA duplex. Future studies will investigate EPR spectra at these sites to probe the generality of the observed A/U spectrum and to reveal how different characteristics of base stacking and duplex dynamics might affect EPR spectral lineshapes.
Discussions
Towards the first SDSL lineshape library for RNA secondary structural elements
Data presented here demonstrated that the SDR RNA, combined with the avidin-tethering scheme, provides a suitable model system for obtaining EPR spectra that report specific structural features at the labeling site. The SDR RNA provides a facile system for systematically obtaining SDSL spectra correlated to different RNA secondary structures, thus allowing detailed analyses of lineshape/structure correlations in RNA SDSL.
Studies reported here demonstrated both spectral divergence and convergence, two key features that are indispensable to a SDSL library capable of lineshape-based structure identification. The results clearly demonstrated spectral divergence, where different RNA elements, such as single-stranded U, stacked A/U pair, and U/U mismatch, give different EPR lineshapes. This further strengthens the notion that SDSL is capable of detecting site-specific RNA structural features [9–16]. The data also revealed that the stacked A/U pair spectrum in the SDR shows the same characteristic feature to that observed in a different molecule. This is the first example of spectral convergence, where the same structural element (a stacked A/U pair) shows similar lineshape in different contexts. Together, these results demonstrated the feasibility of establishing a lineshape library for studying RNA.
To categorize the local environment surrounding the nitroxide, we define an RNA structural element at the labeling site by the sequences of the nearest neighbors (the cross-strand and stacking partners, Fig. 2). Such a sequence-based definition circumvents the need of gathering detailed three-dimensional structural information at the labeling site and serves as a sufficient starting point for establishing a coarse index of spectral convergence and divergence for the prototype lineshape library. An RNA element, such as the stacked A/U pair, may adopt similar three-dimensional structures when embedded in different molecules, thus posting similar lineshapes (spectral convergence). It is also likely that some RNA elements, such as the U/U mismatch, may adopt different three-dimensional structures in different contexts, thus posting different lineshapes (spectral divergence). One important goal in future studies is to reveal the degree of divergence and convergence for each RNA element.
We have chosen to establish the first RNA SDSL lineshape library with a nitroxide that is attached to a selective uridine base position via a disulfide bond (Fig. 1A). Previous studies have shown that the lineshape of this nitroxide is modulated by the RNA base mobility and the interactions between the nitroxide side chain and the local RNA environment [13]. Therefore, the observed nitroxide lineshape, and the resulting SDSL library, is directly correlated to the structural state of the labeled base. Methods for attaching nitroxides at RNA backbone [11] and sugar positions [10,19] have been reported, and the SDR system can be utilized for establishing SDSL lineshape libraries for these nitroxides.
In protein SDSL, an empirical lineshape database with >1000 entries has provided a general tool for deducing structural information from observed spectra. With this protein SDSL database, one can use observed lineshapes to determine whether the labeled residue is a loop site, a helical surface site, or a buried site [29]. Contrary to protein SDSL, the number of currently known RNA SDSL lineshapes is <50. Data presented here demonstrated a viable model system for drastically expanding the scope of available data in RNA SDSL and lay the groundwork for establishing the first lineshape/structure library with a predicting power. This will provide a powerful tool for extracting RNA structural information from observed SDSL spectra. Particularly, it will aid interpretations of different lineshapes observed in studies of RNA conformational changes, which often involve secondary structure changes [15].
Advantages of the avidin-tethering scheme
In order to obtain site-specific RNA information from the measured spectra, it is essential to minimize the spectral effect due to the uniform tumbling of the entire molecule (τR). The majority of RNAs studied in SDSL are smaller than 15 kDa (corresponding to a 50-nucleotide RNA) [7].
The τR values for these RNAs are less than 8.5 ns in aqueous solutions, and if unrestrained, the uniform tumbling will strongly influence the observed X-band spectra. In previous studies, τR is lengthened by adding reagents, such as sucrose, to increase the solvent viscosity and reduce molecular tumbling. However, the effects of sucrose on RNA structure and dynamics are not clear. It is possible that sucrose could have variable effects on local motions at the labeling site, which could artificially bias the SDSL measurements. It has been reported that high concentrations of sucrose affect protein dynamics in some cases, presumably due to dramatic changes in solvent osmolarity [30].
Studies reported here demonstrate a new approach for obtaining EPR spectra that report site-specific RNA features. By tethering the RNA to a high molecular weight avidin, the uniform molecular tumbling is selectively minimized, and site-specific spectral variations were obtained for a 7.6 kDa RNA in aqueous solution. Tethering was achieved utilizing a biotin moiety that is covalently linked to the 5′ phosphate group of the RNA via a (CH2)6 linker. The (CH2)6 linker allows the biotin to reach into the deep binding pocket in avidin [31] without generating excess relative motion between RNA and avidin. The biotin–avidin interaction, located at the RNA terminus that is distal to the labeling site, has no interactions with the local RNA environment being studied. This is advantageous compared to methods that increase solvent viscosity globally.
The biotin–avidin scheme can be generally applied to many RNA systems. In addition to selectively minimizing uniform molecular tumbling, it facilitates the removal of the unbound, low molecular weight species such as free nitroxides (see Materials and methods). This provides a facile and minimally interfering means to access site-specific variations of EPR spectrum in relatively low molecular RNA systems. Furthermore, the scheme demonstrated here will allow one to establish a two-dimensional array of spin labeled RNA molecules utilizing avidin molecules attached to surfaces. Studies of spin labeled proteins bound to a planar lipid bilayer have been recently reported [32,33], and an ordered array of spin labeled RNAs will be useful in future RNA SDSL developments.
In summary, work reported here represents the first step towards establishing a library that allows systematic investigations of lineshape/structure correlations in RNA, and further development of this library will yield a tool for probing RNA solution structure and conformational changes.
Acknowledgment
We thank Qi Cai and Gian Gacho for critical reading of the manuscript.
Footnotes
Research reported here was supported by the Petroleum Research Fund (PRF# 39623-G4), the USC Zumberge Research Fund, and a startup fund from the University of Southern California.
References
- 1.Cate JH, Gooding AR, Podell E, Zhou K, Golden BL, Kundrot CE, Cech TR, Doudna JA. Crystal structure of a group I ribozyme domain: principles of RNA packing. Science. 1996;273:1678–1685. doi: 10.1126/science.273.5282.1678. [DOI] [PubMed] [Google Scholar]
- 2.Golden BL, Gooding AR, Podell ER, Cech TR. A preorganized active site in the crystal structure of the Tetrahymena ribozyme. Science. 1998;282:259–264. doi: 10.1126/science.282.5387.259. [DOI] [PubMed] [Google Scholar]
- 3.Golden BL, Kim H, Chase E. Crystal structure of a phage Twort group I ribozyme-product complex. Nat. Struct. Mol. Biol. 2005;12:82–89. doi: 10.1038/nsmb868. [DOI] [PubMed] [Google Scholar]
- 4.Ban N, Nissen P, Hansen J, Moore PB, Steitz TA. The complete atomic structure of the large ribosomal subunit at 2.4 A resolution. Science. 2000;289:905–920. doi: 10.1126/science.289.5481.905. [DOI] [PubMed] [Google Scholar]
- 5.Wimberly BT, Brodersen DE, Clemons WMJ, Morgan-Warren RJ, Carter AP, Vonrhein C, Hartsch T, Ramakrishnan V. Structure of the 30S ribosomal subunit. Nature. 2000;407:327–339. doi: 10.1038/35030006. [DOI] [PubMed] [Google Scholar]
- 6.Yusupov MM, Yusupova GZ, Baucom A, Lieberman K, Earnest TN, Cate JH, Noller HF. Crystal structure of the ribosome at 5.5 A resolution. Science. 2001;292:883–896. doi: 10.1126/science.1060089. [DOI] [PubMed] [Google Scholar]
- 7.Qin PZ, Dieckmann T. Application of NMR and EPR methods to the study of RNA. Curr. Opin. Struct. Biol. 2004;14:350–359. doi: 10.1016/j.sbi.2004.04.002. [DOI] [PubMed] [Google Scholar]
- 8.Hubbell WL, Altenbach C. Investigation of structure and dynamics in membrane proteins using site-directed spin labeling. Curr. Opin. Struct. Biol. 1994;4:566–573. [Google Scholar]
- 9.Kao SC, Bobst AM. Local base dynamics and local structural features in RNA and DNA duplexes. Biochemistry. 1985;24:5465–5469. doi: 10.1021/bi00341a028. [DOI] [PubMed] [Google Scholar]
- 10.Edwards TE, Okonogi TM, Robinson BH, Sigurdsson ST. Site-specific incorporation of nitroxide spin-labels into internal sites of the TAR RNA. Structure-dependent dynamics of RNA by EPR spectroscopy. J. Am. Chem. Soc. 2001;123:1527–1528. doi: 10.1021/ja005649i. [DOI] [PubMed] [Google Scholar]
- 11.Qin PZ, Butcher SE, Feigon J, Hubbell WL. Quantitative analysis of the GAAA tetraloop/receptor interaction in solution: a site-directed spin labeling study. Biochemistry. 2001;40:6929–6936. doi: 10.1021/bi010294g. [DOI] [PubMed] [Google Scholar]
- 12.Edwards TE, Sigurdsson ST. Electron paramagnetic resonance dynamic signatures of TAR RNA-small molecule complexes provide insight into RNA structure and recognition. Biochemistry. 2002;41:14843–14847. doi: 10.1021/bi026299a. [DOI] [PubMed] [Google Scholar]
- 13.Qin PZ, Hideg K, Feigon J, Hubbell WL. Monitoring RNA base structure and dynamics using site-directed spin labeling. Biochemistry. 2003;42:6772–6783. doi: 10.1021/bi027222p. [DOI] [PubMed] [Google Scholar]
- 14.Edwards TE, Sigurdsson ST. EPR spectroscopic analysis of U7 hammerhead ribozyme dynamics during metal ion induced folding. Biochemistry. 2005;44:12870–12878. doi: 10.1021/bi050549g. [DOI] [PubMed] [Google Scholar]
- 15.Qin PZ, Feigon J, Hubbell WL. Site-directed spin labeling studies reveal solution conformational changes in a GAAA tetraloop receptor upon Mg2+-dependent docking of a GAAA tetraloop. J. Mol. Biol. 2005;351:1–8. doi: 10.1016/j.jmb.2005.06.007. [DOI] [PubMed] [Google Scholar]
- 16.Kim NK, Murali A, DeRose VJ. Separate metal requirements for loop interactions and catalysis in the extended hammerhead ribozyme. J. Am. Chem. Soc. 2005;127:14134–14135. doi: 10.1021/ja0541027. [DOI] [PMC free article] [PubMed] [Google Scholar]
- 17.Macosko JC, Pio MS, Tinoco I, Jr., Shin Y-K. A novel 5′ displacement spin-labeling technique for electron paramagnetic resonance spectroscopy of RNA. RNA. 1999;5:1158–1166. doi: 10.1017/s1355838299990830. [DOI] [PMC free article] [PubMed] [Google Scholar]
- 18.Schiemann O, Weber A, Edwards TE, Prisner TF, Sigurdsson ST. Nanometer distance measurements on RNA using PELDOR. J. Am. Chem. Soc. 2003;125:3334–3335. doi: 10.1021/ja0274610. [DOI] [PubMed] [Google Scholar]
- 19.Kim N, Murali A, DeRose VJ. A distance ruler for RNA using EPR and site-directed spin labeling. Chem. Biol. 2004;11:939–948. doi: 10.1016/j.chembiol.2004.04.013. [DOI] [PubMed] [Google Scholar]
- 20.Borbat PP, Davis JH, Butcher SE, Freed JH. Measurement of large distances in biomolecules using double-quantum filtered refocused electron spin-echoes. J. Am. Chem. Soc. 2004;126:7746–7747. doi: 10.1021/ja049372o. [DOI] [PubMed] [Google Scholar]
- 21.Schindelin H, Zhang M, Bald R, Furste J, Erdmann VA, Heinemann U. Crystal structure of an RNA dodecamer containing the Escherichia coli Shine–Dalgarno sequence. J. Mol. Biol. 1995;249:595–603. doi: 10.1006/jmbi.1995.0321. [DOI] [PubMed] [Google Scholar]
- 22.Fang Y, Cai Q, Qin PZ. The procapsid binding domain of ϕ/29 packaging RNA has a modular architecture and requires 2′-hydroxyl groups in packaging RNA interaction. Biochemistry. 2005;44:9348–9358. doi: 10.1021/bi0475020. [DOI] [PubMed] [Google Scholar]
- 23.Budil DE, Lee S, Saxena S, Freed JH. Nonlinear-least-squares analysis of slow-motion EPR spectra in one and two dimensions using a modified Levenberg–Marquardt algorithm. J. Mag. Res. Series A. 1996;120:155–189. [Google Scholar]
- 24.Longfellow CE, Kierzek R, Turner DH. Thermodynamic and spectroscopic study of bulge loops in oligoribonucleotides. Biochemistry. 1990;29:278–285. doi: 10.1021/bi00453a038. [DOI] [PubMed] [Google Scholar]
- 25.Cantor CR, Schimmel PR. In: Biophysical Chemistry. Freeman WH, editor. San Francisco: 1980. pp. 460–564. [Google Scholar]
- 26.Serra MJ, Turner DH. Predicting thermodynamic properties of RNA. Methods Enzymol. 1995;259:242–261. doi: 10.1016/0076-6879(95)59047-1. [DOI] [PubMed] [Google Scholar]
- 27.Hubbell WL, McConnell HM. Molecular motion in spin-labeled phospholipids and membranes. J. Am. Chem. Soc. 1971;93:314–326. doi: 10.1021/ja00731a005. [DOI] [PubMed] [Google Scholar]
- 28.Columbus L, Kalai T, Jeko J, Hideg K, Hubbell WL. Molecular motion of spin-labeled side chains in α-helices: analysis by variation of side chain structure. Biochemistry. 2001;40:3828–3846. doi: 10.1021/bi002645h. [DOI] [PubMed] [Google Scholar]
- 29.Mchaourab HS, Lietzow MA, Hideg K, Hubbell WL. Motion of spin-labeled side chains in T4 lysozyme. Correlation with protein structure and dynamics. Biochemistry. 1996;35:7692–7704. doi: 10.1021/bi960482k. [DOI] [PubMed] [Google Scholar]
- 30.Butler SL, Falke JJ. Effects of protein stabilizing agents on thermal backbone motions: a disulfide trapping study. Biochemistry. 1996;35:10595–10600. doi: 10.1021/bi961107v. [DOI] [PMC free article] [PubMed] [Google Scholar]
- 31.Esienberg-Domovich Y, Hytönen VP, Wilchek M, Bayer EA, Kulomaa MS, Livnah O. High-resolution crystal structure of an avidin-related protein: insight into high-affnity biotin binding and protein stability. Acta Crystallogr. D. 2005;61:528–538. doi: 10.1107/S0907444905003914. [DOI] [PubMed] [Google Scholar]
- 32.Risse T, Hubbell WL, Isas JM, Haigler HT. Structure and dynamics of annexin 12 bound to a planar lipid bilayer. Phys. Rev. Lett. 2003;91:188101. doi: 10.1103/PhysRevLett.91.188101. [DOI] [PubMed] [Google Scholar]
- 33.Jacobsen K, Oga S, Hubbell WL, Risse T. Determination of the orientation of T4 lysozyme vectorially bound to a planar-supported lipid bilayer using site-directed spin labeling. Biophys. J. 2005;88:4351–4365. doi: 10.1529/biophysj.105.059725. [DOI] [PMC free article] [PubMed] [Google Scholar]
- 34.Green NM. Avidin. In: Richards FM, editor. Advances in Protein Chemistry. Academic Press; New York: 1975. pp. 85–133. [DOI] [PubMed] [Google Scholar]