

Abstract
C. elegans affords a model of primary mitochondrial dysfunction that provides insight into cellular adaptations which accompany mutations in nuclear gene that encode mitochondrial proteins. To this end, we characterized genome-wide expression profiles of C. elegans strains with mutations in nuclear-encoded subunits of respiratory chain complexes. Our goal was to detect concordant changes among clusters of genes that comprise defined metabolic pathways. Results indicate that respiratory chain mutants significantly upregulate a variety of basic cellular metabolic pathways involved in carbohydrate, amino acid, and fatty acid metabolism, as well as cellular defense pathways such as the metabolism of P450 and glutathione. To further confirm and extend expression analysis findings, quantitation of whole worm free amino acid levels was performed in C. elegans mitochondrial mutants for subunits of complexes I, II, and III. Significant differences were seen for 13 of 16 amino acid levels in complex I mutants compared with controls, as well as overarching similarities among profiles of complex I, II, and III mutants compared with controls. The specific pattern of amino acid alterations observed provides novel evidence to suggest that an increase in glutamate-linked transamination reactions caused by the failure of NAD+ dependent oxidation of ketoacids occurs in primary mitochondrial respiratory chain mutants. Recognition of consistent alterations among patterns of nuclear gene expression for multiple biochemical pathways and in quantitative amino acid profiles in a translational genetic model of mitochondrial dysfunction allows insight into the complex pathogenesis underlying primary mitochondrial disease. Such knowledge may enable the development of a metabolomic profiling diagnostic tool applicable to human mitochondrial disease.
Keywords: mitochondrial disease, expression profiling, gene set enrichment analysis (GSEA), C. elegans, complex I, amino acid quantitation
INTRODUCTION
Primary mitochondrial respiratory chain disease manifests clinically with an extensive array of multi-system findings characterized by impaired energy metabolism [1]. As a group, mitochondrial diseases constitute the largest cohort of inborn errors of metabolism, affecting an estimated 1 in 5,000 individuals across a lifetime [2]. Unfortunately, diagnosis often remains elusive for these heterogeneous disorders which result from mutations in either nuclear or mitochondrial DNA. Diagnostic uncertainty is rooted in the absence of a single biomarker which can adequately support or refute the possibility of mitochondrial disease for all patients[1]. Thus, establishing the diagnosis of mitochondrial disease presents a considerable challenge for the clinical specialists to whom suspected patients are referred[3, 4].
Many challenges inherent in studying the pathogenesis of mitochondrial dysfunction in humans can be approached through exploitation of the extensive evolutionary conservation of mitochondrial proteins. C. elegans is a free-living, millimeter long, aerobic, self-fertilizing hermaphroditic nematode in which individual respiratory chain subunits share extensive homology to those comprising the human mitochondrial respiratory chain (eg, on the order of 40% to 99% protein identity among >82% of the nuclear encoded subunits of complex I alone)[5]. Adult C. elegans are comprised of 959 somatic cells primarily organized into muscle, nervous system, gastrointestinal system, reproductive system, and cuticle[6]. C. elegans’ 3-day developmental cycle, 2-week lifespan, and ~300 isogenic offspring permits the rapid, economical study of large quantities of genetically identical animals. The genome of the nematode is fully sequenced and the expressed worm proteome shares greater than 83% identifiable homology with human genes[7]. The role of many nuclear DNA-encoded mitochondrial proteins can be studied by analyzing single gene mutants. Indeed, several well-characterized mutants exist in genes encoding structural subunits of complexes I, II, and III of the mitochondrial respiratory chain[8–10]. Additional hypomorphic mutants in the remaining nuclear encoded subunits can be generated using RNA interference (RNAi) technology[11]. In this manner, the impact of specific gene mutations on mitochondrial function, other specific cellular functions, as well as whole animal behavior can be systematically analyzed [12]. Thus, C. elegans is a powerful translational model for human mitochondrial disease.
We hypothesized that primary mitochondrial disease alters expression of functional sets of nuclear genes, representing cellular adaptation to mitochondrial dysfunction. Recognition of these adaptive changes provides insight into underlying disease mechanisms and constitutes a signature metabolic profile with the potential to guide the molecular diagnosis of mitochondrial disease. Here, we present results of genome-wide metabolic pathway expression profiling of both classic and RNAi C. elegans mutants in various nuclear-encoded structural subunits of respiratory chain complexes I, II, and III. Alterations in expression of amino acid metabolism pathways were independently confirmed by whole animal free amino acid quantitative profiling in the classic mutants. Our results indicate that primary mitochondrial disease is associated with gene expression alterations interpretable at the level of multiple metabolic pathways. Specific pathways that were significantly upregulated in primary mitochondrial respiratory chain disease include those involved in oxidative phosphorylation, the tricarboxylic acid cycle, basic cell metabolism pathways of carbohydrate, amino acid, and fatty acid metabolism, and cellular defense pathways, including the metabolism of cytochrome P450 and glutathione. Furthermore, novel evidence is provided by means of quantitative free amino acid profiling to suggest that an increase in glutamate-linked transamination reactions occurs in primary mitochondrial respiratory chain mutants, consistent with their apparent failure to oxidize ketoacids.
MATERIAL AND METHODS
Nematode Strains
All C. elegans strains were obtained from the Caenorhabditis Genetics Center (Minneapolis, MN). Strains selected for expression profiling and/or amino acid quantitation analyses are described in Table 1. We studied three classical mutant alleles which act as recessive hypomorphic mutations affecting three different complexes of the mitochondrial respiratory chain. These were gas-1(fc21), a missense mutation in the 49 kDa subunit of complex I; mev-1(kn1), a missense mutation in the SDHC subunit of complex II; and isp-1(qm150), a missense mutation in the Rieske iron sulfur protein subunit of complex III. In addition, we studied 5 RNAi induced hypomorphic mutants in complex I, as detailed in Table 1.
Table 1.
C. elegans mutant strains studied by expression analysis and/or amino acid profiling
| Mitochondrial Respiratory Chain Complex Affected | H. Sapiens gene name | C. elegans sequence name | C. elegans allele name | Human-Worm Protein Homology | Mutation Type | Mean relative RNA knockdown* | % CI-dependent oxphos capacity* | % CII-dependent oxphos capacity* | Expression Array Dataset | Amino Acid Profiling |
|---|---|---|---|---|---|---|---|---|---|---|
| I | NDUFS1 | Y45G12B.1 | - | 97.8% | Feeding RNAi (5mM) | 55% | 75% | 136% | 2 | No |
| I | NDUFS2 | K09A9.5 | gas-1 (fc21) | 83.4% | missense | - | 29% | 164% | 1, 2 | Yes |
| I | NDUFS6 | F22D6.4 | - | 61.4% | Feeding RNAi (5mM) | 26% | 42% | 165% | 2 | No |
| I | NDUFAB-1 | Y56A3A.19 | - | 97.7% | Feeding RNAi (5mM) | 50% | 75% | 129% | 2 | No |
| I | NDUFB7 | D2030.4 | - | 99.2% | Feeding RNAi (5mM) | 70% | 75% | 136% | 2 | No |
| I | GRIM19 | C34B2.8 | - | 84.2% | Feeding RNAi (5mM) | 23% | 53% | 128% | 2 | No |
| II | SDHC | T07C4.7 | mev-1(kn1) | 75.3% | missense | - | 130% | 32% | 2 | Yes |
| III | UQCRFS1 | F42G8.12 | isp-1(qm150) | 97.5% | missense | - | 52% | 60% | 2 | Yes |
indicates comparison with N2 grown on OP50 E. coli for missense mutants and grown on HT115 E. coli for RNAi-generated mutants.
Nematode Culture Conditions
Liquid culture growth with sucrose gradient centrifugation to enrich for adult stage animals was used to obtain gram quantities of synchronous C. elegans adults from which sufficient mitochondria could be isolated for polarographic analysis of integrated respiratory function[12, 13]. Aliquots of these worms were concurrently allotted for either mitochondrial isolation for functional assessment, total RNA isolation for use in the validation microarray dataset, or amino acid analyses of large worm quantities (i.e., ~1 × 10⁶ worms), as detailed below. Specifically, validation microarray analysis which utilized classic mutant strains were grown in liquid culture with K12 E. coli in 20°C at 220 rpm (I26 Incubated Shaker Series, New Brunswick Scientific Co., Inc, Edison, NJ), as previously described[10, 12]. RNAi-generated complex I subunit mutants for validation microarray analysis were similarly handled except for exposure to gene-specific RNAi bacterial clones obtained from a publicly available library (MRC GeneService, Ltd, UK) and grown in the presence of 5 mM IPTG, per standard RNAi feeding protocol[12, 14, 15]. RNAi bacterial clones were sequence verified by standard techniques using universal primer TL118 (GAGTCAGTGAGCGAGGAAGC). Nematodes were grown for 3 generations on RNAi bacterial clones prior to harvest for study.
Worms for microarray analysis in the initial dataset (N2 and gas-(fc21) and for whole worm amino acid profiling (N2, gas-1(fc21), mev-1(kn1), isp-1(qm150)) were grown on nematode growth media (NGM) agar plates in an effort to precisely synchronize adult stage and minimize potential stress responses which might impact cellular defense expression pathways[10, 16]. Synchrony was obtained by bleaching gravid adults, plating the recovered eggs on unspread NGM plates overnight, and then transferring L1-stage arrested animals to NGM plates spread with standard OP50 E. coli. Animals were grown at 20°C until adulthood, as defined by the first day in which laid eggs were present. Each strain was then washed off plates with sterile water into 15 ml polypropylene tubes, washed twice at room temperature in 10 ml sterile water to remove bacteria, and sorted within one hour of washing based on time of flight and size gating using an automated sorter (COPAS Biosort, Union Biometrica, Somerville, MA courtesy of Todd Lamitina, PhD, University of Pennsylvania, Philadelphia, PA). Biological replicates of 500 to 1,000 living, adult worms were sorted in sterile water directly into 1.5 ml polypropylene tubes and handled immediately, as below, for either RNA isolation or amino acid analysis.
Total RNA Isolation
Standard precautions were followed to avoid contamination or degradation of RNA samples[17]. Trizol reagent (Invitrogen Corporation, Carlsbad, CA) was used to extract RNA from approximately 0.2–2.0 g of C. elegans whole worms grown in liquid culture, per kit directions. Total RNA from sorted aliquots of worms grown on plates from bleached eggs was obtained using a modified mini-Trizol protocol (courtesy of Todd Lamitina, PhD, University of Pennsylvania, Philadelphia, PA). Specifically, 500 to 1,000 adult worms were sorted in 1 ul water droplets per worm into 1.5 ml tubes and microfuged briefly. Supernatant was aspirated to leave 100 ul water, 400 ul Trizol reagent was added, and the tube was vortexed × 2 minutes at room temperature. Tubes were placed in a Pappacooler (Tritech research, Willoughby, OH) and frozen in −80°C. Tubes were freeze-thawed twice at 37°C × 10 minutes followed by −80°C × 10 minutes. Each sample was subsequently treated per standard protocol involving 200 ul of Trizol, 140 ul chloroform, and 70% ethanol precipitation (Invitrogen Corporation, Carlsbad, CA). Samples were purified in Qiagen RNeasy spin columns (Qiagen, Inc., Valencia, CA), per package directions.
The concentration and dissolution of RNA was determined spectrophotometrically at 230 nm, 260 nm, and 280 nm wavelengths (Biomate 3 spectrophotometer, Thermoelectron Corp, Madison, WI and/or Nanodrop ND-100 Spectrophotometer v3.1.2, NanoDrop Technologies, Inc., Wilmington, DE). Only RNA samples with both 260/230 and 260/280 ratios > 1.8 were used in further analyses. Each RNA sample analyzed by Biomate 3 spectrophotometer was run on a 1.2% agarose gel to check for purity and degradation. All RNA samples were analyzed by Agilent Bioanalyzer prior to utilization in Affymetrix microarray experiments (Affymetrix Core Facility, Ireland Cancer Center, University Hospitals of Cleveland, Cleveland, OH and Nucleic Acid and Protein Core Facility, The Children’s Hospital of Philadelphia, Philadelphia, PA).
Confirmation of RNAi-induced gene knockdown
cDNA was prepared from total RNA samples that were DNAse-treated (Roche Diagnostics, Indianapolis, IN), purified with RNeasy MinElute Cleanup Kit (Qiagen, Inc., Valencia, CA), eluted with RNase/DNase-free water, and reverse transcribed with SuperScript™ II RNase H-Reverse Transciptase, per kit directions (Invitrogen Corporation, Carlsbad, CA).
Amplicon and primer design for singleplex assays were performed per the Real-Time PCR Applications Guide (Bio-Rad Laboratories, Inc., Hercules, CA). Gene-specific primers were designed using www.wormbase.org and Primer3 software (Sigma Genosys, The Woodlands, TX), and optimized for annealing temperature. Real time qPCR reactions were performed using iQ™ SYBR Green Supermix (Bio-Rad Laboratories, Inc., Hercules, CA), Chromo4 Continuous Fluorescence Detector, and Opticon Monitor 3.1.32 Software (Bio-Rad Laboratories, Inc., Hercules, CA). The cDNA calibrator originated from wildtype (N2) C. elegans grown on HT115 (DE3) E. coli. cDNA test samples originated from C. elegans RNAi-induced single gene mutants corresponding to the specific RNAi bacterial strain used to generate each hypomorphic mutant (Table 1). The reference gene used was T04C12.4 (actin), selected based on its unchanging expression profile on C. elegans genome-wide expression array analysis in N2 and several mitochondrial mutant animals (unpublished results). qPCR data analysis was performed by relative quantification per the Livak method, where a 2−ΔΔCT value < 1 indicated a fold-decrease, > 1 indicated a fold-increase, and = 1 indicated no change in gene expression [18].
Microarray Preparation and Analysis
The GeneChip C. elegans genome array was utilized for expression microarray analysis. (Affymetrix, Inc, Santa Clara, CA). The initial microarray dataset was comprised of 10 arrays, consisting of RNA obtained from 5 biological replicates of the gas-1(fc21) mutant in the complex I NDUFS2 subunit homologue, and 5 biological replicates of N2 grown on OP50 E. coli as the wildtype C. elegans control. RNA was prepared from synchronous populations of 1,000 adults grown at 20°C on NGM plates and sorted, as above. Affymetrix probe-level data was normalized and summarized in dChip using PM-only model to obtain a single log2-transformed intensity value per probe set per array (http://biosun1.harvard.edu/complab/dchip). Statistical analysis was performed in R version 2.4.0 using a nested 2-way ANOVA to establish a p-value based gene ranking which was then used in gene set enrichment analysis (GSEA) for cluster analysis (GSEA v.2.0, Broad Institute, Cambridge, MA)[19]. ANOVA was chosen to control for possible batch effects related to different days of RNA preparation and nested in the N2 and gas-1(fc21) sample groups. Clusters were designed to represent C. elegans genesets relevant to human metabolic pathways. Genesets were curated from biochemical pathway data publicly available from the Kyoto Encyclopedia of Genes and Genomes (KEGG) (www.genome.jp/kegg); cluster composition for the 105 KEGG pathways studied is described in the Supplementary Data File. Analyses using KEGG pathway clusters in GSEA were based on establishing two phenotypic groupings (eg, complex I mutant vs. wildtype). Only KEGG pathways containing at least 5 transcripts were included in GSEA analysis.
An independent microarray dataset was prepared for purposes of validation to determine if consistent expression profile patterns were present in mitochondrial dysfunction regardless of individual complex or subunit cause. To minimize possible contributions from intra-strain variation, total RNA isolated from 3 biological replicates of a given mutant strain grown in liquid culture was pooled to hybridize to a single GeneChip C. elegans genome array. 10 arrays in total comprised the validation dataset, including N2 grown on K12 E. coli (as a control for missense mutants), N2 grown on HT115 E. coli (as a control for RNAi-generated mutants), and 8 nuclear DNA-encoded mitochondrial respiratory chain subunit mutants (3 missense and 5 RNAi-induced) in complexes I, II, or III, as detailed in Table 1. This validation dataset was processed in a similar fashion as the original. GSEA analysis was alternatively performed using different phenotypic groupings, including complex I mutants vs. wildtype, complex I mutants vs. complex II + III mutants, and all mitochondrial mutants vs. wildtype (see Supplemental Data File).
Whole Worm Free Amino Acid Quantitation
Whole worm free amino acid levels were measured in small aliquots of (a) wildtype C. elegans (N2); (b) a complex I mutant (gas-1 (fc21))[10]; (c) a complex II mutant (mev-1(kn1))[9]; and (d) a complex III mutant (isp-1(qm150))[8]. Worms were grown synchronously on NGM agar plates, as described above, and then sorted in aliquots of 500 or 1,000 adult worms directly into 1.5 ml polypropylene tubes. After worms settled by gravity at room temperature for ~15–30 minutes, the supernatant was removed to leave a worm pellet in ~200 ul water. The total volume of each tube was adjusted to 1 ml with sterile water. Gram quantity worm aliquots grown in liquid culture (as above) were also prepared for N2 and gas-1(fc21) for purposes of assessing amino acids present in low concentration, such as GABA. Worm pellets were extracted with a solution of 9% perchloric acid using ∊-aminocaproic acid (16.7 umol/L) as an internal standard. Samples were then sonicated for 60 seconds at room temperature on a continuous setting at 2 of 10 (Sonic Dismembrator MDL100, Fisher, Pittsburgh, PA). Protein concentration was determined with the Coomassie Plus reagent (Pierce, Rockford, IL). Amino acid quantitation was performed by high performance liquid chromatography (HPLC) (Varian, Palo Alto, CA) using precolumn derivatization with o-phthalaldehyde and fluorescent detection[20]. Raw values were normalized to total worm number and to total protein concentration. Means were compared with a Student’s t-test. The fold change of ASP, LEU, VAL, ALA, and GLY relative to GLU was calculated by first normalizing the mean value for all biological replicates in a given mutant strain of each amino acid relative to glutamate, divided by the mean of all N2 replicates of each amino acid normalized to glutamate.
RESULTS
Expression profiling of C. elegans mitochondrial mutants identified multiple alterations in diverse biochemical pathways in comparison with wildtype controls. Table 2 catalogues 29 of the 86 KEGG pathways analyzed in GSEA that were concordantly upregulated in the gas-1 (fc21) complex I mutant in the initial dataset compared with wildtype. 18 of these 29 pathways were also upregulated in complex I mutants in a second, independent dataset when GSEA analysis of KEGG pathways was performed to compare gas-1(fc21) and 5 RNAi-induced complex I subunit mutants with wildtype (Table 2, “validation set”). Essential biochemical pathways upregulated in the complex I mutants include oxidative phosphorylation, pyruvate metabolism, glycolysis, the tricarboxylic acid (TCA) cycle, and pathways of amino acid, carbohydrate, fatty acid, and ketone metabolism. In addition, several cellular defense pathways are upregulated, including the metabolism of cytochrome P450 and glutathione. Figure 1 provides a representative example of GSEA data output for a given pathway for the TCA cycle, highlighted for both its statistically significant upregulation in the complex I mutants and its centrality to intermediary metabolism as an immediate precursor to the respiratory chain. Of note, expression of the individual genes encoding the TCA cycle enzymes do not reach a 2-fold level of alteration in the gas-1(fc21) mutants compared with wildtype when individually analyzed using ANOVA (see Supplementary Data File). Relatively few pathways are significantly down-regulated in complex I mutants. Most of these appear related to nucleotide metabolism, but none were validated in the second, independent dataset; indeed, several were actually upregulated in the second dataset (Table 2). A compilation of KEGG pathway results from multiple phenotypic groupings in the second dataset, including those involving the complex II and complex III mutants, is available in the Supplementary Data File.
Table 2. Biochemical pathways with concordantly altered expression in complex I mutants compared to wildtype.
29 of 86 KEGG pathways are significantly upregulated in gas-1 (fc21) missense mutants compared to wildtype (N2). All upregulated pathways were also found to be upregulated in an independent, validation dataset comparing gas 1 and 5 complex I RNAi subunit mutants with N2, where 19 reach a significance level of p < 0.1, as indicated by yellow highlight. Biochemical pathways are indicated with the # of genes in each pathway (size), normalized enrichment score (NES), statistical significance of altered pathway expression between mutant and wildtype controls (p-value), and false positive likelihood in the form of a false discovery rate (FDR q-value). The significance of altered pathway expression in the initial dataset is highlighted in red with p < 0.0001, in green with p < 0.01, in blue with p < 0.05, and in black to indicate a trend toward altered regulation but with marginal p-values < 0.1.
| UPREGULATED EXPRESSION IN COMPLEX I MUTANTS: | ||||||
|---|---|---|---|---|---|---|
| KEGG PATHWAY | SIZE | NES | NOM p-value | FDR q-value | validation set p-value | validation set FDR q-value |
| OXIDATIVE PHOSPHORYLATION | 84 | 2.32 | 0.0000 | 0.0000 | 0.0038 | 0.1251 |
| CYSTEINE METABOLISM | 13 | 1.91 | 0.0000 | 0.0034 | 0.3299 | 0.4507 |
| TYROSINE METABOLISM | 19 | 1.83 | 0.0000 | 0.0094 | 0.0511 | 0.1690 |
| METABOLISM OF XENOBIOTICS BY CYTOCHROME P450 | 23 | 1.78 | 0.0000 | 0.0148 | 0.0000 | 0.0013 |
| PYRUVATE METABOLISM | 18 | 1.74 | 0.0000 | 0.0137 | 0.0060 | 0.0773 |
| BENZOATE DEGRADATION VIA COA LIGATION | 20 | 1.73 | 0.0000 | 0.0094 | 0.2292 | 0.3966 |
| 1- AND 2-METHYLNAPHTHALENE DEGRADATION | 6 | 1.68 | 0.0000 | 0.0167 | 0.0067 | 0.1383 |
| GLYCINE, SERINE AND THREONINE METABOLISM | 24 | 1.74 | 0.0016 | 0.0117 | 0.0226 | 0.1328 |
| GLYCOLYSIS _ GLUCONEOGENESIS | 25 | 1.74 | 0.0016 | 0.0106 | 0.0192 | 0.1420 |
| TRYPTOPHAN METABOLISM | 34 | 1.77 | 0.0016 | 0.0121 | 0.0752 | 0.2398 |
| CARBON FIXATION | 14 | 1.68 | 0.0017 | 0.0173 | 0.0683 | 0.1770 |
| NITROGEN METABOLISM | 19 | 1.73 | 0.0031 | 0.0100 | 0.0555 | 0.1781 |
| VALINE, LEUCINE AND ISOLEUCINE DEGRADATION | 35 | 1.74 | 0.0050 | 0.0102 | 0.0166 | 0.1252 |
| BILE ACID BIOSYNTHESIS | 17 | 1.68 | 0.0066 | 0.0188 | 0.0030 | 0.0971 |
| CITRATE CYCLE (TCA CYCLE) | 26 | 1.61 | 0.0066 | 0.0402 | 0.0114 | 0.1348 |
| FATTY ACID METABOLISM | 51 | 1.57 | 0.0109 | 0.0581 | 0.0052 | 0.1433 |
| GLYOXYLATE AND DICARBOXYLATE METABOLISM | 5 | 1.52 | 0.0200 | 0.0938 | 0.1402 | 0.3560 |
| PHENYLALANINE METABOLISM | 11 | 1.54 | 0.0204 | 0.0778 | 0.0581 | 0.1638 |
| PROPANOATE METABOLISM | 23 | 1.51 | 0.0297 | 0.0935 | 0.1032 | 0.2757 |
| ALANINE AND ASPARTATE METABOLISM | 20 | 1.50 | 0.0302 | 0.1023 | 0.0244 | 0.1302 |
| ARGININE AND PROLINE METABOLISM | 15 | 1.46 | 0.0396 | 0.1327 | 0.0385 | 0.1712 |
| CYANOAMINO ACID METABOLISM | 5 | 1.45 | 0.0411 | 0.1479 | 0.8868 | 0.9518 |
| SYNTHESIS AND DEGRADATION OF KETONE BODIES | 6 | 1.42 | 0.0474 | 0.1635 | 0.3264 | 0.4462 |
| BUTANOATE METABOLISM | 30 | 1.39 | 0.0489 | 0.1802 | 0.0886 | 0.2912 |
| SELENOAMINO ACID METABOLISM | 19 | 1.42 | 0.0570 | 0.1647 | 0.2641 | 0.4297 |
| NICOTINATE AND NICOTINAMIDE METABOLISM | 10 | 1.43 | 0.0586 | 0.1618 | 0.6879 | 0.7869 |
| STREPTOMYCIN BIOSYNTHESIS | 6 | 1.40 | 0.0681 | 0.1811 | 0.5923 | 0.6951 |
| FRUCTOSE AND MANNOSE METABOLISM | 21 | 1.40 | 0.0734 | 0.1845 | 0.7197 | 0.8053 |
| GLUTATHIONE METABOLISM | 28 | 1.35 | 0.0743 | 0.2324 | 0.0238 | 0.1469 |
| DOWNREGULATED EXPRESSION IN COMPLEX I MUTANTS: | ||||||
| KEGG PATHWAY | SIZE | NES | NOM p-val | FDR q-val | validation set p-value | validation set FDR q-value |
| RNA POLYMERASE | 21 | −2.21 | 0.0000 | 0.0000 | ↑ 0.7927 | 0.8660 |
| PROTEASOME | 30 | −1.92 | 0.0000 | 0.0026 | no altered expression | |
| PYRIMIDINE METABOLISM | 58 | −1.69 | 0.0027 | 0.0391 | ↓ 0.9955 | 1.0000 |
| PROTEIN EXPORT | 8 | −1.55 | 0.0400 | 0.1206 | ↑ 0.4845 | 0.5947 |
| PURINE METABOLISM | 86 | −1.33 | 0.0556 | 0.3378 | ↑0.6948 | 0.7199 |
| UREA CYCLE AND METABOLISM OF AMINO GROUPS | 7 | −1.41 | 0.0925 | 0.2561 | ↑0.0403 | 0.1733 |
Figure 1. Tricarboxylic acid cycle (TCA) pathway gene upregulation in complex I mutants.
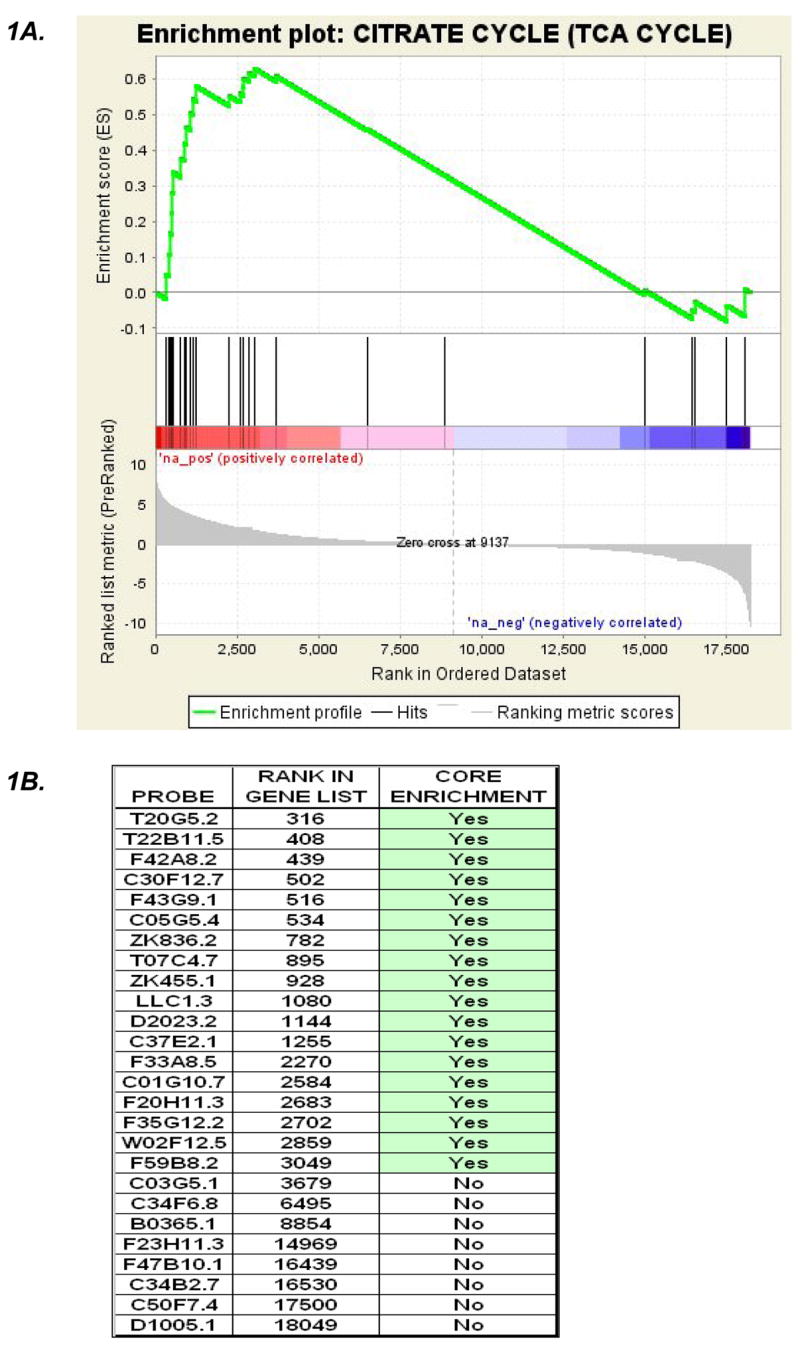

Relative expression levels of all genes on the GeneChip C. elegans genome arrays obtained in two phenotypic groupings (i.e., mutant and wildtype) are given a ranking in GSEA used to calculate the likelihood genes comprising a given cluster (i.e., TCA cycle cluster) are overrepresented at a given end of the rank list. A) An enrichment plot indicates the rank of every gene in a pathway cluster (vertical black lines) as well as those genes which fall under the leading edge (between the left edge and the peak of the green curve). 21 of 26 TCA cycle transcripts annotated in the KEGG database are upregulated in the complex I mutant compared to wildtype. B) The table indicates the TCA gene transcripts in C. elegans, their individual rank among all genes on the array, and an indication of whether they contribute to the maximum enrichment score leading to a p value of 0.0066 (see Table 2). C) A visual representation of the overall upregulated TCA expression profile in complex I mutants can be obtained in pathway form (www.genMAPP.org). Red and green colors indicate genes overexpressed and underexpressed, respectively, in the mutant compared to wildtype, with shade intensity representing significance level.
Since ten of the upregulated expression pathways in complex I mutants are involved in amino acid metabolism, we asked whether quantitative amino acid profiling would reveal alterations in the absolute levels of amino acids. In isolates of one thousand synchronized nematodes, we found that normalization of whole worm amino acid raw data to number of worms afforded the highest reproducibility (Figure 2). Similar patterns of results were obtained when raw data were normalized to total worm protein (data not shown). Surprisingly, alanine is the predominant free amino acid in the worms, regardless of genotype. In addition, while the limits of sensitivity prohibited ascertainment of GABA levels in small aliquots (i.e., 1,000 worms), measurement of amino acid levels in gram aliquots (i.e., 1 × 10⁶ worms) grown in liquid culture and normalized to total worm protein revealed a greater than 4-fold decrease of GABA in gas-1(fc21) mutants (mean 0.28 nmol/mg protein, S.D. 0.09, n=6) compared with N2 controls (mean 1.33 nmol/mg protein, S.D 0.44, n=9). The remainder of the amino acid profile patterns observed in the larger worm aliquots grown in liquid culture was otherwise similar to that represented in Figure 2 of 1,000 worm aliquots grown on plates under exact stage precision and normalized to worm number.
Figure 2. Quantitative profiling of free amino acids in respiratory chain mutants and wildtype worms.

2a) Alanine is the most prevalent amino acid in C. elegans. Complex II (mev-1(kn1)) and complex III (isp-1(qm150)) mutants display largely similar patterns of alterations in amino acid profiles, each with 9 of 16 amino acid levels significantly different from wildtype at p < 0.05 (GLU, GLN, GLY, THR, VAL, PHE (in mev-1 only), IL, LEU, ORN, and LYS (in isp-1 only). Interestingly, the significant increase in alanine observed in the complex I mutant is not seen in the complex II or III mutants. 2b) Compared with wildtype worms, gas-1(fc21) complex I mutants show significant differences in 13 of 16 amino acid levels. Statistical significance is noted as ** p < 0.01 and *** p < 0.001. n represents # of synchronous adult worm aliquots of each strain studied. Values represent mean and standard error of whole worm free amino acid levels normalized to 1,000 adult worms.
Overall patterns of amino acid levels in mutants for different components of the respiratory chain were compared to obtain a broader view of metabolic consequences resulting from primary mitochondrial dysfunction (Table 3). Unique differences do exist in the amino acid profiles of different complex mutants, although complex II mutants and complex III mutants are more similar to each other than to complex I mutants. Only the complex I mutant has decreased phenylalanine, tyrosine, and arginine, with an increase in aspartate, glutamine, and alanine. All three mitochondrial mutants, regardless of the involved complex, have decreased glutamate and increased branched chain amino acids relative to wildtype. Furthermore, we noted significant increases in those amino acids formed via transamination of the cognate ketoacid with glutamate. This pattern was observed in all three mitochondrial mutants.
Table 3. Free amino acid profiles in complex I, II, and III mutants.
Individual profiles are listed for complex I (gas-1, NDUFS2 homologue), complex II (mev-1, SDHC homologue), and complex III (isp-1, reiske iron sulfur subunit homologue) missense mutants, respectively. The bottom five rows indicate the change in amino acid level relative to glutamate. Numbers indicate percent increases (red) or decreases (green) relative to N2. Brightness of the colors indicates the degree of statistical significance.
| C. elegans Mutant: | Complex 1 (gas-1) | Complex II (mev-1) | Complex III (isp-1) |
|---|---|---|---|
| Amino Acid: | |||
| ASP | 61 | 27 | 14 |
| GLU | 20 | 37 | 40 |
| SER | 12 | 10 | 13 |
| GLN | 69 | 27 | 13 |
| GLY | 98 | 41 | 68 |
| THR | 11 | 39 | 33 |
| ARG | 26 | 5 | 3 |
| ALA | 67 | 2 | 6 |
| TYR | 29 | 0 | 5 |
| TRYMETH | 61 | 22 | 9 |
| VAL | 140 | 54 | 125 |
| PHE | 22 | 17 | 18 |
| IL | 42 | 50 | 127 |
| LEU | 92 | 77 | 159 |
| ORN | 1 | 61 | 22 |
| LYS | 31 | 13 | 35 |
| Fold Change: | |||
| Asp:Glu | 2.0 | 2.0 | 1.9 |
| Leu:Glu | 2.4 | 2.8 | 4.3 |
| Val:Glu | 3.0 | 2.5 | 3.8 |
| Ala:Glu | 2.1 | 1.6 | 1.8 |
| Gly:Glu | 2.5 | 2.3 | 2.8 |
| KEY: | |||
| INCREASED | p < 0.001 | ||
| p < 0.05 | |||
| DECREASED | p < 0.001 | ||
| p < 0.05 | |||
| # | % change from N2 | ||
DISCUSSION
Adapting the GSEA analytic method to exploit gene homology and bridge interspecies gene annotation differences affords a coherent view of global gene expression alterations at the level of integrated metabolic pathways relevant to human biology. Such information provides a deeper understanding of the consequences of single nuclear gene mutations in the respiratory chain of C elegans. Indeed, for the complex I mutant the highest enrichment score of all biochemical pathways tested was that of the OXPHOS gene cluster (Table 2), suggesting that inherent respiratory chain dysfunction evokes compensatory transcriptional upregulation of the entire respiratory chain. This result is consistent with observations of OXPHOS upregulation in previously published microarray analyses performed on human mitochondrial disease samples harboring a variety of mitochondrial DNA mutations [21]. Contrasting with this expression signature of primary respiratory chain dysfunction, downregulation of mitochondrial OXPHOS was seen upon transcriptional analysis of primary TCA cycle mutants in S. cerevisiae [22].
Metabolic pathways that closely articulate with the TCA cycle are also upregulated in the mitochondrial mutants, including the pathways of pyruvate metabolism, glycolysis, and several reactions involved in the degradation of amino acids, carbohydrates, fatty acids, and ketone bodies. Thus, a “signature” of mutations in the respiratory chain appears to be stimulation of the constituent enzymes of the TCA cycle and of many pathways that furnish substrate to it. The Genemapp of the GSEA clustering results (Figure 1c) appears to indicate that the only TCA enzyme not increased and perhaps even decreased was succinyl-CoA lyase. However, use of clustering analysis prohibits speculation on any single gene change. Furthermore, the raw expression data reveals that the three C. elegans transcripts encoding succinyl-CoA lyase were only marginally downregulated (between −1.0 and −1.3 fold) in gas-1(fc21) complex I missense mutants when compared with wildtype (Supplementary Data File). Such minimal expression changes underscore the value of cluster based analyses across entire biochemical pathways to aid contextual interpretation of any one gene change. Analyses such as GSEA determine if statistically significant concordant alterations occur even if more modest than the 2-fold expression level classically required to suggest up- or down-regulation [19, 23].
Correlating genomic microarray expression data with quantitative free amino acid data allows novel insight into the effects of single mutations in structural subunits of different respiratory chain complexes. For example, significant upregulation of the phenylalanine and arginine metabolic pathways (Table 2) accompanied a decrease in the levels of these amino acids in complex I mutant worms (Table 3 and Figure 1). These data sets provide internally consistent evidence that animals adapt to respiratory chain dysfunction by increasing amino acid degradation in order to augment the availability of substrates for oxidative phosphorylation.
In contrast, increases are seen in both the expression profiles and the absolute concentrations of other amino acids, exemplified by alanine and the branched-chain amino acids. A likely explanation for this pattern is that the oxidation of ketoacids such as pyruvate and α-ketoglutarate is impaired in mitochondrial mutants. These ketoacids are then more accessible for transamination with glutamate to yield their cognate amino acids. Transaminases generally mediate equilibrium reactions in which net flux is directly related to the relative concentration of reactants. The accumulation of ketoacids results in elevations of alanine, aspartate, leucine, valine, and glycine, as well as diminished levels of glutamate (Table 3). In addition, impaired complex I function presumably results in an increased NADH:NAD+ ratio[24], thereby attenuating oxidative deamination of glutamate via glutamate dehydrogenase (Figure 3). The glutamate pool that is utilized for transamination would be replenished by “reversal” of the glutamate dehydrogenase reaction, or reductive amination of α-ketoglutarate, a reaction that would be favored by an increased NADH:NAD+ ratio. It may be that alterations in concentrations of amino acids such as leucine, which can be formed by transamination of the cognate ketoacid with glutamate, afford a sensitive marker of human mitochondrial respiratory chain disease.
Figure 3. Schematic overview of glutamate metabolism.

Respiratory chain dysfunction presumably results in an increased NADH:NAD+ ratio (indicated by red arrows), which limits oxidation of ketoacids such as α-ketoisocaproate (KIC), the ketoacid of leucine. The result is greater accessibility of the ketoacid for conversion to its parent amino acid – in this illustration, leucine (Leu). A consequence would be accumulation of the parent amino acid and relative depletion of glutamate (Glu) (see Table 3). Some glutamate might be derived from reductive amination of −–ketoglutarate (αKG) in the glutamate dehydrogenase reaction, which is enhanced by an increased NADH:NAD+ ratio. However, this reaction is not sufficiently robust to prevent an overall diminution of the glutamate concentration and a marked increase in the ratio of leucine (and other amino acids) to glutamate (Table 3). This suggests that levels of amino acids such as leucine, which are formed from transamination reactions with glutamate, may be sensitive indicators of an altered redox state. Postulated direction of equilibrium reaction alterations occurring in primary respiratory chain dysfunction are indicated by blue arrows.
It is important to recognize that the current investigation represents whole animal free amino acid steady state levels rather than tissue-specific amino acid pools. The latter information is very difficult to determine in this microscopic model, as is precise measurement of ATP pools at either the tissue or subcellular compartmental level. Similarly, ability is limited to readily assess C. elegans’ intracellular NADH/NAD+ redox poise at the tissue level to permit confirmation of the generally well-accepted presumption that the mitochondrial milieu is relatively reduced in the face of mitochondrial dysfunction.
Nonetheless, correlation of amino acid levels and gene expression data may shed light of pathophysiologic import. It is of interest that alanine is the predominant amino acid in all C. elegans strains studied. Since no homologous genes have been identified to indicate the existence of an intact urea cycle in C. elegans (www.genome.jp/kegg), we postulate that alanine may be a major carrier of nitrogenous waste in this organism, as has been described in other animal models [25, 26]. Furthermore, the alanine concentration is substantially and significantly increased in the complex I mutant but unchanged from wildtype in the complex II mutant (Figure 2). In the complex III mutant, which has partially impaired complex I-dependent OXPHOS capacity (Table 1), alanine levels tend to increase but do not reach statistical significance in comparison with wildtype (Figure 2a). One possible explanation for this data may be that a threshold effect requires a greater inhibition of complex I activity before alanine handling is significantly affected. Similarly, blood alanine can be high in humans with mitochondrial disease and a consequent inability to oxidize pyruvate, which is transaminated to alanine [27].
We also found levels of GABA to be significantly decreased in complex I mutants. A contributing factor may be increased transamination of GABA to succinate in the mitochondrial mutants. Transamination of GABA requires α-ketoglutarate as a co-reactant, and NAD+ is a substrate of the α-ketoglutarate dehydrogenase reaction. A diminution of this nucleotide consequent to complex I dysfunction would favor α-ketoglutarate accumulation and GABA transamination. In addition, transamination of GABA would yield succinate, which is oxidized via complex II. Such a possibility is consistent with the polarographic finding in isolated C. elegans mitochondria from complex I mutants of increased complex II-dependent OXPHOS capacity when succinate is used as a substrate (Table 1)[12]. The reduced GABA level also might reflect decreased levels of its precursor, glutamate (Table 3), although it is not known whether glutamate decarboxylase, which converts glutamate to GABA, is already saturated with respect to glutamate in C. elegans, in which case the decline of glutamate would not have a major effect on flux. Little is known of brain GABA levels in patients with mutations that involve complex I, but it is possible that an analogous, untoward result in humans with mitochondrial dysfunction might be a relative depletion of GABA, the major inhibitory neurotransmitter in brain [28].
In summary, these data afford new insight into adaptations that accompany mutations of single nuclear DNA-encoded structural subunits of the mitochondrial respiratory chain in C. elegans. Future studies of metabolic flux in these animals may permit differentiation of specific mutations. Such studies could use stable isotopes as tracers in the various C. elegans mutants [29]. An important goal would be the identification of a metabolic “signature” to provide insight into cellular adaptation patterns in primary mitochondrial disease. This body of information may permit the development of a systems biology-based diagnostic approach to mitochondrial disease in human patients. C. elegans can also provide a system in which to test the efficacy of treatments for mitochondrial diseases [30], a class of disorders that has proved largely resistant to therapy.
Supplementary Material
Acknowledgments
The authors appreciate the helpful discussions of Oksana Horyn and Todd Lamitina. This work was supported in part by National Institutes of Health grants K08-DK073545 (M.J.F.) and R01-58881 (M.M.S. and P.G.M.).
Footnotes
Publisher's Disclaimer: This is a PDF file of an unedited manuscript that has been accepted for publication. As a service to our customers we are providing this early version of the manuscript. The manuscript will undergo copyediting, typesetting, and review of the resulting proof before it is published in its final citable form. Please note that during the production process errors may be discovered which could affect the content, and all legal disclaimers that apply to the journal pertain.
References
- 1.Haas RH, et al. Mitochondrial Disease: A practical approach for primary care physicians. Pediatrics. 2007 doi: 10.1542/peds.2007-0391. in press. [DOI] [PubMed] [Google Scholar]
- 2.Schaefer AM, et al. The epidemiology of mitochondrial disorders--past, present and future. Biochim Biophys Acta. 2004;1659(2–3):115–20. doi: 10.1016/j.bbabio.2004.09.005. [DOI] [PubMed] [Google Scholar]
- 3.Thorburn DR, et al. Biochemical and molecular diagnosis of mitochondrial respiratory chain disorders. Biochim Biophys Acta. 2004;1659(2–3):121–8. doi: 10.1016/j.bbabio.2004.08.006. [DOI] [PubMed] [Google Scholar]
- 4.Wolf NI, Smeitink JA. Mitochondrial disorders: a proposal for consensus diagnostic criteria in infants and children. Neurology. 2002;59(9):1402–5. doi: 10.1212/01.wnl.0000031795.91814.d8. [DOI] [PubMed] [Google Scholar]
- 5. [accessed 11–1–07];WormBase web site. http://www.wormbase.org, release WS182.
- 6.Wood WB. Cold Spring Harbor monograph series; 17. xiii. Cold Spring Harbor, N.Y: Cold Spring Harbor Laboratory; 1988. The Nematode Caenorhabditis elegans; p. 667. [Google Scholar]
- 7.Lai CH, et al. Identification of novel human genes evolutionarily conserved in Caenorhabditis elegans by comparative proteomics. Genome Res. 2000;10(5):703–13. doi: 10.1101/gr.10.5.703. [DOI] [PMC free article] [PubMed] [Google Scholar]
- 8.Feng J, Bussiere F, Hekimi S. Mitochondrial electron transport is a key determinant of life span in Caenorhabditis elegans. Dev Cell. 2001;1(5):633–44. doi: 10.1016/s1534-5807(01)00071-5. [DOI] [PubMed] [Google Scholar]
- 9.Ishii N, et al. A mutation in succinate dehydrogenase cytochrome b causes oxidative stress and ageing in nematodes. Nature. 1998;394(6694):694–7. doi: 10.1038/29331. [DOI] [PubMed] [Google Scholar]
- 10.Kayser EB, Morgan PG, Sedensky MM. GAS-1: a mitochondrial protein controls sensitivity to volatile anesthetics in the nematode Caenorhabditis elegans. Anesthesiology. 1999;90(2):545–54. doi: 10.1097/00000542-199902000-00031. [DOI] [PubMed] [Google Scholar]
- 11.Timmons L, Court DL, Fire A. Ingestion of bacterially expressed dsRNAs can produce specific and potent genetic interference in Caenorhabditis elegans. Gene. 2001;263(1–2):103–12. doi: 10.1016/s0378-1119(00)00579-5. [DOI] [PubMed] [Google Scholar]
- 12.Falk MJ, et al. Mitochondrial complex I function modulates volatile anesthetic sensitivity in C. elegans. Curr Biol. 2006;16(16):1641–5. doi: 10.1016/j.cub.2006.06.072. [DOI] [PMC free article] [PubMed] [Google Scholar]
- 13.Kayser EB, et al. Mitochondrial expression and function of GAS-1 in Caenorhabditis elegans. J Biol Chem. 2001;276(23):20551–8. doi: 10.1074/jbc.M011066200. [DOI] [PubMed] [Google Scholar]
- 14.Kamath RS, Ahringer J. Genome-wide RNAi screening in Caenorhabditis elegans. Methods. 2003;30(4):313–21. doi: 10.1016/s1046-2023(03)00050-1. [DOI] [PubMed] [Google Scholar]
- 15.Kamath RS, et al. Effectiveness of specific RNA-mediated interference through ingested double-stranded RNA in Caenorhabditis elegans. Genome Biol. 2001;2(1):RESEARCH0002. doi: 10.1186/gb-2000-2-1-research0002. [DOI] [PMC free article] [PubMed] [Google Scholar]
- 16.Golden TR, Melov S. Microarray analysis of gene expression with age in individual nematodes. Aging Cell. 2004;3(3):111–24. doi: 10.1111/j.1474-9728.2004.00095.x. [DOI] [PubMed] [Google Scholar]
- 17.Sambrook J, Russell DW. Molecular Cloning: A laboratory manual. 3. Vol. 1. Cold Spring Harbor Laboratory Press; Cold Spring Harbor, NY: 2001. Extraction, Purfication, and Analysis of mRNA from Eukaryotic Cells. [Google Scholar]
- 18.Livak KJ, Schmittgen TD. Analysis of relative gene expression data using real-time quantitative PCR and the 2(−Delta Delta C(T)) Method. Methods. 2001;25(4):402–8. doi: 10.1006/meth.2001.1262. [DOI] [PubMed] [Google Scholar]
- 19.Subramanian A, et al. Gene set enrichment analysis: a knowledge-based approach for interpreting genome-wide expression profiles. Proc Natl Acad Sci U S A. 2005;102(43):15545–50. doi: 10.1073/pnas.0506580102. [DOI] [PMC free article] [PubMed] [Google Scholar]
- 20.Jones BN, Gilligan JP. o-Phthaldialdehyde precolumn derivatization and reversed-phase high-performance liquid chromatography of polypeptide hydrolysates and physiological fluids. J Chromatogr. 1983;266:471–82. doi: 10.1016/s0021-9673(01)90918-5. [DOI] [PubMed] [Google Scholar]
- 21.Crimi M, et al. Molecular research technologies in mitochondrial diseases: the microarray approach. IUBMB Life. 2005;57(12):811–8. doi: 10.1080/15216540500460269. [DOI] [PubMed] [Google Scholar]
- 22.McCammon MT, et al. Global transcription analysis of Krebs tricarboxylic acid cycle mutants reveals an alternating pattern of gene expression and effects on hypoxic and oxidative genes. Mol Biol Cell. 2003;14(3):958–72. doi: 10.1091/mbc.E02-07-0422. [DOI] [PMC free article] [PubMed] [Google Scholar]
- 23.Mootha VK, et al. PGC-1alpha-responsive genes involved in oxidative phosphorylation are coordinately downregulated in human diabetes. Nat Genet. 2003;34(3):267–73. doi: 10.1038/ng1180. [DOI] [PubMed] [Google Scholar]
- 24.Wallace DC, Scriver CR, et al., editors. The Metabolic & Molecular Bases of Inherited Disease. 8. II. McGraw Hill; New York: 2001. Chapter 105. Mitochondria and Neuro-ophthalmologic Diseases. [Google Scholar]
- 25.Schousboe A, Sonnewald U, Waagepetersen HS. Differential roles of alanine in GABAergic and glutamatergic neurons. Neurochem Int. 2003;43(4–5):311–5. doi: 10.1016/s0197-0186(03)00017-2. [DOI] [PubMed] [Google Scholar]
- 26.Tsacopoulos M, et al. The nutritive function of glia is regulated by signals released by neurons. Glia. 1997;21(1):84–91. [PubMed] [Google Scholar]
- 27.Debray FG, et al. Diagnostic accuracy of blood lactate-to-pyruvate molar ratio in the differential diagnosis of congenital lactic acidosis. Clin Chem. 2007;53(5):916–21. doi: 10.1373/clinchem.2006.081166. [DOI] [PubMed] [Google Scholar]
- 28.Behar KL, Rothman DL. In vivo nuclear magnetic resonance studies of glutamate-gamma-aminobutyric acid-glutamine cycling in rodent and human cortex: the central role of glutamine. J Nutr. 2001;131(9 Suppl):2498S–504S. doi: 10.1093/jn/131.9.2498S. discussion 2523S–4S. [DOI] [PubMed] [Google Scholar]
- 29.Vo TD, Paul Lee WN, Palsson BO. Systems analysis of energy metabolism elucidates the affected respiratory chain complex in Leigh's syndrome. Mol Genet Metab. 2007;91(1):15–22. doi: 10.1016/j.ymgme.2007.01.012. [DOI] [PubMed] [Google Scholar]
- 30.Grad LI, Lemire BD. Mitochondrial complex I mutations in Caenorhabditis elegans produce cytochrome c oxidase deficiency, oxidative stress and vitamin-responsive lactic acidosis. Hum Mol Genet. 2004;13(3):303–14. doi: 10.1093/hmg/ddh027. [DOI] [PubMed] [Google Scholar]
Associated Data
This section collects any data citations, data availability statements, or supplementary materials included in this article.