

Abstract
Study has demonstrated an essential role of cortical filamentous actin (F-actin) in insulin-regulated glucose uptake by skeletal muscle. Here, we tested whether perturbations in F-actin contributed to impaired insulin responsiveness provoked by hyperinsulinemia. In L6 myo-tubes stably expressing GLUT4 that carries an exofacial myc-epitope tag, acute insulin stimulation (20 min, 100 nM) increased GLUT4myc translocation and glucose uptake by ~2-fold. In contrast, a hyperinsulinemic state, induced by inclusion of 5 nM insulin in the medium for 12 h decreased the ability of insulin to stimulate these processes. Defects in insulin signaling did not readily account for the observed disruption. In contrast, hyperinsulinemia reduced cortical F-actin. This occurred concomitant with a loss of plasma membrane phosphatidylinositol 4,5-bisphosphate (PIP2), a lipid involved in cytoskeletal regulation. Restoration of plasma membrane PIP2 in hyperinsulinemic cells restored F-actin and insulin responsiveness. Consistent with these in vitro observations suggesting that the hyperinsulinemic state negatively affects cortical F-actin structure, epitrochlearis skeletal muscle from insulin-resistant hyperinsulinemic Zucker fatty rats displayed a similar loss of F-actin structure compared with that in muscle from lean insulin-sensitive littermates. We propose that a component of insulin-induced insulin resistance in skeletal muscle involves defects in PIP2/F-actin structure essential for insulin-regulated glucose transport.
Keywords: Hyperinsulinemia; phosphatidylinositol 4,5-bisphosphate
The ability of insulin to regulate the cellular localization of the glucose transporter GLUT4 in muscle and fat is vital in the management of blood glucose homeostasis. Normally, in the basal state, this transporter resides in a yet uncharacterized intracellular membrane compartment, and upon insulin stimulation, it rapidly populates the plasma membrane. The loss of this response in insulin-resistant individuals triggers a compensatory elevation of circulating insulin that initially offsets its insufficient activity. Over time, however, this hyperinsulinemia appears to contribute to the worsening of insulin resistance and the development of type 2 diabetes (15, 26). As the number of individuals worldwide with insulin resistance and compensatory hyperinsulinemia escalates, a deeper understanding at the cellular and molecular level of how insulin itself contributes to the pathogenesis of type 2 diabetes is critical.
It is well-established that chronic exposure to supraphysiological doses of insulin (100 nM) attenuates the expression levels and activity states of the insulin receptor (IR), insulin receptor substrate-1 (IRS-1), phosphatidylinositol 3-kinase, and Akt (20, 34, 36). Although it has been hypothesized that defective insulin signaling through IR, IRS-1, phosphatidylinositol 3-kinase, and Akt contributes to the progression of type 2 diabetes, an important and unresolved issue is that chronic exposure to lower, relevant doses of insulin (0.5–5 nM) also impairs insulin sensitivity without manifesting any obvious signal transduction abnormalities (11, 28, 30, 37). Interestingly, blood cells (neutrophils, mononuclear cells, erythrocytes) isolated from insulin-resistant individuals exhibit alterations in cortical actin structure and membrane lipid composition (1, 2, 9, 49). Since a role for actin in insulin-stimulated GLUT4 translocation has been implicated by several studies, these observations suggest that hyperinsulinemia-induced insulin resistance may be a consequence of actin abnormalities.
Consistent with this possibility, there is considerable previous evidence that cortical filamentous (F)-actin is essential for insulin-regulated glucose transport. For example, treatment with the actin-depolymerizing agent cytochalasin D or the actin monomer binding Red Sea sponge toxins latrunculin A or B inhibits insulin-stimulated GLUT4 translocation (31, 42, 46). Importantly, it has been shown that insulin elicits F-actin formation (3, 6, 14, 18, 24, 31, 43, 46). Thus insulin signaling to polymerize cortical F-actin apparently represents a required pathway for optimal movement and/or fusion of GLUT4-containing vesicle membranes to the cell surface. Recently, using 3T3-L1 adipocytes, our laboratory demonstrated a marked reduction in cortical F-actin in cells rendered insulin resistant by chronic exposure to low levels of insulin (11). This F-actin reduction was paralleled by diminished plasma membrane phosphatidylinositol 4,5-bisphosphate (PIP2), and exogenous replenishment of PIP2 restored actin integrity and insulin sensitivity. Furthermore, we recently demonstrated that actin cytoskeletal mechanics are an essential feature of insulin-stimulated glucose transport in intact skeletal muscle (7), which is a tissue responsible for ~80% of postprandial glucose disposal (16) and is regarded as a major peripheral site of insulin resistance in diabetes (12), yet it is unknown whether hyperinsulinemia induces cytoskeletal abnormalities in this relevant tissue.
Here we report that sustained exposure of skeletal muscle cells to hyperinsulinemia compromises phosphoinositide-regulated cortical F-actin polymerization. This loss of cortical F-actin integrity impairs insulin-stimulated GLUT4 translocation and glucose transport as evidenced by the fact that restoration of cortical F-actin integrity ameliorates the insulin-resistant state. Consistent with the experimentally induced F-actin-based insulin resistance, skeletal muscles isolated from hyperinsulinemic, insulin-resistant Zucker rats display a reduction in cortical F-actin staining compared with muscles isolated from lean, insulin-sensitive littermate control rats.
MATERIALS AND METHODS
Materials
Rat L6 skeletal muscle cells stably expressing GLUT4 that carries an exofacial myc-epitope (L6-GLUT4myc) were a generous gift from Dr. Amira Klip (The Hospital for Sick Children, Toronto, Canada). α-Minimum essential medium (α-MEM) and Dulbecco’s modified Eagle’s medium were from Invitrogen (Grand Island, NY). Fetal bovine serum (FBS) was from Atlas Biologicals (Fort Collins, CO). Phosphatidylinositide [PtsIns(4,5)P2, catalog no. P-4516] and histone carrier were purchased from Echelon Biosciences (Salt Lake City, UT). 2-Deoxy-D-glucose [1,2-3H] was purchased from MP Biomedicals (Irvine, CA). Monoclonal mouse phosphatidyl-inositol 4,5-bisphosphate antibody was purchased from Assay Designs (Ann Arbor, MI). Anti-c-myc and anti-caveolin-3 antibodies were from Santa Cruz Biotechnology (Santa Cruz, CA). Beta-actin specific mouse IgM anti-human F-actin antibody was from Serotec (Oxford, UK). Anti-phospho-Akt (Ser473), anti-phospho-Akt (Thr308), and anti-phospho-Akt substrate (PAS) antibodies were from Cell Signaling Technology (Beverly, MA). Anti-Akt-2 antibody was kindly provided by Dr. Morris J. Birnbaum (University of Pennsylvania, Philadelphia, PA). Rhodamine red-X-conjugated secondary antibodies were from Jackson Immunoresearch (West Grove, PA). Unless otherwise indicated, all other chemicals were from Sigma (St. Louis, MO).
Animals
Specific pathogen-free obese (fa/fa) and lean female Zucker rats were obtained from Harlan Sprague-Dawley at 6 wk of age. Upon arrival, rats were housed individually in a temperature-controlled room that was maintained on a 12:12-h light-dark cycle. The rats were fed NIH standard chow ad libitum. After 2 wk of acclimation, rats in the postprandial state were anesthetized with 5 mg/100 g body wt pentobarbital sodium and the epitrochlearis muscles were dissected out, blotted on gauze, quickly rinsed in saline, and immersed in 4% paraformaldehyde/PBS. Both epitrochlearis muscles from five lean and five obese rats were used (n = 10 muscles).
Immunofluorescent labeling of isolated epitrochlearis muscles
Following fixation for 2 h, tissues were washed with PBS, then permeabilized for 20 min at room temperature in 0.2% Triton X-100/ 0.05% Tween 20/PBS. Paired tissue sections were rinsed three times in PBS then blocked in either 5% donkey serum (for confocal studies) or 5% milk (for Li-Cor studies) for 60 min at room temperature. Tissues were then incubated overnight at 4°C in anti-F-actin antibody (confocal) or a mixture of anti-F-actin and anti-caveolin-3 antibodies (Li-Cor) diluted 1:50 in blocking buffer. Samples were washed extensively in PBS before incubation for 60 min at room temperature in 1:50 rhodamine red-X-conjugated donkey anti-mouse IgM (confocal) or 1:50 Alexa Fluor 680-conjugated anti-mouse IgM and 1:50 IRDye 800-conjugated anti-goat IgG (Li-Cor). Secondary antibody incubations were followed by extensive washing in PBS then a quick ddH2O rinse. Tissues were mounted in slides with Vectashield (confocal) or without (Li-Cor) and were analyzed via confocal microscopy (model LSM 510 NLO; Zeiss, Thornwood, NY) and dual-infrared laser scanning microscopy (Li-Cor Odyssey; Lincoln, NE), respectively.
Cell culture and treatments
L6 skeletal muscle cells were cultured as detailed by Klip et al. (25, 45) with slight modifications. Myoblasts were maintained in α-MEM (5 mM glucose), supplemented with 10% FBS, and differentiation into multinucleated myotubes was induced with 2% FBS in α-MEM. All studies used myotubes between 5 and 7 days postinitiation of differentiation. Insulin induction of insulin resistance was performed by treating the cells in 5 nM insulin/ Dulbecco’s modified Eagle’s medium (25 or 5.5 mM glucose) for 12 h. Before all experiments, cells were serum starved for 30 min at 37°C. Cells were either untreated or treated for 50 min with different concentrations of phosphatidylinositide:histone complex, as detailed below. During the final 20 min of treatment, cells were left either in the basal state or were acutely stimulated with 100 nM insulin.
Immunodetection of PIP2 on plasma membrane sheets
Plasma membrane sheets from L6 myotubes were prepared as previously described (27) with slight modifications to optimize PIP2 immunofluorescent labeling. Briefly, following experimental treatments, cells were rinsed with room temperature Tris-buffered saline (TBS), then incubated for 60 s in 0.55 mg/ml poly-L-lysine in TBS. Cells were then swelled by being rinsed three times in a hypotonic buffer composed of (in mM) 23 KCl, 10 HEPES, pH 7.5, 1.67 MgCl2, and 1 EGTA. The cells were immersed in 10 ml of sonication buffer composed of 70 mM KCl, 30 mM HEPES, pH 7.5, 5 mM MgCl2, 3 mM EGTA, 1 mM DTT, and 100 μM PMSF, and sonicated twice for 3-s intervals with the use of a dismembranator (model 550; Fisher Scientific). Isolated sheets were immediately fixed for 20 min in 2% paraformaldehyde/TBS. At room temperature, fixed sarcolemma sheets were blocked in 5% donkey serum for 60 min, incubated for 60 min with a 1:50 dilution of mouse phosphatidylinositol 4,5-bisphosphate antibody, followed by incubation for 60 min with a 1:50 dilution of rhodamine red-X-conjugated anti-mouse IgG.
Whole-cell immunofluorescence and phalloidin staining
Following treatments, myotubes were fixed for 20 min at room temperature in 4% paraformaldehyde/PBS (GLUT4myc labeling and actin labeling for Li-Cor), or for 2 min in −20°C MeOH (actin labeling for confocal). After fixation, cells were either left unpermeabilized (GLUT4myc) or were permeabilized for 15 min at room temperature in 0.2% Triton X-100/PBS (actin for Li-Cor), or for 10 min at room temperature in 0.5% Triton X-100/TBS (actin for confocal). Cells were then blocked for 1 h at room temperature in 5% milk (GLUT4myc), fish serum (actin for Li-Cor), or 2% BSA (actin for confocal). Samples were incubated in a 1:50 dilution of primary antibody overnight at 4°C, followed by incubation at room temperature with 1:50 FITC-conjugated anti-mouse (confocal) or infrared-conjugated secondary antibody for 1 h. Actin-labeled samples were examined via confocal microscope. All microscopic and camera settings were identical within experiments, and representative images are shown. For whole-cell phalloidin staining, following specific treatments, myotubes were fixed for 20 min at room temperature in a PBS solution containing 4% paraformaldehyde and 0.2% Triton X-100. For labeling of actin after fixation, cells were incubated with 5 μg/ml of fluorescein isothiocyanate-conjugated phalloidin for 2 h at 25°C.
Cell immunofluorescence quantification
Whole cells were prepared and probed with primary antibodies to GLUT4myc and F-actin, as described above. Near-infrared IRDye 800 and 700 conjugated anti-goat, anti-mouse, and anti-rabbit IgG secondary antibodies were purchased from Rockland (Gilbertsville, PA), and Alexafluor 680 anti-mouse IgM antibody was purchased from Molecular Probes (Eugene, OR). Images were collected and quantitated with the Li-Cor infrared imaging system as previously described (35, 47). Immunofluorescent intensity was normalized to intensity from Syto60, a red fluorescent nucleic acid stain (Molecular Probes). By utilizing the LSM 510 NLO confocal microscope, Z-stack images of control and treated skeletal muscle were obtained. MetaMorph software was employed to digitally analyze cortical F-actin at the periphery of L6 myotube midsections.
PIP2 add-back
Histone H1 carrier was dissolved in ddH2O to a concentration of 250 μM, and PIP2 was prepared in a 1:2:0.8 chloroform:methanol:water solution, per manufacturer’s instructions. Carrier and PIP2 solutions were vortexed continuously for 30 min, followed by addition of carrier to PIP2 in a 1:2 ratio (carrier:PIP2), and vortexed again for another 10 min. Following treatments, myotubes were serum starved for 30 min in the absence or presence of varying concentrations of histone-conjugated PIP2.
2-Deoxyglucose uptake assays
Following treatments, cells were incubated in glucose-free buffer (125 mM NaCl, 5 mM KCl, 1.8 mM CaCl2, 2.6 mM MgSO4, 25 mM HEPES, 2 mM pyruvate, and 2% BSA) for 30 min, then either left in the basal state or stimulated with 100 nM insulin for 20 min. Glucose uptake was initiated with the addition of 2-deoxy-[1,2-3H]-glucose (0.055 μCi/μl). Nonspecific uptake was quantitated via cell-associated radioactivity in the presence of 20 μM cytochalasin B. After 10 min, uptake was terminated via four quick washes with ice-cold PBS. Cells were solubilized in 1 N NaOH and [3H] was measured by liquid scinitillation. Counts were normalized to total cellular protein, as determined by the Bradford method.
Preparation of F-actin extracts
After overnight incubations, F-actin fractions were obtained using an assay kit (catalog no. BK037, Cytoskeleton, Denver, CO). Briefly, cells were rinsed with PBS at 37°C and scraped and homogenized in a lysis and F-actin stabilization buffer (LAS1). F-actin was then isolated by centrifugation at 100,000 g for 60 min at 37°C. The F-actin-containing pellet was resuspended in ddH2O containing 10 μM cytochalasin D and was kept on ice for 60 min with mixing by syringe every 15 min to dissociate F-actin. Dissociated F-actin was centrifuged at 14,000 g for 10 min at 4°C and the pellet was discarded. Protein concentrations of the F-actin preparations were determined by the Bradford method.
Preparation of total cell extracts and immunoblotting
Total cell extracts were prepared from 100-mm plates of L6 myotubes following the appropriate treatment. Cells from each plate were washed two times with ice-cold PBS and scraped into 1 ml of lysis buffer (25 mM Tris, pH 7.4, 50 mM NaF, 10 mM Na3P2O7, 137 mM NaCl, 10% glycerol, and 1% Nonidet P-40) containing 2 mM phenylmethylsulfonyl fluoride, 2 mM Na3VO4, 5 μg/ml aprotinin, 10 μM leupeptin, and 1 μM pepstatin A, then rotated for 15 min at 4°C. Insoluble material was separated from the soluble extract by microcentrifugation for 15 min at 4°C. To ensure equal loading, protein concentrations were determined via the Bradford method and equivalent protein amounts of each sample were loaded onto an acrylamide gel. Samples were subjected directly to SDS-PAGE, as described below.
Electrophoresis and immunoblot analysis
Whole cell lysate fractions were separated by 7.5% SDS-PAGE and F-actin fractions were separated by 12% SDS-PAGE. The resolved fractions were transferred to nitrocellulose (Bio-Rad, Hercules, CA). Proteins were immunoblotted with either an Akt-2, phospho-specific Akt, or PAS antibody. Equal protein loading was confirmed by Ponceau staining and by immunoblot analysis for total actin. All immunoblots were analyzed via Li-Cor quantitation.
Statistical analysis
All values are reported as means ± SE. ANOVA was used to determine differences among groups. Where a significant difference was indicated, the Fisher’s test was used to determine significant differences between groups. P < 0.05 was considered statistically significant.
RESULTS
Insulin-induced insulin resistance
L6-GLUT4myc myotubes were left untreated (control) or were treated with 5 nM insulin for 12 h (12h Ins.). Following this period, the cells were bathed for 30 min in the same treatment medium lacking serum, and hexose uptake in the basal state, and after an acute insulin challenge (20 min, 100 nM) was determined (Fig. 1A). In control cells, acute insulin stimulation resulted in a 71% increase (P < 0.0001) in 2-deoxyglucose uptake. In contrast, myotubes that were pretreated with insulin for 12 h had a significantly smaller response to the acute insulin challenge, showing only a 45% increase (P < 0.0001) in 2-deoxyglucose uptake.
Fig. 1.
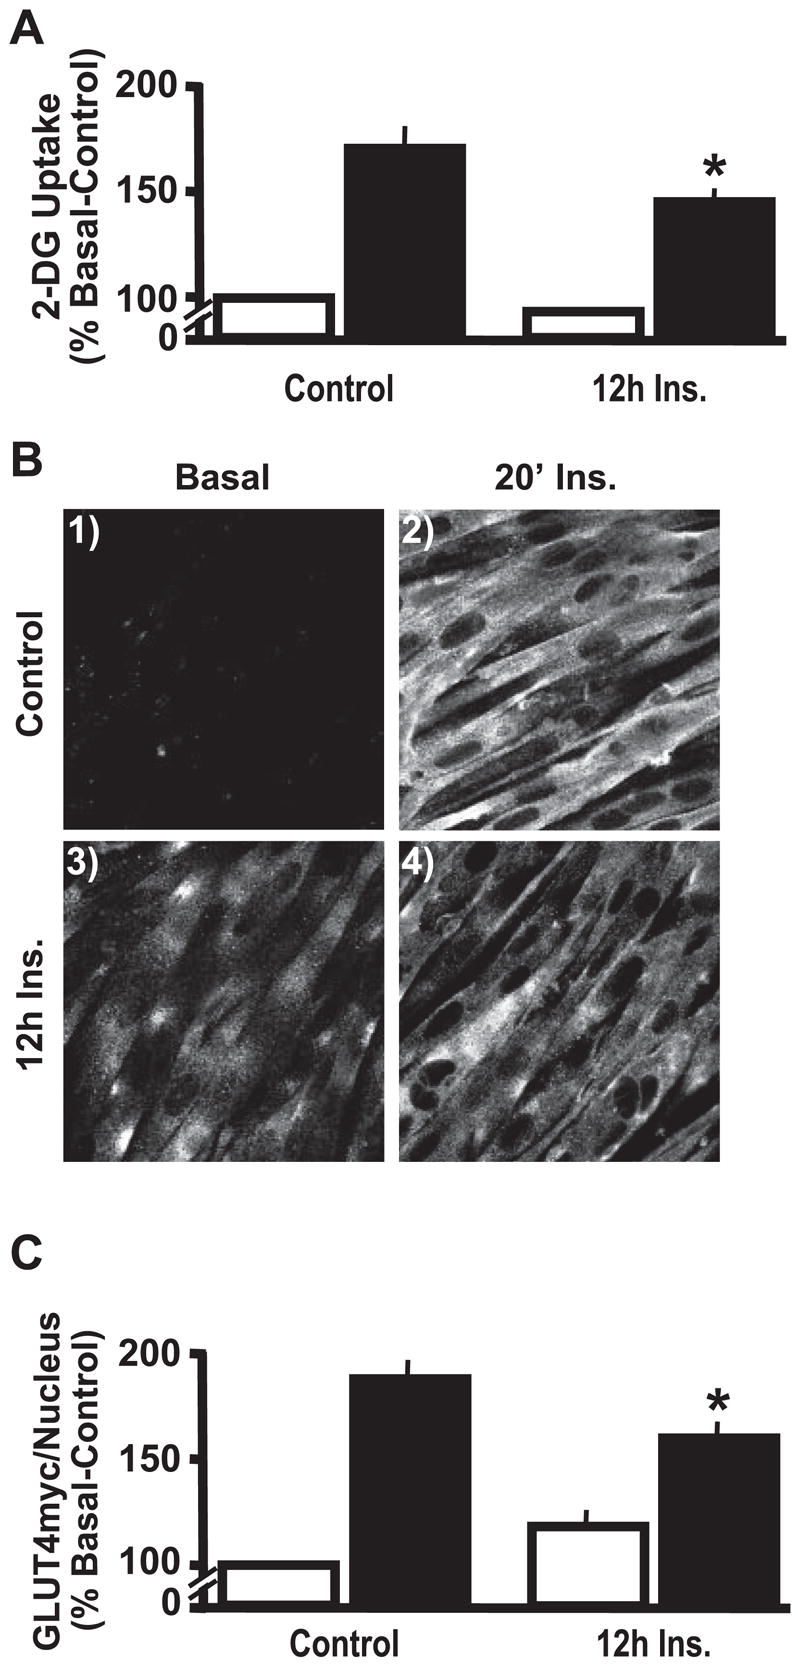
Chronic insulin stimulation impairs insulin sensitivity. L6 myotubes were left untreated (Control) or exposed to 5 nM insulin for 12 h (12h Ins). Subsequent acute insulin action was assessed by leaving cells untreated (open bars) or treated (solid bars) with 100 nM insulin for 20 min. Values are means ± SE of 2-deoxyglucose (2-DG) uptake (A) and GLUT4myc/nucleus quantification (C) and are from 5–6 experiments. Representative GLUT4myc images (B) from 3 experiments are shown. IF, immunofluorescent. *P < 0.02 vs. Control-20′ Ins group.
To begin elucidating the mechanism by which insulin pre-treatment lowered glucose uptake by 15% (P < 0.02), we next measured surface GLUT4 levels under the various treatment conditions. L6-GLUT4myc cells stably express GLUT4 tagged with an exofacial myc-epitope (GLUT4myc). This tagged transporter segregates, cycles, and responds to insulin in a manner similar to endogenous GLUT4 (23, 46). Acute insulin stimulation of control cells resulted in increased immunologic labeling of the myc-epitope at the surface of intact cells (Fig. 1B, compare panels 1 and 2). Consistent with impaired transporter accumulation at the cell surface accounting for the insulin-induced impairment in glucose transport, insulin-pre-treated myotubes displayed diminished GLUT4myc staining (Fig. 1B, compare panels 2 and 4).
To aid our efforts in quantification, we used the Li-Cor Odyssey with simultaneous 2-channel detection in the near infrared to measure the amount of plasma membrane myc-epitope normalized to nuclear DNA stain for an entire well of cells. Following primary antibody labeling of myc in intact cells, we used near infrared-conjugated secondary antibodies to detect the labeled myc. Nuclear fluorescence intensity was unaltered by any treatment condition (P > 0.05, data not shown). Acute insulin treatment increased cell surface myc compared with untreated control by 87% (P < 0.0001) (Fig. 1C). In contrast, insulin-pretreated myotubes had a significantly smaller response to the acute insulin challenge, showing only a 59% increase (P < 0.0001) in GLUT4myc translocation. This independent method of quantification showed a 15% reduction (P < 0.01) in acute insulin-stimulated GLUT4myc translocation following chronic insulin exposure, confirming qualitative observations. Furthermore, this decrease was strikingly similar to the percent loss of insulin-stimulated glucose transport (Fig. 1A). As we previously observed in the 3T3-L1 adipocyte cell line, myotubes that were pretreated with insulin for 12 h tended to have a slight increase in cell surface GLUT4 in the basal state (Fig. 1, B and C), however, this was not statistically significant (P = 0.10). Furthermore, in the presence of chronic insulin, basal-state glucose transport was not significantly different from control basal (Fig. 1A).
As documented by several laboratories, we observed that L6 cells exposed to a supraphysiological concentration of insulin (100 nM) for 12 h, displayed a strong signaling defect transmitted downstream to Akt-2 (data not shown). However, this signaling defect in Akt-2, the Akt isoform largely responsible for insulin-stimulated glucose uptake (4, 8), was not apparent in cells chronically treated with 5 nM insulin, as assessed by a reduced mobility indicative of the phosphorylation activation state (Fig. 2A). Furthermore, control cells and cells incubated in chronic insulin exhibited levels of acute insulin-stimulated Akt phosphorylation at Ser473 (Fig. 2B) and Thr308 (Fig. 2C) which were statistically indistinguishable (P = 0.44). To confirm the functionality of Akt, we employed a PAS antibody that specifically recognizes the RXRXX(T/S) motif on proteins that are phosphorylated by Akt. As shown in Fig. 2D, the ability of Akt to phosphorylate AS160, a 160 kDa protein implicated in regulating GLUT4 translocation (23, 38), was not altered in the insulin-resistant cells. In these Western blot analysis experiments, equal protein loading was confirmed by immunoblotting for total actin (Fig. 2E). Together, these data diminish the idea that the insulin-induced impairment in insulin-regulated GLUT4 translocation and glucose transport results from signaling abnormalities.
Fig. 2.

Insulin signaling propagation remains intact. Following chronic insulin treatment, whole cell lysates were prepared, equal protein amounts were loaded and proteins were resolved by 7.5% SDS-PAGE. Akt-2 (A), Akt (Ser473) (B), Akt (Thr308) (C), and anti-phospho-Akt substrate (PAS) (D) immunoblots (IB) from 3–5 experiments are shown. Total actin (E) IBs confirmed equal protein loading.
Hyperinsulinemia diminishes cortical F-actin and plasma membrane PIP2
Because the cortical F-actin appears essential in GLUT4 regulation, we next examined the effect of hyper-insulinemia on the actin cytoskeletal system in these cells. Utilizing an F-actin-specific antibody, confocal images of myotube midsections established that in the basal state, F-actin labeling is localized primarily to the cell periphery (Fig. 3A, panel 1). Myotubes incubated for 12 h in 5 nM insulin demonstrated a loss of cortical F-actin compared with control cells, as evidenced by diminished peripheral labeling (Fig. 3A, compare panels 1 and 2). Furthermore, digital image analysis of several cell surface areas (indicated by representative framed areas within panels) quantitatively showed that F-actin content was decreased by 21% (P < 0.005) following sustained insulin treatment (Fig. 3B). Figure 3A also shows propidium iodide co-stained nuclei. Use of the Li-Cor Odyssey to capture the F-actin staining intensity per nuclear intensity for an entire well of cells also revealed a 21% decrease (P < 0.005) in F-actin staining. We next used phalloidin staining as an additional method to label and detect filamentous actin in the L6 myotubes. Again, chronic insulin-treated cells displayed a qualitative loss of F-actin as demonstrated by diminished phalloidin staining compared with control cells (Fig. 3C). As a final method to verify hyperinsulinemia-induced F-actin losses, we quantitated F-actin via biochemical fractionation. F-actin separation and determination by Western immunoblot analysis confirmed that cells incubated overnight in 5 nM insulin undergo a reduction in F-actin (Fig. 3D). Quantitation of the immunoblot bands from four separate experiments revealed a 20% decrease (P < 0.005) in F-actin in chronic insulin-treated vs. control cells. As demonstrated in Fig. 2E, neither chronic nor acute insulin treatments altered total cellular actin. Together, these data demonstrate a hyperinsulinemia-induced reduction of cortical F-actin.
Fig. 3.

Disrupted cortical filamentous actin (F-actin) and phosphatidylinositol 4,5-bisphosphate (PIP2) in cells exposed to chronic insulin. Images are of cells subjected to immunofluorescent labeling of cortical F-actin (A), phalloidin-stained F-actin (C), or plasma membrane sheets subjected to PIP2 labeling (E). Quantification of cortical F-actin by digital image analysis (B) and biochemical fractionation (D), and quantification of plasma membrane PIP2 (F) are presented as means ± SE (3–4 experiments). *P < 0.02 vs. control.
Because this F-actin structure is under phosphoinositide regulation (10, 19), we next evaluated whether PIP2, the phosphoinositide derivative that stimulates actin polymerization and establishes plasma membrane-cytoskeletal linkages, was associated with the observed loss of F-actin structure in insulin-resistant L6 myotubes. Immunofluorescent labeling of PIP2 in isolated L6 plasma membrane sheets revealed a 16% decrease (P < 0.02) in this lipid under insulin-resistant condition (Fig. 3, E and F). By using an established PIP2 add-back procedure, whereby this lipid is complexed to a histone carrier and allowed to passively diffuse into the cell membrane (32), we were able to dose-dependently restore plasma membrane PIP2 following sustained insulin exposure (Fig. 4A). Complete restoration of PIP2 was apparent with a PIP2 add-back concentration of 1.25 μM. Thus we used this concentration of exogenous PIP2 to directly test whether the impaired cortical F-actin and insulin action occurred as a result of the hyperinsulinemia-associated PIP2 loss. Analysis of cortical F-actin showed that this PIP2 manipulation restored the mesh of actin beneath the plasma membrane (Fig. 4B). Concomitantly, exogenous PIP2 increased insulin sensitivity in hyperinsulinemic cells, as evidenced by a level of insulin-stimulated GLUT4myc translocation equivalent to that in control cells (Fig. 4C). Paralleling the return of insulin-stimulated plasma membrane GLUT4myc in the hyperinsulinemic cells, insulin-stimulated glucose transport was indistinguishable (P = 0.20) from that in control insulin-sensitive cells (Fig. 4D).
Fig. 4.
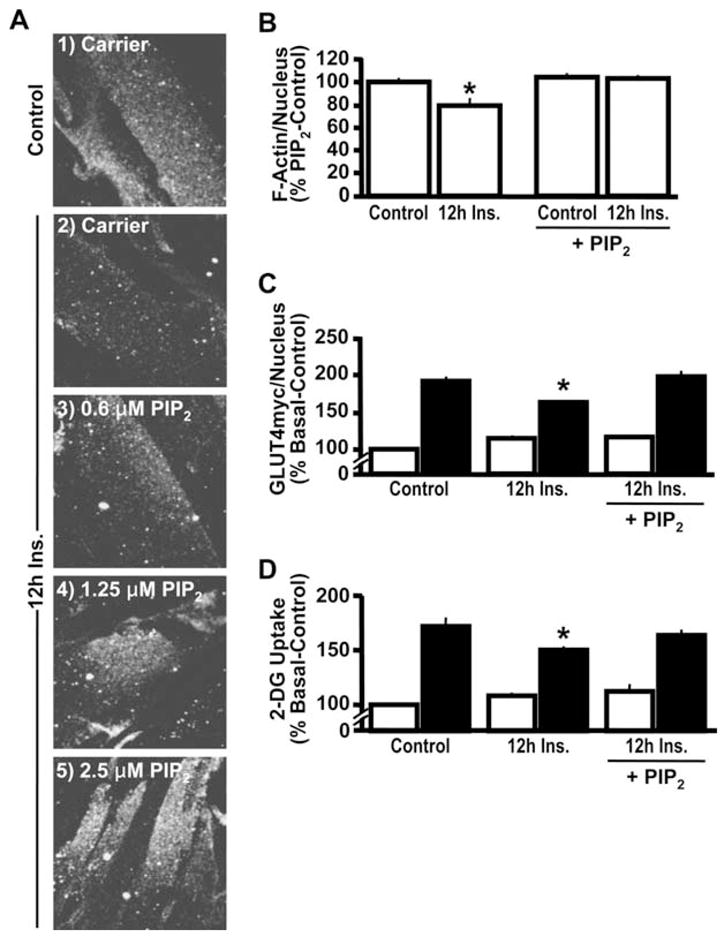
PIP2 replenishment restores PIP2, F-actin, and insulin sensitivity decreased by chronic insulin. After 12-h insulin exposure, either histone H1 (Carrier; panels 1 and 2) or PIP2/histone H1 (PIP2; panels 3–5) was added to the medium for 50 min. Membrane PIP2 (A), cortical F-actin digital image analysis quantification (B), GLUT4myc/nucleus quantification (C), and hexose transport (D). Images and means ± SE are from at least 3 experiments. *P < 0.02 vs. control (B) or control-20′ Ins (C and D).
Cytoskeletal abnormalities occur in the euglycemic/hyper-insulinemic “prediabetic” state
We next explored whether this insulin effect could explain the insulin-resistant state present in prediabetic individuals displaying normal glycemia, but hyperinsulinemia. As the inclusion of 5 nM insulin in control medium (25 mM glucose) induced defects in insulin action and PIP2/actin structure (Figs. 1–4), the same experiments performed with low glucose containing medium (5.5 mM) demonstrated similar insulin-induced defects in glucose transport (Fig. 5A), GLUT4myc translocation (Fig. 5B), cortical F-actin diminishment (Fig. 5C), and PIP2 loss (Fig. 5D). These findings are consistent with the concept that the insulin-induced insulin resistance is independent of glucose load and thus reveal a cellular defect that may significantly contribute to the worsening and progression of insulin resistance in prediabetes. Overall, data from these cell culture analyses implied that the hyperinsulinemic state would be associated with a detectable loss of cortical F-actin in isolated skeletal muscle from the Zucker fatty (fa/fa) rats. This animal model possesses a leptin receptor mutation (fa/fa) that renders the animal hyperphagic, obese, and insulin resistant (33). Young rats of this strain (6 to 8 wk old) also display an emergence of hyperinsulinemia that is not accompanied by hyperglycemia.
Fig. 5.

Chronic insulin stimulation induces similar PIP2, cortical F-actin, and insulin action defects in cells cultured in 5.5 mM glucose. Treatments of 5.5 mM glucose-cultured L6 myotubes were conducted as described in Fig. 1. Subsequent acute insulin action was assessed by leaving cells untreated (open bars) or treated (solid bars) with 100 nM insulin for 20 min. Glucose transport (A) and GLUT4myc/nucleus quantification (B) means ± SE are from 5–6 experiments. Cortical F-actin (C) and membrane PIP2 images (D) shown are representative from 3 experiments. *P < 0.05 vs. control-20′ Ins.
Before evaluating cortical F-actin, we studied the molecular architecture of the epitrochlearis muscle by using confocal immunofluorescence microscopy. To locate the position of the cell surface sarcolemma and the transverse tubular (T tubule) membranes, we used a specific antibody against caveolin-3, because the caveolae formed by homomultimers of this protein are located both at the sarcolemma and within the T tubules, as we (7) and others (17) have previously documented. As shown in Fig. 6A, antibodies against caveolin-3 (green) decorate the sarcolemma and T tubule membrane, and antibodies to F-actin (red) highlight the subsarcolemma location of cortical F-actin as we have previously demonstrated (7). Consistent with an essential role of cortical F-actin in skeletal muscle insulin sensitivity, that work demonstrated that latrunculin B-induced F-actin disruption impairs insulin stimulated GLUT4 translocation and glucose transport in intact skeletal muscle. Utilizing isolated epitrochlearis skeletal muscle from obese and lean Zucker rats and the same actin-labeling procedure, we examined cortical F-actin structure. As shown in Fig. 6B, skeletal muscle from obese, insulin-resistant animals displayed a reduction in cortical F-actin staining compared with control animals. Digital quantitative analysis of the staining intensity in the whole muscle revealed a 16% decrease (P < 0.0001) (Fig. 6C), which was very comparable to the loss observed in cultured hyperinsulinemic cells (Fig. 3, B and D).
Fig. 6.
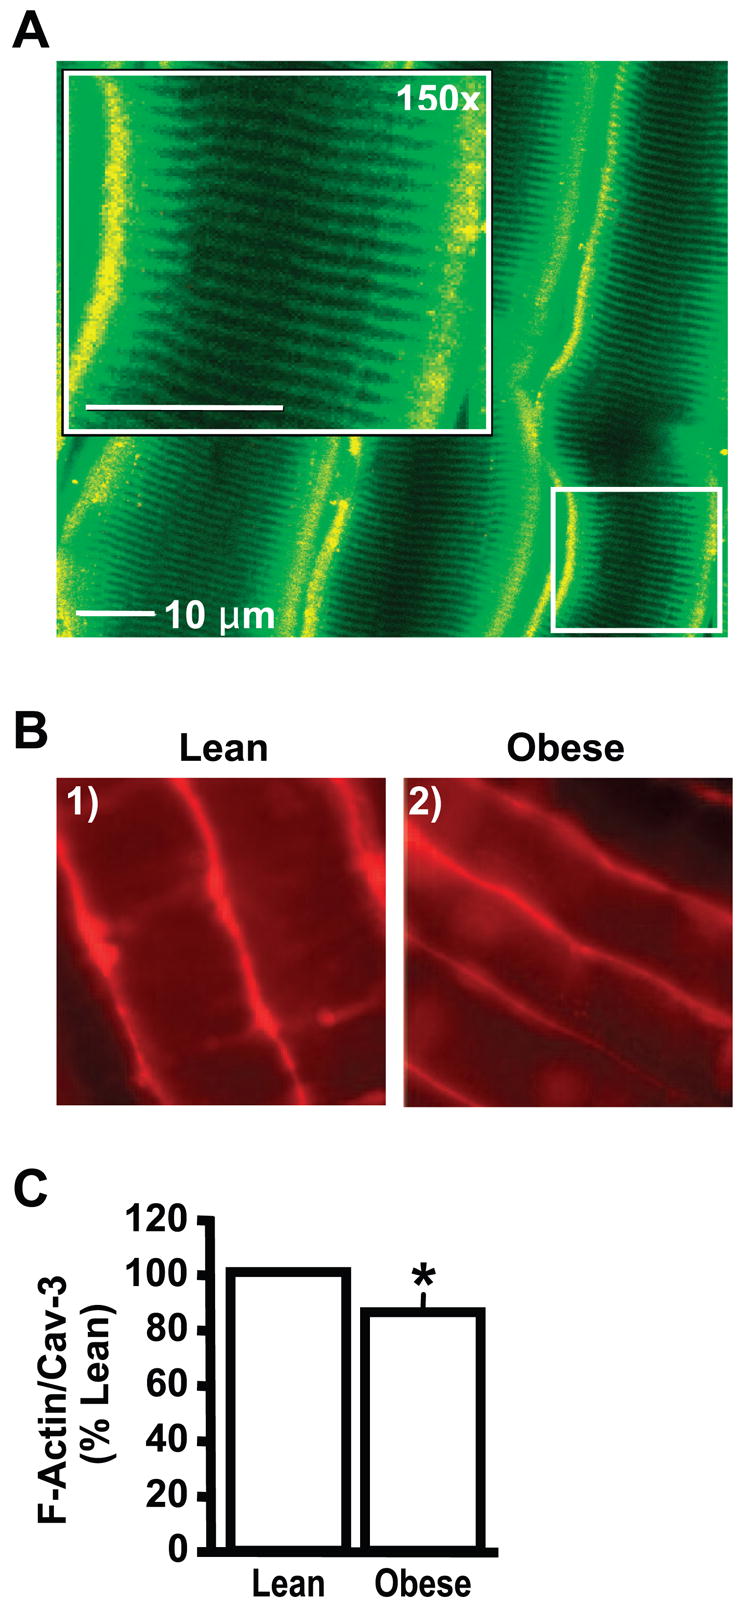
Diminished cortical F-actin in rat epitrochlearis skeletal muscle from obese insulin-resistant Zucker rats. Shown are representative images of rat epitrochlearis muscle labeled with antibodies against caveolin-3 (A; green) and cortical F-actin (A and B; red). Quantification of cortical F-actin (C) is presented as means ± SE from 3 experiments. *P < 0.0001 vs. lean rats.
DISCUSSION
Curtailing the predicted explosion of type 2 diabetes resulting from the enormously large and continually expanding prediabetic population is an important objective. Here, in vitro and in vivo analyses of skeletal muscle reveal that a reduction in cortical F-actin may play a part in the decline in insulin sensitivity. Mechanistically, the insulin-induced loss of this structure was associated with a significant reduction in insulin-stimulated GLUT4 translocation and glucose transport. Furthermore, PIP2 analyses showed that the cytoskeletal connection to insulin resistance was membrane based. These data unveil for the first time a skeletal muscle molecular defect that may be an important contributor to insulin resistance and ultimately to the diabetic condition.
Several studies (1, 2, 9, 49) provide clinical evidence that membrane and cytoskeletal defects occur in the prediabetic and diabetic states. As a deeper understanding of the role of membrane and cytoskeletal structure in insulin action emerges, studies to evaluate their involvement in the molecular pathogenesis of insulin resistance are providing considerable insight into this syndrome. It is clear that cytoskeletal mechanics play an essential role in the translocation of GLUT4 to the plasma membrane (6, 24, 31, 41, 42, 46). In particular, pharmacological disruption of cortical F-actin causes a profound disturbance in GLUT4 translocation and glucose transport (7, 14, 43). It is particularly important to note that recently collected in vivo data (7, 31) support cell culture findings and are consistent with the conclusion that the cellular cytoskeleton is involved in the translocation of GLUT4 to the plasma membrane. For example, Omata et al. (31) using primary adipocytes and our group (7) using isolated skeletal muscle demonstrated that a substantial loss of GLUT4 translocation and glucose transport occurred after cortical F-actin disruption in these tissues. These in vivo corollaries substantiate the use of cell models in our efforts to pinpoint molecular defects of insulin resistance. In direct support of our findings presented herein, the same experimental conditions impaired insulin action by a PIP2/actin-dependent mechanism in cultured 3T3-L1 adipocytes (11).
Evidence indicates that sustained insulin exposure in the presence of high glucose induces insulin resistance via promoting increased glucose flux into the hexosamine biosynthetic pathway (HBP) with accumulation of UDP-N-acetylglucosamine, which serves as an obligatory precursor for the synthesis of O-linked glycosyl side chains of proteins and lipids (30, 37). Given that chronic insulin treatment was equally effective in diminishing insulin sensitivity in cells incubated in the presence of low or high glucose, our data do not support this conclusion. Nonetheless, it remains possible that a sufficient intracellular glucose rise in cells maintained in low glucose could lead to glucose flux through the hexosamine biosynthesis pathway. This mechanism may contribute, at least in part, to the PIP2/actin-based defect. By examining the effect of glucosamine on PIP2/actin organization and the effect of HBP inhibition, we are currently testing this possibility. If studies implicate HBP involvement, this will be interesting given our previous work showing that endothelin-1-induced insulin resistance results from reversible changes in PIP2-regulated F-actin polymerization and not PIP2-dependent signaling (39). Endothelin-1, in the absence of insulin, can promote GLUT4 translocation and glucose transport (21, 48) and thus a common basis of the insulin resistance in hyperinsulinemic and hyperendothelinemic individuals may be glucose toxicity.
In summary, these data suggest that a contributing factor in the pathogenesis of insulin resistance in skeletal muscle, a major site of whole body glucose disposal and peripheral insulin resistance in diabetes (5, 12, 13), may be a deterioration of membrane and cytoskeletal structure. The present data indicate that insulin signaling is intact in L6 myotubes made insulin resistant by sustained insulin exposure. In agreement, a recent study (7) of isolated rat epitrochlearis muscle shows that depolymerization of cortical F-actin with latrunculin B induces insulin resistance in the absence of any signal transduction abnormalities. A striking finding of the present work was the weakened cortical F-actin structure in epitrochlearis muscle isolated from the insulin-resistant hyperinsulinemic Zucker fatty rat. Although the effect of its reduction on whole body glucose metabolism remains to be fully elucidated, both in vitro (11, 39, 40) and in vivo (7, 29) evidence are consistent with this cytoskeletal abnormality contributing to the disease. The PIP2 reversal studies seem to highlight the correctable nature of the defect. Thus study to dissect its precise mechanism of action is of high merit as we seek therapeutic interventions that will be particularly important to the growing numbers of insulin-resistant individuals worldwide.
Acknowledgments
We are grateful to Drs. Amira Klip and Steve Waters for generously providing the GLUT4myc-expressing L6 myotubes and L6 myotube protocols, to Dr. Morris Birnbaum for supplying the anti-Akt-2 antibody, to Dr. Simon Atkinson for methodological advice concerning actin labeling, and to Dr. Andrew Strawbridge for assistance in confocal microscopy.
GRANTS
This work was supported in part by a National Center for Complementary and Alternative Medicine Grant R01-AT001846 (to J. S. Elmendorf), an American Diabetes Association Research Award 07-05-RA-37 (to J. S. El-mendorf), and an American Heart Association Predoctoral Fellowship 0615574Z (to A. M. McCarthy).
References
- 1.Advani A, Marshall SM, Thomas TH. Impaired neutrophil actin assembly causes persistent CD11b expression and reduced primary granule exocytosis in Type II diabetes. Diabetologia. 2002;45:719–727. doi: 10.1007/s00125-002-0802-0. [DOI] [PubMed] [Google Scholar]
- 2.Advani A, Marshall SM, Thomas TH. Increasing neutrophil F-actin corrects CD11b exposure in Type 2 diabetes. Eur J Clin Invest. 2004;34:358–364. doi: 10.1111/j.1365-2362.2004.01346.x. [DOI] [PubMed] [Google Scholar]
- 3.Asahi Y, Hayashi H, Wang L, Ebina Y. Fluoromicroscopic detection of myc-tagged GLUT4 on the cell surface. Co-localization of the translocated GLUT4 with rearranged actin by insulin treatment in CHO cells and L6 myotubes. J Med Invest. 1999;46:192–199. [PubMed] [Google Scholar]
- 4.Bae SS, Cho H, Mu J, Birnbaum MJ. Isoform-specific regulation of insulin-dependent glucose uptake by Akt/protein kinase B. J Biol Chem. 2003;278:49530–49536. doi: 10.1074/jbc.M306782200. [DOI] [PubMed] [Google Scholar]
- 5.Baron AD, Brechtel G, Wallace P, Edelman SV. Rates and tissue sites of non-insulin- and insulin-mediated glucose uptake in humans. Am J Physiol Endocrinol Metab. 1988;255:E769–E774. doi: 10.1152/ajpendo.1988.255.6.E769. [DOI] [PubMed] [Google Scholar]
- 6.Bose A, Cherniack AD, Langille SE, Nicoloro SM, Buxton JM, Park JG, Chawla A, Czech MP. G(alpha)11 signaling through ARF6 regulates F-actin mobilization and GLUT4 glucose transporter translocation to the plasma membrane. Mol Cell Biol. 2001;21:5262–5275. doi: 10.1128/MCB.21.15.5262-5275.2001. [DOI] [PMC free article] [PubMed] [Google Scholar]
- 7.Brozinick JT, Jr, Hawkins ED, Strawbridge AB, Elmendorf JS. Disruption of cortical actin in skeletal muscle demonstrates an essential role of the cytoskeleton in glucose transporter 4 translocation in insulin-sensitive tissues. J Biol Chem. 2004;279:40699–40706. doi: 10.1074/jbc.M402697200. [DOI] [PMC free article] [PubMed] [Google Scholar]
- 8.Brozinick JT, Jr, Roberts BR, Dohm GL. Defective signaling through Akt-2 and -3 but not Akt-1 in insulin-resistant human skeletal muscle: potential role in insulin resistance. Diabetes. 2003;52:935–941. doi: 10.2337/diabetes.52.4.935. [DOI] [PubMed] [Google Scholar]
- 9.Candiloros H, Zeghari N, Ziegler O, Donner M, Drouin P. Hyperinsulinemia is related to erythrocyte phospholipid composition and membrane fluidity changes in obese nondiabetic women. J Clin Endocrinol Metab. 1996;81:2912–2918. doi: 10.1210/jcem.81.8.8768851. [DOI] [PubMed] [Google Scholar]
- 10.Chen F, Ma L, Parrini MC, Mao X, Lopez M, Wu C, Marks PW, Davidson L, Kwiatkowski DJ, Kirchhausen T, Orkin SH, Rosen FS, Mayer BJ, Kirschner MW, Alt FW. Cdc42 is required for PIP(2)-induced actin polymerization and early development but not for cell viability. Curr Biol. 2000;10:758–765. doi: 10.1016/s0960-9822(00)00571-6. [DOI] [PubMed] [Google Scholar]
- 11.Chen G, Raman P, Bhonagiri P, Strawbridge AB, Pattar GR, Elmendorf JS. Protective effect of phosphatidylinositol 4,5-bisphosphate against cortical filamentous actin loss and insulin resistance induced by sustained exposure of 3T3-L1 adipocytes to insulin. J Biol Chem. 2004;279:39705–39709. doi: 10.1074/jbc.C400171200. [DOI] [PMC free article] [PubMed] [Google Scholar]
- 12.DeFronzo RA, Gunnarsson R, Bjorkman O, Olsson M, Wahren J. Effects of insulin on peripheral and splanchnic glucose metabolism in noninsulin-dependent (type II) diabetes mellitus. J Clin Invest. 1985;76:149–155. doi: 10.1172/JCI111938. [DOI] [PMC free article] [PubMed] [Google Scholar]
- 13.DeFronzo RA, Jacot E, Jequier E, Maeder E, Wahren J, Felber JP. The effect of insulin on the disposal of intravenous glucose. Results from indirect calorimetry and hepatic and femoral venous catheterization. Diabetes. 1981;30:1000–1007. doi: 10.2337/diab.30.12.1000. [DOI] [PubMed] [Google Scholar]
- 14.Emoto M, Langille SE, Czech MP. A role for kinesin in insulin-stimulated GLUT4 glucose transporter translocation in 3T3–L1 adipocytes. J Biol Chem. 2001;276:10677–10682. doi: 10.1074/jbc.M010785200. [DOI] [PubMed] [Google Scholar]
- 15.Ferrannini E, Haffner SM, Mitchell BD, Stern MP. Hyperinsulinaemia: the key feature of a cardiovascular and metabolic syndrome. Diabetologia. 1991;34:416–422. doi: 10.1007/BF00403180. [DOI] [PubMed] [Google Scholar]
- 16.Ferrannini E, Smith JD, Cobelli C, Toffolo G, Pilo A, DeFronzo RA. Effect of insulin on the distribution and disposition of glucose in man. J Clin Invest. 1985;76:357–364. doi: 10.1172/JCI111969. [DOI] [PMC free article] [PubMed] [Google Scholar]
- 17.Gabella G. Inpocketings of the cell membrane (caveolae) in the rat myocardium. J Ultrastruct Res. 1978;65:135–147. doi: 10.1016/s0022-5320(78)90051-5. [DOI] [PubMed] [Google Scholar]
- 18.Guilherme A, Emoto M, Buxton JM, Bose S, Sabini R, Theurkauf WE, Leszyk J, Czech MP. Perinuclear localization and insulin responsiveness of GLUT4 requires cytoskeletal integrity in 3T3–L1 adipocytes. J Biol Chem. 2000;275:38151–38159. doi: 10.1074/jbc.M003432200. [DOI] [PubMed] [Google Scholar]
- 19.Hilpela P, Vartiainen MK, Lappalainen P. Regulation of the actin cytoskeleton by PI(4,5)P2 and PI(3,4,5)P3. Curr Top Microbiol Immunol. 2004;282:117–163. doi: 10.1007/978-3-642-18805-3_5. [DOI] [PubMed] [Google Scholar]
- 20.Huang C, Somwar R, Patel N, Niu W, Torok D, Klip A. Sustained exposure of L6 myotubes to high glucose and insulin decreases insulin-stimulated GLUT4 translocation but upregulates GLUT4 activity. Diabetes. 2002;51:2090–2098. doi: 10.2337/diabetes.51.7.2090. [DOI] [PubMed] [Google Scholar]
- 21.Imamura T, Ishibashi K, Dalle S, Ugi S, Olefsky JM. Endothelin-1-induced GLUT4 translocation is mediated via Gα (q/11) protein and phosphatidylinositol 3-kinase in 3T3–L1 adipocytes. J Biol Chem. 1999;274:33691–33695. doi: 10.1074/jbc.274.47.33691. [DOI] [PubMed] [Google Scholar]
- 22.Kanai F, Nishioka Y, Hayashi H, Kamohara S, Todaka M, Ebina Y. Direct demonstration of insulin-induced GLUT4 translocation to the surface of intact cells by insertion of a c-myc epitope into an exofacial GLUT4 domain. J Biol Chem. 1993;268:14523–14526. [PubMed] [Google Scholar]
- 23.Kane S, Sano H, Liu SC, Asara JM, Lane WS, Garner CC, Lienhard GE. A method to identify serine kinase substrates. Akt phosphorylates a novel adipocyte protein with a Rab GTPase-activating protein (GAP) domain. J Biol Chem. 2002;277:22115–22118. doi: 10.1074/jbc.C200198200. [DOI] [PubMed] [Google Scholar]
- 24.Kanzaki M, Watson RT, Hou JC, Stamnes M, Saltiel AR, Pessin JE. Small GTP-binding protein TC10 differentially regulates two distinct populations of filamentous actin in 3T3L1 adipocytes. Mol Biol Cell. 2002;13:2334–2346. doi: 10.1091/mbc.01-10-0490. [DOI] [PMC free article] [PubMed] [Google Scholar]
- 25.Khayat ZA, Tsakiridis T, Ueyama A, Somwar R, Ebina Y, Klip A. Rapid stimulation of glucose transport by mitochondrial uncoupling depends in part on cytosolic Ca2+ and cPKC. Am J Physiol Cell Physiol. 1998;275:C1487–C1497. doi: 10.1152/ajpcell.1998.275.6.C1487. [DOI] [PubMed] [Google Scholar]
- 26.Koopmans SJ, Ohman L, Haywood JR, Mandarino LJ, DeFronzo RA. Seven days of euglycemic hyperinsulinemia induces insulin resistance for glucose metabolism but not hypertension, elevated catecholamine levels, or increased sodium retention in conscious normal rats. Diabetes. 1997;46:1572–1578. doi: 10.2337/diacare.46.10.1572. [DOI] [PubMed] [Google Scholar]
- 27.Kralik SF, Liu P, Leffler BJ, Elmendorf JS. Ceramide and glucosamine antagonism of alternate signaling pathways regulating insulin- and osmotic shock-induced glucose transporter 4 translocation. Endocrinology. 2002;143:37–46. doi: 10.1210/endo.143.1.8606. [DOI] [PubMed] [Google Scholar]
- 28.Krook A, Bjornholm M, Galuska D, Jiang XJ, Fahlman R, Myers MG, Jr, Wallberg-Henriksson H, Zierath JR. Characterization of signal transduction and glucose transport in skeletal muscle from type 2 diabetic patients. Diabetes. 2000;49:284–292. doi: 10.2337/diabetes.49.2.284. [DOI] [PubMed] [Google Scholar]
- 29.Mulvey C, Harno E, Keenan A, Ohlendieck K. Expression of the skeletal muscle dystrophin-dystroglycan complex and syntrophin-nitric oxide synthase complex is severely affected in the type 2 diabetic Goto-Kakizaki rat. Eur J Cell Biol. 2005;84:867–883. doi: 10.1016/j.ejcb.2005.06.007. [DOI] [PubMed] [Google Scholar]
- 30.Nelson BA, Robinson KA, Buse MG. High glucose and glucosamine induce insulin resistance via different mechanisms in 3T3-L1 adipocytes. Diabetes. 2000;49:981–991. doi: 10.2337/diabetes.49.6.981. [DOI] [PubMed] [Google Scholar]
- 31.Omata W, Shibata H, Li L, Takata K, Kojima I. Actin filaments play a critical role in insulin-induced exocytotic recruitment but not in endocytosis of GLUT4 in isolated rat adipocytes. Biochem J. 2000;346:321–328. [PMC free article] [PubMed] [Google Scholar]
- 32.Ozaki S, DeWald DB, Shope JC, Chen J, Prestwich GD. Intracellular delivery of phosphoinositides and inositol phosphates using poly-amine carriers. Proc Natl Acad Sci USA. 2000;97:11286–11291. doi: 10.1073/pnas.210197897. [DOI] [PMC free article] [PubMed] [Google Scholar]
- 33.Phillips MS, Liu Q, Hammond HA, Dugan V, Hey PJ, Caskey CJ, Hess JF. Leptin receptor missense mutation in the fatty Zucker rat. Nat Genet. 1996;13:18–19. doi: 10.1038/ng0596-18. [DOI] [PubMed] [Google Scholar]
- 34.Pirola L, Bonnafous S, Johnston AM, Chaussade C, Portis F, Van Obberghen E. Phosphoinositide 3-kinase-mediated reduction of insulin receptor substrate-1/2 protein expression via different mechanisms contributes to the insulin-induced desensitization of its signaling pathways in L6 muscle cells. J Biol Chem. 2003;278:15641–15651. doi: 10.1074/jbc.M208984200. [DOI] [PubMed] [Google Scholar]
- 35.Razidlo GL, Kortum RL, Haferbier JL, Lewis RE. Phosphorylation regulates KSR1 stability, ERK activation, and cell proliferation. J Biol Chem. 2004;279:47808–47814. doi: 10.1074/jbc.M406395200. [DOI] [PubMed] [Google Scholar]
- 36.Ricort JM, Tanti JF, Van Obberghen E, Le Marchand-Brustel Y. Alterations in insulin signalling pathway induced by prolonged insulin treatment of 3T3-L1 adipocytes. Diabetologia. 1995;38:1148–1156. doi: 10.1007/BF00422363. [DOI] [PubMed] [Google Scholar]
- 37.Ross SA, Chen X, Hope HR, Sun S, McMahon EG, Broschat K, Gulve EA. Development and comparison of two 3T3–L1 adipocyte models of insulin resistance: increased glucose flux vs glucosamine treatment. Biochem Biophys Res Commun. 2000;273:1033–1041. doi: 10.1006/bbrc.2000.3082. [DOI] [PubMed] [Google Scholar]
- 38.Sano H, Kane S, Sano E, Miinea CP, Asara JM, Lane WS, Garner CW, Lienhard GE. Insulin-stimulated phosphorylation of a Rab GTPase-activating protein regulates GLUT4 translocation. J Biol Chem. 2003;278:14599–14602. doi: 10.1074/jbc.C300063200. [DOI] [PubMed] [Google Scholar]
- 39.Strawbridge AB, Elmendorf JS. Phosphatidylinositol 4,5-bisphosphate reverses endothelin-1-induced insulin resistance via an actin-dependent mechanism. Diabetes. 2005;54:1698–1705. doi: 10.2337/diabetes.54.6.1698. [DOI] [PMC free article] [PubMed] [Google Scholar]
- 40.Tong P, Khayat ZA, Huang C, Patel N, Ueyama A, Klip A. Insulin-induced cortical actin remodeling promotes GLUT4 insertion at muscle cell membrane ruffles. J Clin Invest. 2001;108:371–381. doi: 10.1172/JCI12348. [DOI] [PMC free article] [PubMed] [Google Scholar]
- 41.Torok D, Patel N, Jebailey L, Thong FS, Randhawa VK, Klip A, Rudich A. Insulin but not PDGF relies on actin remodeling and on VAMP2 for GLUT4 translocation in myoblasts. J Cell Sci. 2004;117:5447–5455. doi: 10.1242/jcs.01421. [DOI] [PubMed] [Google Scholar]
- 42.Tsakiridis T, Bergman A, Somwar R, Taha C, Aktories K, Cruz TF, Klip A, Downey GP. Actin filaments facilitate insulin activation of the src and collagen homologous/mitogen-activated protein kinase pathway leading to DNA synthesis and c-fos expression. J Biol Chem. 1998;273:28322–28331. doi: 10.1074/jbc.273.43.28322. [DOI] [PubMed] [Google Scholar]
- 43.Tsakiridis T, Vranic M, Klip A. Disassembly of the actin network inhibits insulin-dependent stimulation of glucose transport and prevents recruitment of glucose transporters to the plasma membrane. J Biol Chem. 1994;269:29934–29942. [PubMed] [Google Scholar]
- 44.Ueyama A, Yaworsky KL, Wang Q, Ebina Y, Klip A. GLUT-4myc ectopic expression in L6 myoblasts generates a GLUT-4-specific pool conferring insulin sensitivity. Am J Physiol Endocrinol Metab. 1999;277:E572–E578. doi: 10.1152/ajpendo.1999.277.3.E572. [DOI] [PubMed] [Google Scholar]
- 45.Walker PS, Ramlal T, Sarabia V, Koivisto UM, Bilan PJ, Pessin JE, Klip A. Glucose transport activity in L6 muscle cells is regulated by the coordinate control of subcellular glucose transporter distribution, biosynthesis, and mRNA transcription. J Biol Chem. 1990;265:1516–1523. [PubMed] [Google Scholar]
- 46.Wang Q, Bilan PJ, Tsakiridis T, Hinek A, Klip A. Actin filaments participate in the relocalization of phosphatidylinositol 3-kinase to glucose transporter-containing compartments and in the stimulation of glucose uptake in 3T3–L1 adipocytes. Biochem J. 1998;331:917–928. doi: 10.1042/bj3310917. [DOI] [PMC free article] [PubMed] [Google Scholar]
- 47.Wong SK. A 384-well cell-based phospho-ERK assay for dopamine D2 and D3 receptors. Anal Biochem. 2004;333:265–272. doi: 10.1016/j.ab.2004.05.011. [DOI] [PubMed] [Google Scholar]
- 48.Wu-Wong JR, Berg CE, Wang J, Chiou WJ, Fissel B. Endothelin stimulates glucose uptake and GLUT4 translocation via activation of endothelin ETA receptor in 3T3–L1 adipocytes. J Biol Chem. 1999;274:8103–8110. doi: 10.1074/jbc.274.12.8103. [DOI] [PubMed] [Google Scholar]
- 49.Younsi M, Quilliot D, Al-Makdissy N, Delbachian I, Drouin P, Donner M, Ziegler O. Erythrocyte membrane phospholipid composition is related to hyperinsulinemia in obese nondiabetic women: effects of weight loss. Metabolism. 2002;51:1261–1268. doi: 10.1053/meta.2002.35184. [DOI] [PubMed] [Google Scholar]