I. INTRODUCTION
It is well established that children and adolescents with developmental disabilities have high rates of psychopathology (Einfeld & Tonge, 1996a,b; Rutter, Tizard, & Whitmore, 1970). Despite this, little research has been done to examine the course and development of psychopathology in this population over time. Longitudinal studies are essential in order to understand fully the nature and course of a problem, to examine risk and protective factors in the development or amelioration of pathology, and to thus inform the development of preventative and intervention programs. To date, only six studies have examined psychopathology in children and adolescents with mental retardation (MR) longitudinally.
The first of these studies revisited a birth cohort of children born in the 1950s in Aberdeen, Scotland when they were 22 years of age (Richardson & Koller, 1996). In a sample of 221, it was found that 65% of those who had behavioral disturbance as children continued to have behavioral problems in young adulthood. Thirty-nine percent of males had behavioral disturbance in childhood, and in adulthood this had decreased slightly to 34%. However, in females behavioral disturbance increased slightly from childhood to young adulthood (35-42%). For the females, the level of emotional problems increased from childhood to young adulthood, with the exception of those in the mild range of MR. In childhood, antisocial behavior problems were found to be 3-5 times higher in males than in females, a finding which persisted into adulthood. In males, the frequency of antisocial behavior problems also increased with increasing IQ. Although the study was the first to demonstrate that the high rates of psychopathology in children with MR persisted from childhood to young adulthood, there were very few subjects with moderate or severe MR, thus limiting any conclusions that could be drawn regarding this group.
Chess (1977) reviewed 44 children (5-12 years of age) with mild MR 6 years after initial assessment. At Time 1, 60% of the sample received a diagnosis of a psychiatric disorder, while at Time 2, 41% received a diagnosis. Although there was a decrease in the percentage of children diagnosed, the small sample size limits the conclusions that can be drawn from this study.
Quine and Pahl (1989) reassessed 166 children 4 years after initial assessment. Of those who were classified as having “behavior problems” at Time 1, 76% still met this criterion at Time 2. Overactivity was the only behavior problem which decreased from Time 1 to Time 2. A study conducted in the United States (Alabama) examined psychopathology in a predominantly African-American population of 237 adolescents (13-16 years of age) with mild MR (Wallander, Frison, & Rydvalova, 2001). Risk for psychopathology in African-American adolescents with mild intellectual disability was investigated. The adolescents were assessed annually at three time points. High rates of psychopathology were reported, which were stable over time. Similar results were reported in a Dutch study which surveyed 968 children aged 6-18 years, with mild-moderate levels of MR. Thus far, 1 year follow-up has demonstrated persistently high levels of psychopathology, with 71% of those who met criteria for clinical caseness still meeting criteria 1 year later (Wallander, Dekker, & Koot, 2003).
Chadwick, Kusel, Cuddy, and Taylor (2005) reassessed 82 children with severe intellectual disability 5 years later when they were adolescent. They found little difference in rates of behavior problems between the two assessment occasions, apart from overactivity which declined significantly.
II. THE AUSTRALIAN CHILD TO ADULT DEVELOPMENT (ACAD) STUDY
In 1989/1990, a comprehensive attempt was made to identify all young people aged 4-18 years with MR who lived in a number of census regions in the Australian states of New South Wales and Victoria (Einfeld & Tonge, 1996a). These regions were local government areas, which together represented a cross section of the Australian community, particularly for social class, mix of ethnic origin, and urban/rural distribution, which may be factors associated with psychopathology. The epidemiological cohort was recruited from all health, education, and family agencies that provide services to young people with MR of all levels whose families lived in the selected census districts. Children who were not living with their parents but were in institutional or small group care were included provided their parent lived within one of the census regions. These criteria ensured the inclusion of institutionalized children who tend to have a higher level of behavior disturbance (Einfeld & Tonge, 1992). Registration with regional Disability Services provided the mechanism for the provision of state-funded services for young people and their families. Since those with IQ less than 50 (moderate to severe or profound MR) virtually always require some health, education, or welfare service, this longitudinal study was likely to have achieved a virtually complete ascertainment of this population in Australia (Einfeld & Tonge, 1996a).
Consistent with other studies, some young people with mild MR blend in with the general population and do not receive any specific health, education, or welfare services. Therefore, the young people included in this study with mild MR are likely to be biased toward the lower end of the mild MR range or have medical conditions associated with MR, such as epilepsy and cerebral palsy (Einfeld & Tonge, 1992, 1996a), and/or have emotional or behavioral problems that bring them into contact with services. Therefore, the sample is likely to be representative of young people with moderate or more severe levels of MR, but is only representative of those with mild MR who have some reason to receive health, education, or welfare services for persons with MR.
The longitudinal study also recruited separate cohorts of young people with MR aged 4-18 years who had Fragile X (FraX) syndrome, Williams syndrome (WS), and Prader-Willi syndrome (PWS). These groups were recruited in New South Wales from specialist genetics clinics and parents’ support associations, but not from services for children with behavioral disturbance. There was also a group of young people with Down syndrome (DS) identified within the epidemiological cohort. Another group of young people diagnosed with Autistic Disorder according to DSM-IV criteria (American Psychiatric Association, 1994) were also included in the longitudinal study. These young people were all identified through regional autism assessment services and are likely to be representative of all children in the community who are assessed to have this condition and receive health, education, and welfare services.
The participation rate of all the young people with MR identified in the census areas was 80.2%. Further descriptions of the cohort and the evidence for its epidemiological validity have been reported previously (Einfeld and Tonge, 1996a).
III. METHODS
The study has gathered data on a broad range of potential biopsychosocial risk and protective variables including causes of MR, and measures of life events, parental mental health, and family functioning in 1991/1992 (Time 1), 1996/1997 (Time 2), 1999/2000 (Time 3), and 2003/2004 (Time 4). The major measure of psychopathology was the Developmental Behaviour Checklist (DBC; Einfeld & Tonge, 1992). The DBC has 96 items completed by the parents or other primary carers reporting problems with emotions or behavior over a 6-month period. The instrument has high interrater reliability between parents (ICC = .80), nurses (ICC = .83), and between teachers and teachers’ aides (ICC = .60). Test retest reliability (ICC = .83) and internal consistency are high (Cronbach’s alpha = 0.94). The DBC has five factor analytically derived subscales (Disruptive/Antisocial, Self-absorbed, Communication Disturbance, Anxiety, and Social Relating). Content, criterion, construct and/or concurrent validity have been demonstrated for the total score and the subscales. The total behavior problem score (TBPS) on the DBC correlates with child psychiatrist’s rating of severity of psychopathology using Rutter’s (Cox & Rutter, 1985) definition (r = 0.81, p < .001). The instrument has high criterion group validity in distinguishing psychiatric cases from noncases (t = 7.8, p < .001). The Receiver Operating Characteristics (ROC) of the DBC were examined in 70 individuals for whom checklists were completed and who were also assessed by 2 of 3 child psychiatrists and 1 experienced clinical psychologist with an overall rating of severity of psychopathology. The area under the ROC curve was 92%, indicating that the DBC provides a cut-off with high specificity and sensitivity.
The DBC depression scale (Einfeld & Tonge, 2002) is based on 10 items from the DBC with a total possible score of 20. The scale has face validity for depression and includes the items “Appears depressed, downcast or unhappy,” “Irritable,” and “Cries easily for no reason, or over small upsets.” The DBC attention deficit hyperactivity (ADHD) score (Einfeld & Tonge, 2002) is a six item scale, derived from items in the DBC. Items include “Becomes overexcited,” “Impulsive, acts before thinking,” and “Cannot attend to one activity for any length of time, poor attention span.” Increased intensity of ADHD symptoms is reflected by a higher total score on the six items. High internal consistency (Cronbach’s alpha = 0.88) and construct validity of the scale has been established. For a more detailed description of this measure, see Einfeld and Tonge (1995).
For the purposes of studying the possible effects of level of MR on behavior, we assigned each child to a mild, moderate, severe, or profound level of MR using DSM-IV degree of severity of MR criteria IQ score ranges. As part of the data we gathered from families, we obtained adaptive behavior information on social competence, type of school or work place attendance, type and range of social networks, recreational interests and participation, daily living skills, and language and communication ability, which further informed our assignment to MR range. The level of MR was evaluated by viewing the reports of individual IQ assessments undertaken in the past 3 years. The cognitive assessments had been done by registered psychologists, who were employed by the various MR services agencies. When the reports were not available or out of date, level of MR was assessed by psychometric tests such as the WISC-III (Wechsler, 1981) or Stanford-Binet (Terman & Merrill, 1960). It is possible that subjects in the upper range of MR theoretically may not meet the adaptive behavior criterion (criterion B) of the DSM-IV definition, despite the fact that they qualified for services. Nevertheless there are only 29 subjects in this upper mild range in the epidemiological cohort of 574. Any effect on prevalence rates caused by inclusion of these subjects would be minimal.
The success of this longitudinal study is dependent on the ongoing participation of the young people and their families. Considerable effort has been expended to keep in touch with the families and track them if they move. The participation rate of Time 1 families at Time 2 was 91%, at Time 3 was 82%, and at Time 4 was 81%. This high rate and the lack of any significant demographic, age, sex, IQ level, or psychopathology score difference between participants and nonparticipants strengthens confidence in the representativeness of the study findings.
In this chapter, we describe changes in some parameters of psychopathology over the 11-year period. We have selected some representative externalizing and internalizing behaviors of interest.
IV. DATA ANALYSIS
Longitudinal regressions of each of the DBC-based dependent variables on age of entry to the ACAD study, aging during the study (both in years), gender (girl = 1, boy = 0), MR level (severe or profound = 1, mild or moderate = 0), whether the same respondent throughout completed the DBC-P or DBC-A (yes = 1, no = 0), group (epidemiological cohort or syndrome group), and interactions of group and gender with aging in the study were estimated using Stata version 9 (StataCorp, 2005). Of these independent variables, only aging during the study and interactions with it varied with time. The others are “between subject” variables. The reference group for each syndrome group was the epidemiological cohort except those identified as having the syndrome in question. This reference group included those with DS, except for regressions in which DS is an independent variable.
V. RESULTS
A. Age
Age summaries are presented in Table I.
TABLE I.
Age Summaries By Data Collection Time
| Time | n | Mean | SD |
|---|---|---|---|
| 1 | 834 | 12.0 | 5.3 |
| 2 | 694 | 16.3 | 5.2 |
| 3 | 670 | 19.2 | 5.4 |
| 4 | 652 | 23.0 | 5.3 |
B. Aging During the Study
624 participants present at data waves 1 and 4 had been in the study for an average of 11.2 years (SD. 97, minimum 7.6, maximum 13.6).
C. Gender
The overall proportion of girls for whom the DBC was completed remained between .37 and .38 during Times 1-4. It was lower than this for the groups with autism (.18-.19) and FraX (.16-.20), about the same for PWS (.34-.39), and higher for WS (.46-.49) and DS (.57-.59).
D. MR Level
The overall proportion of young people with severe or profound MR (as opposed to mild or moderate MR) for whom the DBC was completed remained between .18 and .20 during Times 1-4. It was higher than this in the non-DS epidemiological cohort (.28-.29), but lower in each of the syndrome groups: PWS (0), FraX (.02-.03), DS (.04-.06), WS (.07-.10), and autism (.13-.15).
E. Relationship to Respondent
The overall proportion of young people with no change in relationship to respondent for whom the DBC was completed remained between .69 and .73 during waves 1-4. It was higher for WS (.85-.88) and lower for PWS (.54-.63), but similar in other groups.
1. EXTERNALIZING PSYCHOPATHOLOGY
DBC “disruptive” subscale score
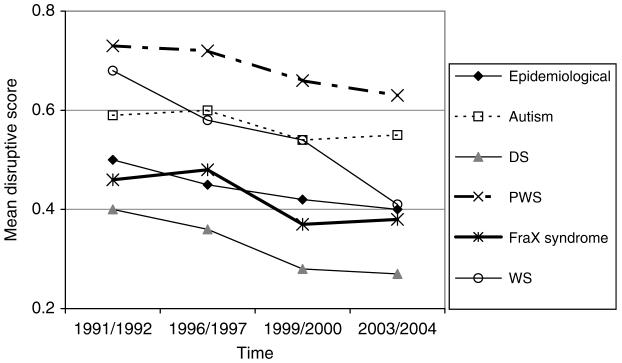
Here, to illustrate the type of analysis conducted, we show results using a figure Fig. 1, a table of means Table II, and a regression Table III. In the results following, in order to save space, we show a figure with means Figs. 2-9, and describe the significant results from the regression analysis.
FIG. 1.
DBC disruptive scores.
TABLE II.
Mean Disruptive Subscale Score
| Time | Epidemiological cohort | Autism | Fragile X (FraX) syndrome | Williams syndrome (WS) | Prader-Willi syndrome (PWS) | Down syndrome (DS) |
|---|---|---|---|---|---|---|
| 1 | 0.50 | 0.59 | 0.46 | 0.68 | 0.73 | 0.40 |
| 2 | 0.45 | 0.60 | 0.48 | 0.58 | 0.72 | 0.36 |
| 3 | 0.42 | 0.54 | 0.37 | 0.54 | 0.66 | 0.28 |
| 4 | 0.40 | 0.55 | 0.38 | 0.41 | 0.63 | 0.27 |
TABLE III.
Regression Table For Disruptive Subscale
| Epidemiological cohort (E) | Autism versus non-autism E | Down versus non-Down E | PWS versus non-PWS E | FraX versus non-FraX E | WS versus non-WS E | |
|---|---|---|---|---|---|---|
| Age at entry | -.002 | -.002 | -.002 | -.003 | -.003 | -.002 |
| Aging in study | -.011 | -.011 | -.011 | -.011 | -.012 | -.011 |
| Girl | -.005 | .001 | .011 | -.013 | -.004 | -.0005 |
| Girl*aging in study | .006 | .006 | .007 | .005 | .007 | .007 |
| Severe/profound MR | -.159 | -.148 | -.184 | -.155 | -.160 | -.148 |
| Same respondent relationship | .030 | .026 | .026 | .040 | .020 | .028 |
| Syndrome | .098 | -.184 | .230 | -.061 | .076 | |
| Syndrome*aging in study | .001 | -.005 | .001 | .006 | -.011 | |
| Const | .504 | .494 | .531 | .515 | .530 | .506 |
Typeface code for p-values: ns <.05 <.01 <.001.
Asterisk (*) indicates interation.
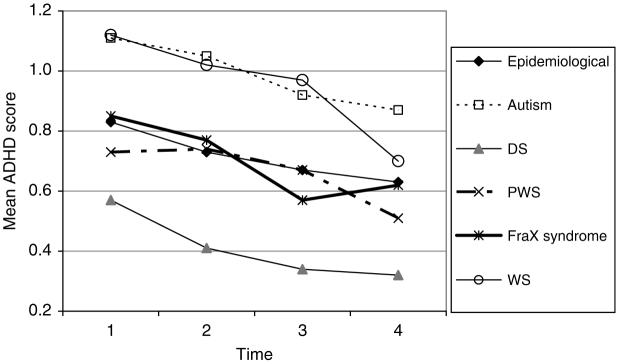
FIG. 2.
DBC ADHD scores.
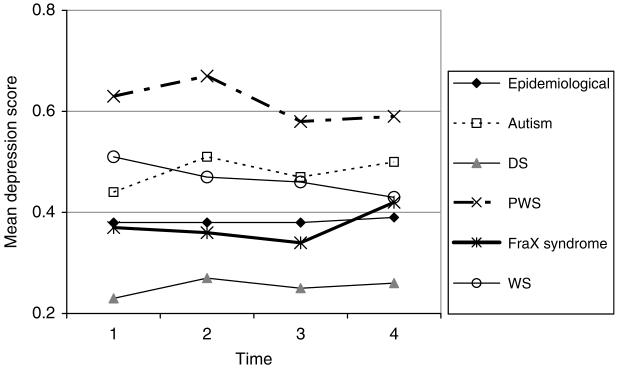
FIG. 9.
DBC depression score.
In this and subsequent descriptions of the results regarding aging in the study, we give the p-value for one of the three relevant coefficients where it is appropriate. Estimates relying on more than one of these coefficients are given without p-values.
The DBC disruptive subscale score:
declines slightly by about .01 (p < .001) for boys, by less than this (.003-.005) for girls with each year of aging in the study. For those with WS, the decline with aging is faster, by an extra .01 per year than for those in the non-WS epidemiological cohort
is not significantly different between girls and boys
is lower by about .15-.18 (p < .001) for those with severe or profound MR
is higher by .23 for PWS (p < .001) and by .10 for autism (p < .01), lower by .18 for DS (p < .001), than for those in the epidemiological cohort without the relevant syndrome.
DBC attention deficit hyperactivity scale
The mean DBC scores for the attention deficit hyperactivity scale are shown in Fig. 2.
The DBC attention deficit hyperactivity score:
is lower by about .01 per year of older age at entry to the study (p < .01)
declines by .02 (p < .001) per year of aging in the study for boys and by about .01 per year for girls. For WS, the ADHD score declines by .04 per year for boys and .03 per year for girls
is higher by .21 for both those with autism (p < .001) and with WS (p < .001), and lower by .36 for those with DS (p < .001) than for those in the epidemiological cohort without the relevant syndrome.
2. SOME DBC DISRUPTIVE SUBSCALE ITEMS
“Abusive” (abusive, swears at others)
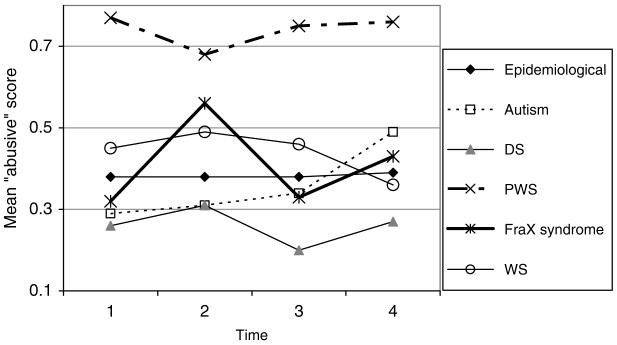
The mean DBC “abusive” scores are shown in Fig. 3.
FIG. 3.
DBC “abusive” score.
The DBC “abusive” item score:
is not related to aging for boys
increases slightly (by up to .01 per year) with aging for girls (p < .05, p < .01 for FraX versus epidemiological cohort without FraX, and not significant for autism versus epidemiological cohort without autism)
increases slightly with aging for those with autism (p < .05)
is low (practically zero) for those with severe or profound ID (p < .001)
is lower by .23 for DS (p < .001), higher by .29 for PWS (p < .001).
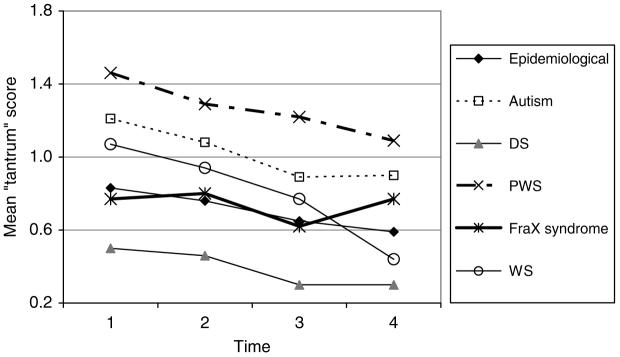
Tantrums (has temper tantrums, e.g., stamps feet, slams doors)
The mean DBC tantrum scores are shown in Fig. 4.
FIG. 4.
DBC “tantrum” scores.
The DBC “tantrums” item score:
declines with aging for boys in the study by .04 per year (p < .001), more slowly for girls (.01), faster in WS (.06 for boys, .03 for girls), and not so noticeably in FraX (decline of .015 for boys, increase of .014 for girls)
is low for those with severe or profound MR (p < .01)
is lower by .45 for DS (p < .001), higher by .31 for autism (p < .001), and higher by .54 for PWS (p < .001).
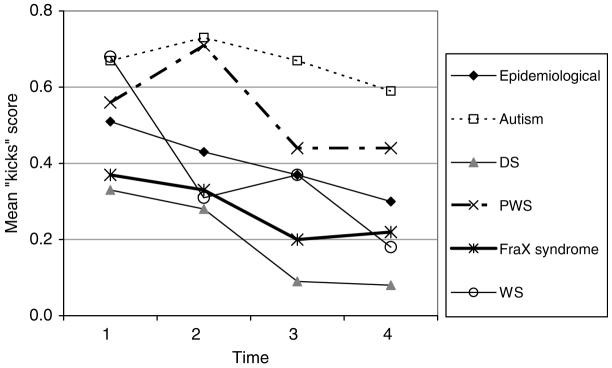
“Kicks” (kicks, hits others)
The mean DBC “Kick” scores are shown in Fig. 5.
FIG. 5.
DBC “kicks” score.
The DBC “kicks” item score:
declines with aging in the study (.02 per year) (p < .001), faster in WS (.04) (p < .05)
is lower by .26 for DS (p < .001), higher by .22 for autism (p < .001).
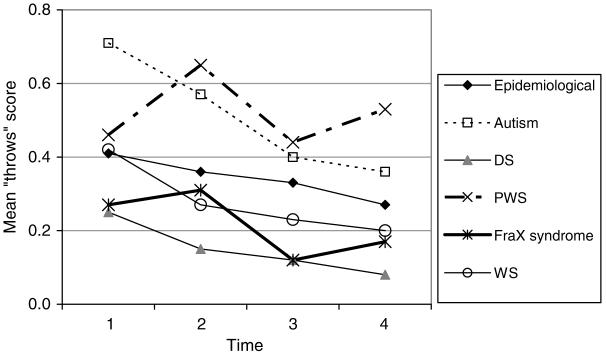
“Throws” (throws or breaks objects)
The mean DBC “throws” scores are shown in Fig. 6.
FIG. 6.
DBC “throws” scores.
The DBC “throws” item score:
is very slightly lower for those with older age at entry to the study (.01 per year) (p < .05)
declines with aging in the study for boys by .02 per year (p < .001) and hardly at all for girls, faster for those with autism (.05 per year for boys, .03 per year for girls)
is lower by .2 for DS (p < .001), higher by .17 for autism (p < .001), and higher by .23 for PWS (p < .01) than for those in the epidemiological cohort without the corresponding syndrome.
3. INTERNALIZING PSYCHOPATHOLOGY
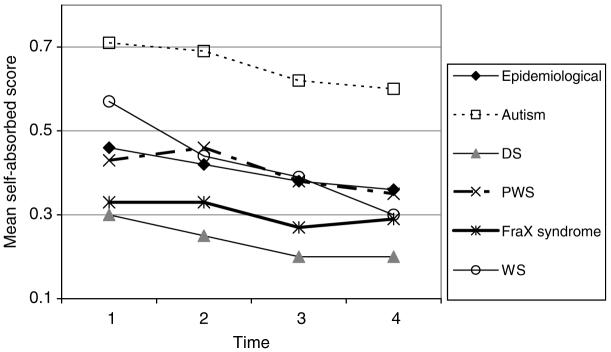
DBC self-absorbed scale
The mean DBC self-absorbed scores are shown in Fig. 7.
FIG. 7.
DBC self-absorbed scores.
The DBC self-absorbed behavior subscale score:
is slightly lowered by older age at entry to the study (by just under .01 per year older) (p < .001)
declines very slightly (by about .01) with each year of aging in the study (p < .001), except for those with FraX syndrome. The decline is slightly slower for girls (.008 per year, though not significantly except in the analyses of autism versus non-autistic epidemiological cohort and FraX versus non-FraX epidemiological cohort). For those with WS, the decline with aging is faster, by an extra .01 per year than for those in the epidemiological cohort without WS
is not significantly different between girls and boys (although girls have marginally lower means)
is higher by about .25-.28 for those with severe or profound MR (p < .001)
is higher by .25 for autism (p < .001), lower by .12 for DS (p < .001), than for those in the epidemiological cohort without these syndromes.
Anxiety
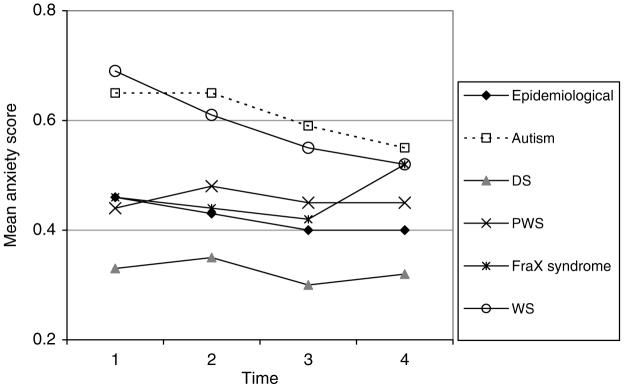
The mean DBC anxiety scores are shown in Fig. 8.
FIG. 8.
DBC anxiety score.
The DBC anxiety subscale score:
declines very slightly (by about .01) with each year of aging in the study for boys (p < .001), except for those with FraX syndrome. For those with WS, the decline with aging is faster, by an extra .01 per year than for those in the epidemiological cohort without WS. The rates of decline are slower (by .007-.008) for girls in all groups
is lower by about .06-.08 for those with severe or profound MR (p < .05)
is higher by .16 for autism (p < .001) and by .14 for WS (p < .001), lower by .14 for DS (p < .001), than for those in the epidemiological cohort without the corresponding syndrome.
Depression
The mean DBC depression scores are shown in Fig. 9.
The DBC depression scale score:
is higher by .06 for girls than for boys (p < .01)
remains virtually constant for boys, except in WS, as they age in the study and increases very slightly for girls (by .003-.005 per year), but this increase is significant (p < .05) only in the analyses of FraX and WS versus their corresponding reference groups. In WS, boys’ depression declines on average by .008 per year (p < .05)
is higher by .10 for autism (p < .001) and by .25 for PWS (p < .001), lower by .18 for DS (p < .001), than for those without the corresponding syndrome in the epidemiological cohort.
VI. DISCUSSION
A. Externalizing Behavior
Disruptive behavior was found to decline slowly with aging. At the public health level, this suggests that through the childhood and adolescent years, programs should address disruptive behavior, as well as the educational needs of children with MR. For families, there is a need to increase availability and establish effectiveness of a number of programs of demonstrated efficacy in treatment of disruptive behaviors in children and adolescents with MR. Such programs include those by Sanders, Mazzucchelli, and Studman (2003a,b) and Wacker et al. (1998). At the same time, the demands on services for behavioral supports should decrease somewhat for older persons.
There are limits to the extent to which one can generalize from group outcomes to prognosis for any given individual. Nevertheless, it should be of some legitimate reassurance for families to know that, at least in general, disruptive behavior declines with time. It is not surprising that attention deficit hyperactivity scores decline with aging, consistent with findings in non-MR children (Wilens, Biederman, & Spencer, 2002).
However, the course of externalizing symptoms or individual externalizing behaviors is not uniform. Scores for the item “Abusive, Swears at others” increase over time for girls and those with autism. The items “Has temper tantrums, e.g., stamps feet, slams doors,” “Throws or breaks objects,” and “Kicks, hits others” all decline progressively.
B. Internalizing Behavior
The self-absorbed score, which is associated with lower IQ, declines. This may represent a developmental phenomenon of increased mental age. The pattern of change in the anxiety subscale is of some interest. Anxiety scores decline in both genders with aging, significantly more so for boys. This is unlike the pattern of change seen in normally developing children, in whom an increase in some anxiety disorders is observed postpuberty. The reason for failure to observe this postpubertal increase in anxiety is unknown. Depression scores on the other hand, while also higher in girls, do not decline over time. Again, the expected increase in adolescence is not apparent (Costello, Egger, & Angold, 2005).
C. Down Syndrome
As has been noted elsewhere, participants with DS have less psychopathology across the whole range of symptoms and syndromes.
D. Prader-Willi Syndrome
Disruptive behavior scores are higher, especially for the items “abusive” (Abusive, swears at others), “tantrums” (Has temper tantrums, e.g., stamps feet, slams doors), and “throws” (Throws or breaks objects), though not for “kicks” (Kicks, hits others). Perhaps this last behavior requires more physical movement than what comes readily for people with PWS. Anxiety is not associated with PWS, but depression is associated.
E. Williams Syndrome
WS participants have high initial scores but these decline significantly more quickly than those of the non-WS epidemiological cohort across most externalizing and internalizing dimensions. Previous literature has noted the significantly higher anxiety scores in WS compared with other persons with MR (Dykens, 2003; Einfeld, Tonge, & Florio, 1997), and this is confirmed here. However, we are not aware of the observation previously that this elevated anxiety also declines significantly more quickly.
F. Fragile X Syndrome
FraX participants had lower initial levels of externalizing behaviors, but these were relatively stable. Internalizing behavior trends showed a mixed pattern. Scores on the “self-absorbed” scale tend to persist in FraX syndrome in comparison to others whose scores decline. Scores increase in anxiety but are stable for depression and “self-absorbed” scores remain steady.
G. Implications for Behavioral Phenotypes
These longitudinal data contribute to an extra dimension in delineating behavior phenotypes. The data demonstrate that behavioral characteristics in genetic disorders are not static, and further, that changes over time are quite specific to the particular disorder. This implies that the effects of genomic lesions on behavior pathways are interacting with and impacting on other developmental processes. Thus, we can anticipate that we will need to describe not just gene-to-behavior pathways in a particular syndrome, but rather gene-to-behavior pathways in that syndrome at each life stage.
REFERENCES
- American Psychiatric Association . Diagnostic and statistical manual of mental disorders. 4th ed. American Psychiatric Association Press; Washington, DC: 1994. [Google Scholar]
- Chadwick O, Kusel Y, Cuddy M, Taylor E. Psychiatric diagnoses and behaviour problems from childhood to early adolescence in young people with severe intellectual disabilities. Psychological Medicine. 2005;35:751–760. doi: 10.1017/s0033291704003733. [DOI] [PubMed] [Google Scholar]
- Chess S. Evolution of behavior disorder in a group of mentally retarded children. Journal of the American Academy of Child & Adolescent Psychiatry. 1977;16:5–18. doi: 10.1016/s0002-7138(09)61577-6. [DOI] [PubMed] [Google Scholar]
- Cox A, Rutter M. Diagnostic appraisal and interviewing. In: Rutter M, Hersov L, editors. Child and adolescent psychiatry: Modern approaches. 2nd ed. Blackwell Scientific; Oxford, England: 1985. pp. 233–247. [Google Scholar]
- Costello EJ, Egger H, Angold A. 10-year research update review: The epidemiology of child and adolescent psychiatric disorders: I. Methods and public health burden. Journal of the American Academy of Child & Adolescent Psychiatry. 2005;44(10):972–986. doi: 10.1097/01.chi.0000172552.41596.6f. [DOI] [PubMed] [Google Scholar]
- Dykens EM. Anxiety, fears, and phobias in persons with Williams syndrome. Developmental Neuropsychology. 2003;23(12):291–316. doi: 10.1080/87565641.2003.9651896. [DOI] [PubMed] [Google Scholar]
- Einfeld SL, Tonge BJ. Manual for the developmental behaviour checklist. Monash University Centre for Developmental Psychiatry and School of Psychiatry, University of N.S.W.; Melbourne and Sydney: 1992. [Google Scholar]
- Einfeld SL, Tonge BJ. The developmental behaviour checklist: The development and validation of an instrument to assess behavioural and emotional disturbance in children and adolescents with MR. Journal of Autism and Developmental Disorders. 1995;25:81–104. doi: 10.1007/BF02178498. [DOI] [PubMed] [Google Scholar]
- Einfeld SL, Tonge J. Population prevalence of psychopathology in children and adolescents with intellectual disability: I. Rationale and methods. Journal of Intellectual Disability Research. 1996a;40:91–98. doi: 10.1046/j.1365-2788.1996.767767.x. [DOI] [PubMed] [Google Scholar]
- Einfeld SL, Tonge J. Population prevalence of psychopathology in children and adolescents with intellectual disability: II. Epidemiological findings. Journal of Intellectual Disability Research. 1996b;40:99–109. doi: 10.1046/j.1365-2788.1996.768768.x. [DOI] [PubMed] [Google Scholar]
- Einfeld SL, Tonge BJ. Manual for the developmental behaviour checklist (Second Edition)—primary carer version (DBC-P) and teacher version (DBC-T) School of Psychiatry University of New South Wales and Centre for Developmental Psychiatry and Psychology, Monash University; Sydney and Melbourne: 2002. [Google Scholar]
- Einfeld SL, Tonge BJ, Florio T. Behavioural and emotional disturbance in individuals with Williams syndrome. American Journal on Mental Retardation. 1997;102:45–53. doi: 10.1352/0895-8017(1997)102<0045:BAEDII>2.0.CO;2. [DOI] [PubMed] [Google Scholar]
- Quine L, Pahl J. Stress and coping in families caring for a child with severe mental retardation: A longitudinal study. University of Kent; Canterbury, England: 1989. [Google Scholar]
- Richardson SA, Koller H. Twenty-two years: Causes and consequences of mental retardation. Harvard University Press; Cambridge, MA: 1996. [Google Scholar]
- Rutter ML, Tizard J, Whitmore K. Education, health and behaviour. Longmans; London: 1970. [Google Scholar]
- Sanders MR, Mazzucchelli T, Studman LJ. Practitioner’s manual for Stepping Stones Triple P. Triple P International; Brisbane, QLD, Australia: 2003a. [Google Scholar]
- Sanders MR, Mazzucchelli T, Studman LJ. Stepping Stones Triple P: For families with a child who has a disability. Triple P International; Brisbane, QLD, Australia: 2003b. [Google Scholar]
- StataCorp . Stata statistical software. Release 9. Stata Corporation; College Station, TX: 2005. [Google Scholar]
- Terman LM, Merrill MA. Stanford-Binet intelligence scale: Manual for the third revision, Form L-M. Houghton Mifflin; Boston: 1960. [Google Scholar]
- Wacker DP, Berg WK, Harding JW, Derby KM, Asmus JM, Healy A. Evaluation and long-term treatment of aberrant behaviour displayed by young children with disabilities. Journal of Developmental & Behavioral Pediatrics. 1998;19:260–266. doi: 10.1097/00004703-199808000-00004. [DOI] [PubMed] [Google Scholar]
- Wallander JL, Frison S, Rydvalova S. Risk for psychopathology in African American adolescents with mild intellectual disability; Proceeding of the 34th Annual Gatlinburg Conference 2001.2001. [Google Scholar]
- Wallander JL, Dekker MC, Koot HM. Psychopathology in children and adolescents with intellectual disability: Measurement, prevalence, course, and risk. In: Glidden LM, editor. International review of research in mental retardation. Vol. 26. Academic Press; San Diego, CA: 2003. pp. 93–134. [Google Scholar]
- Wechsler D. Manual for the Wechsler Intelligence Scale—Revised. The Psychological Corporation; San Antonio, TX: 1981. [Google Scholar]
- Wilens TE, Biederman J, Spencer TJ. Attention deficit/hyperactivity disorder across the lifespan. Annual Review of Medicine. 2002;53:113–131. doi: 10.1146/annurev.med.53.082901.103945. [DOI] [PubMed] [Google Scholar]


