

Abstract
Background
A previous clinical trial showed that selenium supplementation significantly reduced the incidence of prostate cancer. We report here a bioinformatics approach to gain new insights into selenium molecular targets that might be relevant to prostate cancer chemoprevention.
Materials and Methods
We first performed data mining analysis to identify genes which are consistently dysregulated in prostate cancer using published datasets from gene expression profiling of clinical prostate specimens. We then devised a method to systematically analyze three selenium microarray datasets from the LNCaP human prostate cancer cells, and to match the analysis to the cohort of genes implicated in prostate carcinogenesis. Moreover, we compared the selenium datasets with two datasets obtained from expression profiling of androgen-stimulated LNCaP cells.
Results
We found that selenium reverses the expression of genes implicated in prostate carcinogenesis. In addition, we found that selenium could counteract the effect of androgen on the expression of a subset obtained from androgen-regulated genes.
Conclusions
The above information provides us with a treasure of new clues to investigate the mechanism of selenium chemoprevention of prostate cancer. Furthermore, these selenium target genes could also serve as biomarkers in future clinical trials to gauge the efficacy of selenium intervention.
Keywords: Selenium, chemoprevention, prostate carcinogenesis, androgen receptor
Supplementation with a nutritional dose of selenium was found to reduce prostate cancer incidence by 50% in a randomized, placebo-controlled cancer prevention trial (1–3). Prostate cancer was actually a secondary endpoint in this study, which was designed originally to evaluate the effect of selenium on non-melanoma skin cancer. We reported previously that a selenium metabolite, in the form of methylseleninic acid or MSA, suppressed the growth of both the androgen-responsive LNCaP and the androgen-refractory PC-3 human prostate cancer cells (4,5). Growth inhibition by MSA was time- and dose-dependent, with an IC50 of ~10μM at 48 hours of treatment. In order to identify the molecular alterations that might be responsible for the growth inhibitory effect of selenium, we profiled gene expression changes in PC-3 cells using the Affymetrix 12K-gene oligonucleotide chip (4,5). Several working hypotheses have been generated from this dataset regarding the mechanisms of selenium action (4,5). In the present study, we completed a similar selenium array analysis in the androgen-responsive LNCaP cells using a 3K custom cDNA array. The smaller array is expected to improve the sensitivity of the assay, although the advantage is compromised by the reduced size of the dataset. Recently, Zhao et al. also performed microarray analysis in MSA-treated LNCaP cells using a high-density cDNA array (6). Our goal was to make use of these three selenium datasets and develop a global data mining strategy to earmark putative prostate cancer genes which are sensitive to selenium intervention.
Our approach was to compare the selenium datasets to three recently published prostate cancer microarray datasets generated from human tumor specimen. The first was an Affymetrix oligonucletide array study in 50 normal and 52 prostate cancers reported by Singh et al. (7). The second, described by Welsh et al. (8), was similar to the first with the exception that fewer samples were examined (9 normal and 25 prostate cancers). The third was an analysis of 41 normal and 62 prostate cancers by Lapointe et al. (9) using a 26K-gene cDNA microarray. These three prostate cancer datasets offer a rich source of information of dysregulated genes implicated in prostate carcinogenesis.
Androgen receptor (AR) signaling is known to play an important role in promoting prostate cancer progression (10). Consequently disruption of AR signaling is an effective means of prostate cancer management. We newly reported that selenium is capable of decreasing the expression and transactivating activity of AR (4). This novel finding underlies the justification of applying microarray analysis to investigate whether the expression of AR-regulated genes might be counteracted by selenium. Recent events have made this query possible. In separate studies by DePrimo et al. (11) and Nelson et al. (12), LNCaP cells were treated with a synthetic androgen and microarray analyses were then performed to identify genes responsive to androgen stimulation. These two androgen datasets are well suited to serve as a tool to mine the selenium datasets for additional clues. Collectively, the timely publication of a number of prostate cancer and androgen microarrays in the past two years provides an opportunity and sets the stage for the present effort to advance our understanding of selenium chemoprevention of prostate cancer.
Materials and Methods
Our own cDNA microarray analysis of LNCaP cells treated with selenium
The culture conditions of LNCaP cells have been described in detail previously (4). After exposure to 10 μM MSA for 3, 6, 12, 24, 36, or 48 h, total RNA and protein were isolated using TRIzol (Invitrogen, Carlsbad, CA, USA). The RNA collected from three independent experiments was pooled and subjected to microarray analysis using a 3K human cDNA microarray printed at the Microarray and Genomics Core Facility at Roswell Park Cancer Institute. This custom cDNA array was constructed based on the genes which were found to be modulated by selenium in PC-3 cells from our previous study (5). Each gene on this array was spotted in triplicate. Probe generation and array hybridization were conducted according to a protocol developed by the Core Facility (http://microarrays.roswellpark.org/Protocols). The hybridization signals were captured using an Affymetrix 428 array scanner (Affymetrix, Santa Clara, CA, USA), and analyzed using the ImaGene software (BioDiscovery, Inc., Marina Del Ray, CA, USA). Poor quality spots, along with spots with signal levels indistinguishable from background, were disgarded. The extracted image data were then processed by a series of steps including background subtraction, data normalization, ratio calculation, and statistical analysis of replicate spots. Data processing was done with the use of the ImaGene (BioDiscovery, Inc.) and the GeneTraffic software (Iobion Informatics LLC, La Jolla, CA, USA), the statistical package R, and in-house PERL programs. In order to control for the noise introduced by the fluorescent dyes, Cy3 and Cy5, each array experiment was performed twice with the labeling dyes reversed to eliminate dye biases, and the signal ratios from these two experiments were averaged. A log2-transformed treatment to control signal ratio of ≥1 or ≤−1 was chosen as the criteria for induction or repression, respectively. These threshold values are commonly used in the literature for microarray expression analysis (13,14). Hierarchical clustering analysis was performed using the Hierarchical Clustering Explorer software from the University of Maryland, USA.
Processing of publicly available microarray datasets
The datasets from the six published gene expression profiling studies (cited as references 7–9) were downloaded from the authors’ respective websites. Our own selenium PC-3 dataset (cited as reference 5) and selenium LNCaP dataset are available at the Roswell Park website (http://falcon.roswellpark.org/publication/CIp/dataMining). In view of the fact that the eight microarrays originated from different sources, one must appreciate that different identifiers, including cDNA clone IDs, probe set IDs, and GenBank accession numbers, were used to label the genes. In order to facilitate data comparison, these identifiers were mapped to the UniGene database (Build 136) at the National Center for Biotechnology Information (NCBI). The UniGene Cluster IDs were used to cross-reference genes in different datasets.
Permutation t-test analysis of prostate cancer datasets
For the three prostate cancer datasets (7–9), only samples classified as primary prostate cancer or normal prostate were included in the analysis; all other sample types were excluded from the original datasets. In order to identify genes that are differentially expressed between normal and cancer tissues, permutation t-test analysis was performed individually with each dataset. The t-statistic of a gene was calculated by the following formula:
where μi is the mean expression value of a given gene in the ith group, is the variance of that gene, and ni is the sample size of the ith group. The procedure of permutation was carried out on a gene-by-gene basis by randomly assigning each data point to either the normal or cancer group, while maintaining the total sample size of each group. This process was repeated 10,000 times and the p-value was defined as the fraction of t-statistics generated from randomization that was greater than or equal to the t-statistic generated from the actual data points. This method of analysis makes allowance for missing data points; however, anything with less than 5 data points is generally not expected to have sufficient statistical power and is therefore excluded from the analysis. A list of dysregulated genes was compiled based on the following criteria: p-values less than 0.001, and consistent changes in at least two out of the three datasets. The false discovery rate (q) was calculated as follows: , where p is the p-value, n is the total number of genes, and i is the number of genes with a p-value less than p. The above analyses were performed with in-house PERL programs.
Merging of datasets
Our selenium LNCaP dataset and Zhao’s selenium LNCaP dataset (6) were generated by an essentially identical protocol. The merging of these two datasets or, for that matter, other compatible datasets, would greatly increase the power and precision of the analysis provided that certain key parameters are properly safeguarded. Since the above two array experiments were conducted at multiple time points, it is necessary to devise a method for categorizing the pattern of expression changes across all time points. The data were filtered first to admit only those changes (induction or repression) that were over the 2-fold threshold (i.e. log2-transformed ratio ≥1 or ≤−1). A decision call of induction or repression was made for each gene only if ≥70% of the filtered data points showed the same direction of change. A consolidated LNCaP dataset was generated by merging the two LNCaP datasets and discarding genes with conflicting decision calls. The two androgen datasets of DePrimo et al. (11) and Nelson et al. (12) were merged in a similar manner. The above analyses were performed with in-house PERL programs.
Functional annotation of transcripts
Once a gene has been identified to be a target of selenium intervention, we assign it to a functional category for informational purposes. Functional annotation of transcripts was performed by using the Gene Ontology (GO) database and literature review. The UniGene cluster IDs of these genes were used to query the LocusLink database at NCBI (http://www.ncbi.nlm.nih.gov/LocusLink/) in order to extract the GO terms associated with these genes.
Results
Microarray data mining of genes implicated in prostate carcinogenesis
The three prostate cancer datasets (7–9) were chosen for our investigation because they represent the largest gene expression profiling studies comparing normal and cancerous prostate tissues. No statistical analysis, however, was performed in these three studies to identify putative prostate cancer genes. Since each of these datasets has independent measurements of gene expression in the normal and tumor groups, we undertook a systematic statistical evaluation of their results. Permutation t-test was carried out on each dataset, and genes with p-values <0.001 were selected as differentially expressed between the normal and cancer groups. Based on this criterion, 5,306 genes were pulled out from the Lapointe study (7–9), 672 from the Singh study (7–9), and 1,527 from the Welsh study (7–9). Our selection method has false discovery rates of 0.005, 0.019, and 0.008, respectively. For cross-validation, we reduced the number of genes to those with the same expression pattern in at least two out of three datasets. This procedure narrowed the list down to 1,067 genes with aberrant expression in prostate cancer. Among these, 497 or 46.6% are up-regulated, and 570 or 53.4% are down-regulated. The top 50 up- or down-regulated genes that appear in all three datasets, ranked by the average ratio, are listed in Tables IA and IB. The complete list can be accessed at our website.
Microarray analysis of LNCaP cells treated with selenium
A hierarchical clustering algorithm was applied to group genes according to their expression pattern across six time points following treatment with MSA. The clustering analysis of 762 selenium-responsive genes is shown in Figure 1. The branch points in the dendrogram correspond to each gene, and the length of the branches reflects the degree of relatedness. Red and green squares represent up-regulation and down-regulation, respectively, relative to the control values. Black squares indicate no change, and gray squares signify data of insufficient quality. The genes identified and the raw array data are available at our website. Four distinct clusters emerge from this analysis. Clusters A and C are composed of genes with a gradual or a rapid increase in expression level, respectively. Clusters B and D represent the group of genes with a rapid or gradual reduction in expression level, respectively.
Figure 1.
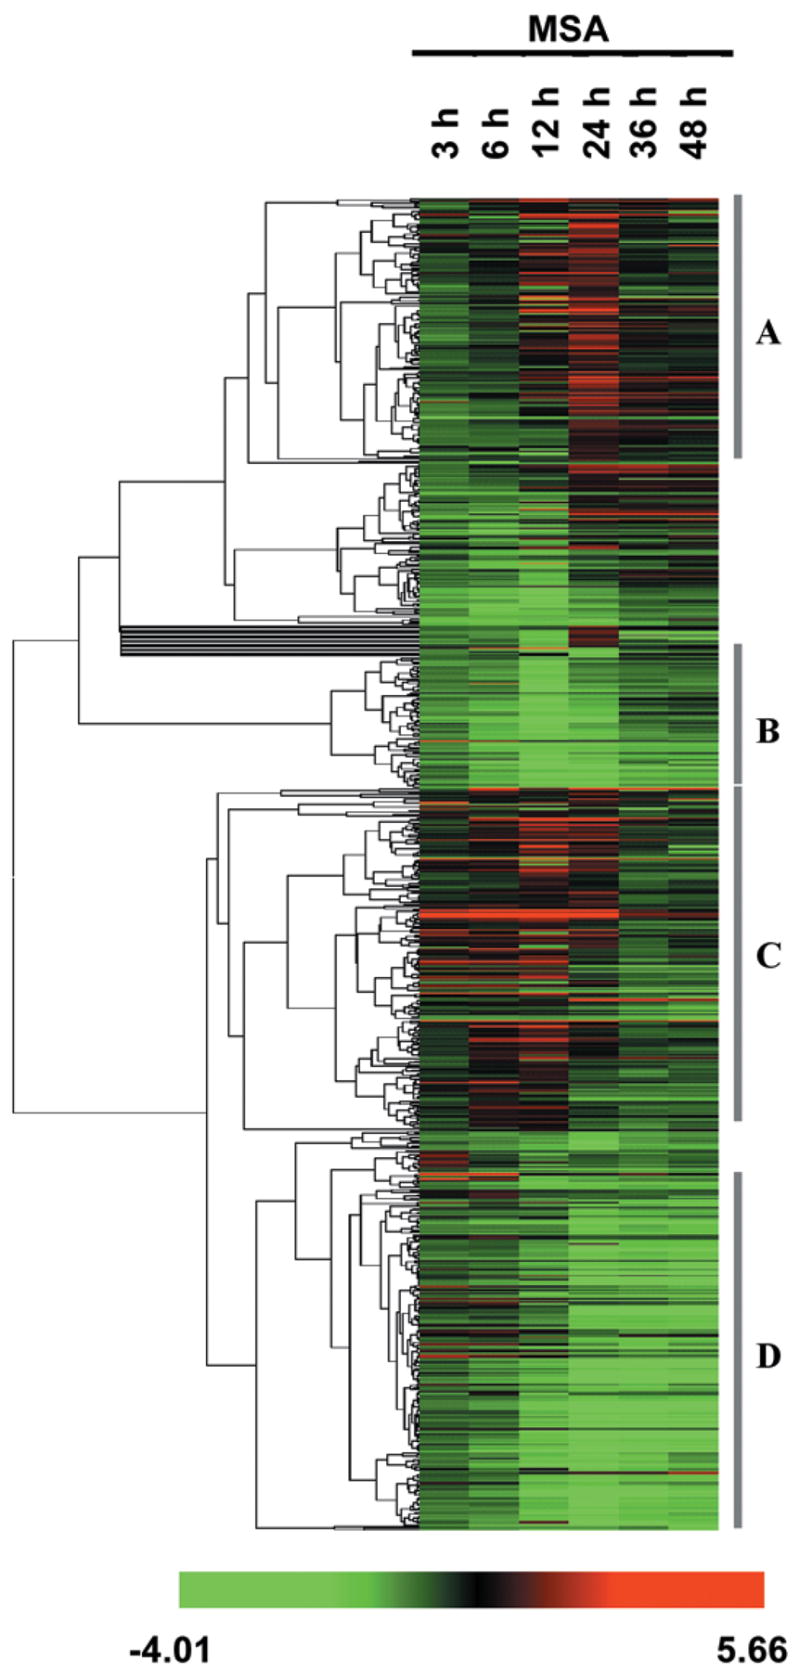
One-dimensional hierarchical clustering of selenium-responsive genes in LNCaP cells. Rows represent individual genes, and columns represent different time points. Each cell represents the expression level of a gene at a given time point, with red and green indicating up- and down-regulation, respectively, black indicates no change, and gray indicates missing values.
Selenium reverses the expression of genes implicated in prostate carcinogenesis
The cellular responses of the androgen-responsive LNCaP cells and the androgen-nonresponsive PC-3 cells to selenium are very similar. These two cell models represent different stages of prostate cancer progression. In order to identify relevant molecular targets underlying selenium chemopreventive action in incident prostate cancer or late stage relapse, we matched the prostate cancer datasets to the selenium LNCaP and PC-3 datasets. The goal was to identify dysregulated prostate cancer genes which could be reversed or restored to normal by selenium in both LNCaP and PC-3 cells. In this analysis, we compared 1,067 genes that are consistently dysregulated in prostate cancer and 427 genes that are sensitive to selenium modulation in both LNCaP and PC3 cells. We found that there are a total of 71 genes common to both datasets. Among these, 25 are regulated in the same direction, 42 are regulated reciprocally, and 4 are regulated spuriously. Theoretically, when comparing a random list of 1,067 genes with another random list of 427 genes from the human genome (estimated to contain a total of ~30,000 genes), the number of overlap one would expect to obtain is: genes. Assuming there is a 50% chance of these 15 genes being modulated reciprocally (i.e. a random distribution), the number of genes in this category would be reduced by half to 7.5. This number is far less than the 42 reciprocally regulated genes we have identified. Therefore, it is very unlikely that the outcome of our data mining method is due only to chance. These 42 genes are listed in Table II. A negative value denotes down-regulation, while a positive value indicates up-regulation. The flip-flop between the PCa (prostate cancer) column and the two Se columns is self-evident. Three genes, UMPK, SERPINB5, and FOXA1, are also present in Tables IA or IB. It should be noted that the genes in these two tables are only subsets of the cohort of prostate cancer genes used in this analysis.
Table II.
Selenium reverses the expression of genes implicated in prostate carcinogenesis: common to LNCaP and PC-3 cells
| UniGene ID | Symbol | Gene description | Fold Change (log2)*
|
||
|---|---|---|---|---|---|
| PCa | Se/LNCaP | Se/PC3 | |||
| Cell proliferation/Apoptosis | |||||
| Hs.170087 | AHR | Aryl hydrocarbon receptor | −0.81 | 3.96 | 2.46 |
| Hs.9754 | ATF5 | activating transcription factor 5 | 0.62 | −1.31 | −3.14 |
| Hs.106070 | CDKN1C | cyclin-dependent kinase inhibitor 1C (p57, Kip2) | −0.87 | 1.16 | 2.14 |
| Hs.196769 | CHC1 | chromosome condensation 1 | 1.06 | −1.05 | −1.68 |
| Hs.184161 | EXT1 | exostoses (multiple) 1 | −0.53 | 1.20 | 1.00 |
| Hs.170133# | FOXO1A | forkhead box O1A (rhabdomyosarcoma) | −0.86 | 1.17 | 1.26 |
| Hs.82028 | TGFBR2 | transforming growth factor, beta receptor II (70/80kDa) | −0.76 | 1.31 | 1.2 |
| Signal transduction | |||||
| Hs.337774 | ARHGEF2 | rho/rac guanine nucleotide exchange factor (GEF) 2 | −0.86 | 1.26 | 1.85 |
| Hs.116796 | DIXDC1 | DIX domain containing 1 | −1.23 | 2.31 | 1.00 |
| Hs.381928 | DVL3 | dishevelled, dsh homolog 3 (Drosophila) | −0.61 | 1.88 | 3.29 |
| Hs.211569 | GRK5 | G protein-coupled receptor kinase 5 | −1.49 | 2.32 | 2.10 |
| Hs.436004 | JAK1 | Janus kinase 1 (a protein tyrosine kinase) | −0.53 | 1.89 | 2.46 |
| Hs.79219 | RGL1 | ral guanine nucleotide dissociation stimulator-like 1 | −2.15 | 1.04 | 3.81 |
| Transcriptional regulation | |||||
| Hs.163484 | FOXA1 | forkhead box A1 | 1.46 | −1.36 | −1.00 |
| Hs.166017 | MITF | microphthalmia-associated transcription factor | −0.55 | 1.13 | 1.68 |
| Tumor suppressor genes | |||||
| Hs.386952 | CYLD | cylindromatosis (turban tumor syndrome) | −1.20 | 1.19 | 1.20 |
| Hs.446537 | GSN | gelsolin (amyloidosis, Finnish type) | −1.38 | 1.78 | 1.43 |
| Hs.55279# | SERPINB5 | serine (or cysteine) proteinase inhibitor, clade B, member 5 | −2.02 | 1.04 | 1.81 |
| Hs.152207 | SSBP2 | single-stranded DNA binding protein 2 | −0.68 | 1.72 | 1.63 |
| Oncogenes | |||||
| Hs.390567 | FYN | FYN oncogene related to SRC, FGR, YES | −0.52 | 2.00 | 2.04 |
| Hs.223025 | RAB31 | RAB31, member RAS oncogene family | −1.05 | 1.94 | 1.43 |
| Cytoskeleton | |||||
| Hs.26208 | COL16A1 | collagen, type XVI, alpha 1 | −1.34 | 1.35 | 2.68 |
| Hs.440387 | EPB41L2 | erythrocyte membrane protein band 4.1-like 2 | −0.78 | 1.25 | 1.07 |
| Metabolism | |||||
| Hs.264330 | ASAHL | N-acylsphingosine amidohydrolase (acid ceramidase)-like | 1.62 | −1.63 | −2.74 |
| Hs.303154 | IDS | iduronate 2-sulfatase (Hunter syndrome) | −0.43 | 1.60 | 1.49 |
| Hs.167531 | MCCC2 | methylcrotonoyl-Coenzyme A carboxylase 2 (beta) | 2.26 | −1.27 | −1.43 |
| Hs.458360# | UMPK | uridine monophosphate kinase | 3.93 | −1.03 | −1.00 |
| Other functions | |||||
| Hs.408767 | CRYAB | crystallin, alpha B | −1.74 | 1.84 | 2.17 |
| Hs.8302 | FHL2 | four and a half LIM domains 2 | −1.25 | 1.13 | 1.26 |
| Hs.848 | FKBP4 | FK506 binding protein 4, 59kDa | 0.93 | −1.22 | −1.14 |
| Hs.81361 | HNRPAB | heterogeneous nuclear ribonucleoprotein A/B | 0.51 | −1.26 | −1.00 |
| Hs.372571 | MBNL2 | muscleblind-like 2 (Drosophila) | −1.09 | 2.93 | 1.63 |
| Hs.390162 | OPTN | Optineurin | −1.94 | 3.71 | 1.72 |
| Hs.1501 | SDC2 | syndecan 2 | −0.96 | 1.01 | 1.68 |
| Hs.439643 | SLC16A7 | solute carrier family 16, member 7 | −1.20 | 1.41 | 1.32 |
| Unknown | |||||
| Hs.27621 | CDNA FLJ12815 fis, clone NT2RP2002546 | −1.49 | 1.10 | 1.26 | |
| Hs.440808 | FNBP1 | formin binding protein 1 | −1.42 | 1.16 | 1.32 |
| Hs.336429 | GABARAPL1 | GABA(A) receptor-associated protein like 1 | −0.68 | 1.03 | 1.43 |
| Hs.42322 | PALM2 | paralemmin 2 | −1.00 | 1.24 | 1.81 |
| Hs.224262 | PJA2 | praja 2, RING-H2 motif containing | −0.50 | 1.36 | 1.68 |
| Hs.439776 | STOM | Stomatin | −0.91 | 1.50 | 1.32 |
| Hs.433838 | STX12 | syntaxin 12 | −0.56 | 1.35 | 1.00 |
For LNCaP and PC-3, the ratio is the maximum value of the data points from all the time- and concentration-series of selenium treatment. For PCa, it is the largest value from three prostate cancer datasets.
also present in Table IA or IB.
Table I.
| Table IA. Top 50 up-regulated genes in prostate cancers | ||||||
|---|---|---|---|---|---|---|
|
| ||||||
| Unigene ID | Symbol | Gene description | log2 transformed ratio#
|
|||
| Lapointe | Welsh | Singh | Average | |||
| Hs.49598* | AMACR | alpha-methylacyl-CoA racemase | 3.31 | 3.53 | 3.29 | 3.38 |
| Hs.118483 | MYO6 | myosin VI | 1.81 | 2.21 | 4.36 | 3.26 |
| Hs.27311 | SIM2 | single-minded homolog 2 (Drosophila) | 1.58 | 4.00 | 3.21 | 3.23 |
| Hs.820 | HOXC6 | homeo box C6 | 0.60 | 3.12 | 4.08 | 3.18 |
| Hs.432750* | HPN | hepsin (transmembrane protease, serine 1) | 2.51 | 2.82 | 3.38 | 2.95 |
| Hs.458360 | UMPK | uridine monophosphate kinase | 0.88 | 2.58 | 3.93 | 2.94 |
| Hs.93304 | PLA2G7 | phospholipase A2, group VII | 1.50 | 2.33 | 3.69 | 2.79 |
| Hs.306812 | BUCS1 | butyryl Coenzyme A synthetase 1 | 2.70 | 2.35 | 3.17 | 2.78 |
| Hs.412020 | BICD1 | Bicaudal D homolog 1 (Drosophila) | 1.21 | 2.09 | 2.87 | 2.21 |
| Hs.155419 | BIK | BCL2-interacting killer (apoptosis-inducing) | 0.56 | 1.60 | 3.06 | 2.1 |
| Hs.296638* | PLAB | prostate differentiation factor | 0.83 | 2.83 | 1.81 | 2.05 |
| Hs.154103* | LIM | LIM protein (similar to rat protein kinase C-binding enigma) | 1.57 | 1.91 | 2.22 | 1.93 |
| Hs.405961 | OASIS | old astrocyte specifically induced substance | 0.70 | 1.38 | 2.67 | 1.82 |
| Hs.76901 | PDIR | for protein disulfide isomerase-related | 0.69 | 2.05 | 1.99 | 1.7 |
| Hs.334707 | ACY1 | aminoacylase 1 | 0.77 | 2.00 | 1.67 | 1.57 |
| Hs.380460 | ICA1 | islet cell autoantigen 1, 69kDa | 0.70 | 0.84 | 2.45 | 1.57 |
| Hs.360509 | FBP1 | fructose-1,6-bisphosphatase 1 | 1.15 | 1.51 | 1.82 | 1.52 |
| Hs.38972 | TSPAN-1 | tetraspan 1 | 0.62 | 1.76 | 1.83 | 1.5 |
| Hs.356894 | HSD17B4 | hydroxysteroid (17-beta) dehydrogenase 4 | 0.78 | 1.76 | 1.71 | 1.48 |
| Hs.278611 | GALNT3 | UDP-N-acetyl-alpha-D-galactosamine:polypeptide N-acetylgalactosaminyltransferase 3 (GalNAc-T3) | 0.80 | 1.44 | 1.76 | 1.39 |
| Hs.440478 | ANK3 | ankyrin 3, node of Ranvier (ankyrin G) | 1.08 | 1.79 | 1.17 | 1.38 |
| Hs.306251 | ERBB3 | v-erb-b2 erythroblastic leukemia viral oncogene homolog 3 (avian) | 0.28 | 1.24 | 2.05 | 1.36 |
| Hs.247817 | HIST1H2BK | histone 1, H2bk | 0.86 | 1.73 | 1.34 | 1.35 |
| Hs.444439* | PAICS | phosphoribosylaminoimidazole carboxylase, phosphoribosylaminoimidazole succinocarboxamide synthetase | 0.79 | 1.23 | 1.82 | 1.34 |
| Hs.83919 | GCS1 | glucosidase I | 0.57 | 1.32 | 1.85 | 1.34 |
| Hs.156682 | IGSF4 | immunoglobulin superfamily, member 4 | 0.63 | 1.76 | 1.32 | 1.31 |
| Hs.75139 | ARFIP2 | ADP-ribosylation factor interacting protein 2 (arfaptin 2) | 0.42 | 1.47 | 1.71 | 1.30 |
| Hs.512670 | BCAT2 | branched chain aminotransferase 2, mitochondrial | 0.53 | 1.31 | 1.79 | 1.30 |
| Hs.434243 | KIBRA | KIBRA protein | 0.71 | 1.44 | 1.59 | 1.29 |
| Hs.297343 | CAMKK2 | calcium/calmodulin-dependent protein kinase kinase 2, beta | 0.87 | 1.78 | 0.97 | 1.26 |
| Hs.387140 | FLJ20323 | hypothetical protein FLJ20323 | 0.37 | 1.18 | 1.85 | 1.25 |
| Hs.405410 | OGT | O-linked N-acetylglucosamine (GlcNAc) transferase | 0.61 | 1.15 | 1.75 | 1.24 |
| Hs.21293* | UAP1 | UDP-N-acteylglucosamine pyrophosphorylase 1 | 1.05 | 1.27 | 1.39 | 1.24 |
| Hs.155040 | ZNF217 | zinc finger protein 217 | 0.73 | 1.43 | 1.45 | 1.24 |
| Hs.82280 | RGS10 | regulator of G-protein signalling 10 | 1.00 | 0.85 | 1.62 | 1.20 |
| Hs.76285* | DKFZP564B167 | DKFZP564B167 protein | 0.79 | 1.29 | 1.38 | 1.17 |
| Hs.449815 | similar to My016 protein | 0.28 | 0.92 | 1.85 | 1.16 | |
| Hs.234521 | MAPKAPK3 | mitogen-activated protein kinase-activated protein kinase 3 | 0.47 | 1.12 | 1.61 | 1.14 |
| Hs.2551 | ADRB2 | adrenergic, beta-2-, receptor, surface | 0.52 | 1.45 | 1.28 | 1.13 |
| Hs.357901* | SOX4 | SRY (sex determining region Y)-box 4 | 0.94 | 1.36 | 1.05 | 1.13 |
| Hs.406534 | HMG20B | high-mobility group 20B | 0.55 | 1.17 | 1.50 | 1.12 |
| Hs.166697 | LRIG1 | leucine-rich repeats and immunoglobulin-like domains 1 | 0.77 | 1.37 | 1.15 | 1.12 |
| Hs.118638* | NME1 | non-metastatic cells 1, protein (NM23A) expressed in | 0.74 | 1.14 | 1.39 | 1.11 |
| Hs.79064 | DHPS | deoxyhypusine synthase | 0.42 | 0.48 | 1.89 | 1.10 |
| Hs.21894 | ARHCL1 | ras homolog gene family, member C like 1 | 0.60 | 1.59 | 0.82 | 1.07 |
| Hs.424551 | P24B | integral type I protein | 0.54 | 1.26 | 1.29 | 1.07 |
| Hs.75432 | IMPDH2 | IMP (inosine monophosphate) dehydrogenase 2 | 0.77 | 1.01 | 1.35 | 1.06 |
| Hs.163484 | FOXA1 | forkhead box A1 | 0.33 | 1.16 | 1.46 | 1.05 |
| Hs.291385 | ATP8A1 | ATPase, aminophospholipid transporter, Class I, type 8A, member 1 | 0.85 | 1.19 | 1.10 | 1.05 |
| Hs.423095 | NUCB2 | nucleobindin 2 | 0.51 | 1.40 | 1.10 | 1.05 |
| Table IB. Top 50 down-regulated genes in prostate cancers | ||||||
|
| ||||||
| Unigene ID | Symbol | Gene description | log2 transformed ratio
|
|||
| Lapointe | Welsh | Singh | Average | |||
|
| ||||||
| Hs.75652 | GSTM5 | glutathione S-transferase M5 | −1.80 | −1.47 | −∞ | −2.21 |
| Hs.77854 | RGN | regucalcin (senescence marker protein-30) | −1.05 | −2.44 | −5.06 | −2.10 |
| Hs.339831 | PENK | Proenkephalin | −1.24 | −1.71 | −4.21 | −1.94 |
| Hs.34114 | ATP1A2 | ATPase, Na+/K+ transporting, alpha 2 (+) polypeptide | −1.37 | −2.39 | −2.22 | −1.92 |
| Hs.80552 | DPT | Dermatopontin | −1.50 | −1.89 | −2.35 | −1.87 |
| Hs.7357 | CLIPR-59 | CLIP-170-related protein | −0.70 | −2.81 | −3.76 | −1.85 |
| Hs.301914 | DAT1 | Neuronal specific transcription factor DAT1 | −1.09 | −1.83 | −3.45 | −1.83 |
| Hs.440324 | NRLN1 | Neuralin 1 | −1.41 | −2.28 | −1.88 | −1.81 |
| Hs.78748 | RIMS3 | regulating synaptic membrane exocytosis 3 | −1.17 | −1.42 | −3.96 | −1.76 |
| Hs.448805 | GPRC5B | G protein-coupled receptor, family C, group 5, member B | −1.14 | −1.55 | −3.41 | −1.76 |
| Hs.55279 | SERPINB5 | serine (or cysteine) proteinase inhibitor, clade B (ovalbumin), member 5 | −1.38 | −2.02 | −1.92 | −1.75 |
| Hs.78792 | NCAM1 | neural cell adhesion molecule 1 | −1.40 | −1.29 | −3.20 | −1.75 |
| Hs.60177 | DZIP1 | zinc finger DAZ interacting protein 1 | −0.77 | −1.82 | −4.84 | −1.73 |
| Hs.5378 | SPON1 | spondin 1, (f-spondin) extracellular matrix protein | −1.09 | −1.19 | −6.12 | −1.70 |
| Hs.408 | COL4A6 | Collagen, type IV, alpha 6 | −1.26 | −1.97 | −1.98 | −1.70 |
| Hs.406238 | AOX1 | Aldehyde oxidase 1 | −1.31 | −1.96 | −1.77 | −1.65 |
| Hs.234863 | TSPAN-2 | tetraspan 2 | −0.95 | −1.32 | −3.90 | −1.60 |
| Hs.348387 | GSTM4 | glutathione S-transferase M4 | −1.46 | −1.73 | −1.62 | −1.60 |
| Hs.408767 | CRYAB | crystallin, alpha B | −1.62 | −1.74 | −1.31 | −1.55 |
| Hs.411509 | GSTP1 | glutathione S-transferase pi | −1.24 | −1.38 | −2.19 | −1.55 |
| Hs.101850 | RBP1 | retinol binding protein 1, cellular | −0.98 | −1.41 | −2.41 | −1.48 |
| Hs.211933 | COL13A1 | Collagen, type XIII, alpha 1 | −0.65 | −1.54 | −3.28 | −1.47 |
| Hs.80395 | MAL | mal, T-cell differentiation protein | −0.93 | −0.81 | −∞ | −1.45 |
| Hs.93841 | KCNMB1 | potassium large conductance calcium-activated channel, subfamily M, beta member 1 | −1.37 | −1.90 | −1.14 | −1.44 |
| Hs.74034 | CAV1 | Caveolin 1, caveolae protein, 22kDa | −1.71 | −1.65 | −1.05 | −1.44 |
| Hs.139851* | CAV2 | Caveolin 2 | −1.35 | −1.34 | −1.62 | −1.43 |
| Hs.302085 | PTGIS | prostaglandin I2 (prostacyclin) synthase | −1.09 | −1.52 | −1.76 | −1.43 |
| Hs.103839 | EPB41L3 | erythrocyte membrane protein band 4.1-like 3 | −0.77 | −1.81 | −1.92 | −1.40 |
| Hs.436657 | CLU | Clusterin | −1.35 | −1.55 | −1.30 | −1.40 |
| Hs.421621 | COX7A1 | cytochrome c oxidase subunit VIIa polypeptide 1 (muscle) | −1.23 | −1.73 | −1.17 | −1.36 |
| Hs.79015 | MOX2 | antigen identified by monoclonal antibody MRC OX-2 | −1.08 | −1.65 | −1.39 | −1.36 |
| Hs.131380 | SGCD | sarcoglycan, delta (35kDa dystrophin-associated glycoprotein) | −0.76 | −1.96 | −1.59 | −1.35 |
| Hs.5422* | GPM6B | glycoprotein M6B | −0.80 | −1.17 | −2.47 | −1.33 |
| Hs.2006 | GSTM3 | glutathione S-transferase M3 (brain) | −0.27 | −2.01 | −2.87 | −1.31 |
| Hs.156007* | DSCR1L1 | Down syndrome critical region gene 1-like 1 | −1.10 | −1.73 | −1.15 | −1.30 |
| Hs.430166 | PLS3 | plastin 3 (T isoform) | −0.63 | −1.09 | −3.16 | −1.29 |
| Hs.24587 | EFS | embryonal Fyn-associated substrate | −1.56 | −0.54 | −2.25 | −1.28 |
| Hs.8022 | TU3A | TU3A protein | −1.42 | −1.15 | −1.27 | −1.28 |
| Hs.439040 | RPESP | RPE-spondin | −0.99 | −1.27 | −1.64 | −1.28 |
| Hs.2463 | ANGPT1 | angiopoietin 1 | −1.40 | −1.41 | −0.98 | −1.25 |
| Hs.362805* | MEIS2 | Meis1, myeloid ecotropic viral integration site 1 homolog 2 (mouse) | −1.12 | −1.47 | −1.13 | −1.23 |
| Hs.300772 | TPM2 | tropomyosin 2 (beta) | −1.16 | −1.80 | −0.80 | −1.20 |
| Hs.372031* | PMP22 | peripheral myelin protein 22 | −1.00 | −1.79 | −0.90 | −1.18 |
| Hs.79386 | LMOD1 | leiomodin 1 (smooth muscle) | −0.76 | −2.17 | −0.96 | −1.18 |
| Hs.414407 | HEC | highly expressed in cancer, rich in leucine heptad repeats | −0.80 | −1.10 | −1.76 | −1.17 |
| Hs.137569 | TP73L | tumor protein p73-like | −1.36 | −1.19 | −0.94 | −1.16 |
| Hs.75350* | VCL | Vinculin | −1.18 | −1.31 | −0.99 | −1.15 |
| Hs.150358 | DPYSL3 | dihydropyrimidinase-like 3 | −0.94 | −1.49 | −1.04 | −1.14 |
| Hs.79226 | FEZ1 | fasciculation and elongation protein zeta 1 (zygin I) | −0.33 | −1.30 | −2.55 | −1.13 |
| Hs.81412 | LPIN1 | lipin 1 | −0.69 | −1.33 | −1.47 | −1.12 |
log2-tranformed cancer to normal signal ratio. The average is obtained by calculating the mean of the three linear ratios and transforming the mean to log2 value. – (x) indicates a linear ratio of 0.
these genes are also present in Rhodes et al. (35).
The genes in Table II are further classified into a number of functional categories. Because of space limitation, it is not possible to elaborate the function of each of these genes. Suffice it to note that a significant number of them is involved in controlling cell cycle progression and/or cell death, including AHR (15), CHC1 (16), CDKN1C (17), ATF5 (18), and FOXO1A (19–21). Selenium modulates their expression in a way that is consistent with cell growth inhibition, cell cycle block, and apoptosis stimulation. Table II also shows that selenium is able to up-regulate the expression of four genes with tumor suppressing activities. SERPINB5, also known as maspin, is a serine proteinase inhibitor capable of suppressing tumor invasion, apoptosis, and angiogenesis (22–24). It has been reported that the expression of SERPINB5 decreases with increasing prostate cancer malignancy (25). Gelsolin is under-expressed in several cancer types, including prostate (26–29). CYLD is a deubiquitinating enzyme which negatively regulates the activation of NFκB, an anti-apoptotic factor (30). Restoring the lost expression of CYLD in prostate cancer cells could conceivably sensitize them to apoptosis induction. SSBP2 is a translocation target in a leukemia cell line and is classified as a tumor suppressor candidate gene (31). It is intriguing that the expression of two oncogenes, FYN and RAB31, is down-regulated in prostate cancer. FYN is a member of the protein-tyrosine kinase oncogene family (32), and RAB31 belongs to the RAS oncogene family (33). The roles of these genes in prostate carcinogenesis are not clear; nonetheless, selenium is found to elevate the expression of both genes.
As a reminder, Table II is produced to highlight the putative prostate cancer genes sensitive to reversal of expression by selenium in both LNCaP and PC-3 cells. For the sake of thoroughness, we also present the analyses of two additional sets of prostate cancer genes which are uniquely modulated by selenium in either LNCaP (Table III) or PC-3 cells (Table IV). Due to the size of these tables, it would be tiresome to go through the data in any comprehensive fashion. Depending on future interests and evolving knowledge, this kind of information has value in seeking out clues and generating hypotheses.
Table III.
Selenium reverses the expression of genes implicated in prostate carcinogenesis: unique to LNCaP cells
| UniGene ID | Symbol | Gene description | Fold Change (log2)*
|
|
|---|---|---|---|---|
| PCa | Se | |||
| Cell proliferation/Apoptosis | ||||
| Hs.77311 | BTG3 | BTG family, member 3 | −0.66 | 1.42 |
| Hs.95577 | CDK4 | cyclin-dependent kinase 4 | 0.42 | −1.08 |
| Hs.348153 | CUL1 | cullin 1 | −0.34 | 1.45 |
| Hs.118638 | NME1 | non-metastatic cells 1, protein (NM23A) expressed in | 1.39 | −1.21 |
| Hs.169840 | TTK | TTK protein kinase | 1.24 | −1.13 |
| Signal transduction | ||||
| Hs.197081 | AKAP12 | A kinase (PRKA) anchor protein (gravin) 12 | −0.93 | 1.16 |
| Hs.271809 | GPR161 | G protein-coupled receptor 161 | −0.89 | 1.01 |
| Hs.433488 | GUCY1A3 | guanylate cyclase 1, soluble, alpha 3 | 3.10 | −1.53 |
| Hs.149900 | ITPR1 | inositol 1,4,5-triphosphate receptor, type 1 | −1.44 | 1.53 |
| Transcriptional regulation | ||||
| Hs.76884 | ID3 | inhibitor of DNA binding 3, dominant negative helix-loop-helix protein | −0.99 | 4.55 |
| Hs.408222 | PBX1 | pre-B-cell leukemia transcription factor 1 | −1.00 | 1.29 |
| Hs.360174 | SNAI2 | snail homolog 2 (Drosophila) | −1.29 | 1.22 |
| Transporter | ||||
| Hs.307915 | ABCC4 | ATP-binding cassette, sub-family C (CFTR/MRP), member 4 | 2.56 | −1.08 |
| Hs.99865 | EPIM | Epimorphin | −1.63 | 1.05 |
| Hs.14732 | ME1 | malic enzyme 1, NADP(+)-dependent, cytosolic | −1.04 | 1.55 |
| Hs.221974 | SNAP25 | synaptosomal-associated protein, 25kDa | −1.39 | 1.88 |
| Cytoskeleton | ||||
| Hs.403989 | ACTG2 | actin, gamma 2, smooth muscle, enteric | −1.51 | 1.02 |
| Hs.440478 | ANK3 | ankyrin 3, node of Ranvier (ankyrin G) | 1.79 | −1.51 |
| Hs.446375 | MAPRE2 | microtubule-associated protein, RP/EB family, member 2 | −0.78 | 1.24 |
| Hs.108924 | SORBS1 | sorbin and SH3 domain containing 1 | −1.28 | 1.91 |
| Metabolism | ||||
| Hs.440117 | ALG8 | asparagine-linked glycosylation 8 homolog | 1.12 | −1.25 |
| Hs.75616 | DHCR24 | 24-dehydrocholesterol reductase | 1.43 | −1.07 |
| Hs.268012 | FACL3 | fatty-acid-Coenzyme A ligase, long-chain 3 | 0.83 | −1.14 |
| Hs.75485 | OAT | ornithine aminotransferase (gyrate atrophy) | −0.77 | 2.16 |
| Hs.79886 | RPIA | ribose 5-phosphate isomerase A (ribose 5-phosphate epimerase) | 0.44 | −1.46 |
| Protease/Protease inhibitor | ||||
| Hs.181350 | KLK2 | kallikrein 2, prostatic | 0.97 | −2.27 |
| Hs.171995 | KLK3 | kallikrein 3, (prostate specific antigen) | 0.69 | −2.45 |
| Hs.21858 | SERPINE2 | serine (or cysteine) proteinase inhibitor, clade E, member 2 | −0.92 | 1.23 |
| Other functions | ||||
| Hs.237506 | DNAJB5 | DnaJ (Hsp40) homolog, subfamily B, member 5 | −3.65 | 1.06 |
| Hs.173381 | DPYSL2 | dihydropyrimidinase-like 2 | −1.05 | 1.14 |
| Hs.315177 | IFRD2 | interferon-related developmental regulator 2 | 0.44 | −1.23 |
| Hs.5025 | NEBL | Nebulette | −0.78 | 1.57 |
| Hs.131727 | PFAAP5 | phosphonoformate immuno-associated protein 5 | −0.81 | 1.13 |
| Hs.438582 | PRNP | prion protein (p27-30) | −0.94 | 1.19 |
| Hs.250607 | UTRN | utrophin (homologous to dystrophin) | 0.88 | −1.01 |
| Hs.435800 | VIM | Vimentin | −0.61 | 1.61 |
| Unknown | ||||
| Hs.48450 | Human mRNA, trinucleotide repeat sequence. | −1.02 | 1.21 | |
| Hs.428112 | DEAF1 | deformed epidermal autoregulatory factor 1 (Drosophila) | 0.82 | −1.15 |
| Hs.4747 | DKC1 | dyskeratosis congenita 1, dyskerin | 0.86 | −1.11 |
| Hs.112605 | DKFZP564O043 | hypothetical protein DKFZp564O043 | −0.72 | 1.58 |
| Hs.301839 | HABP4 | hyaluronan binding protein 4 | −0.86 | 1.33 |
| Hs.278483 | HIST1H4J | histone 1, H4j | 3.31 | −1.98 |
| Hs.157818 | KCNAB1 | potassium voltage-gated channel, shaker-related subfamily, beta member 1 | −1.48 | 1.38 |
| Hs.408142 | KIAA1109 | hypothetical protein KIAA1109 | −0.56 | 1.58 |
| Hs.309244 | KIAA1579 | hypothetical protein FLJ10770 | −0.48 | 2.29 |
| Hs.90797 | LOC129642 | hypothetical protein BC016005 | 2.39 | −1.40 |
| Hs.270411 | PLEKHC1 | pleckstrin homology domain containing, family C, member 1 | −1.48 | 1.46 |
| Hs.5957 | PTPLB | protein tyrosine phosphatase-like, member b | 1.00 | −1.06 |
| Hs.356342 | RPL27A | ribosomal protein L27a | 0.52 | −1.21 |
For LNCaP, the ratio is the maximum value of the data points from all the time- and concentration-series of selenium treatment. For PCa, it is the average tumor to normal ratio.
Table IV.
Selenium reverses the expression of genes implicated in prostate carcinogenesis: unique to PC-3 cells
| UniGene ID | Symbol | Gene description | Fold Change (log2)
|
|
|---|---|---|---|---|
| PCa | Se | |||
| Cell proliferation/Apoptosis | ||||
| Hs.109752 | C6orf108 | chromosome 6 open reading frame 108 | 0.67 | −1.14 |
| Hs.282410 | CALM1 | calmodulin 1 (phosphorylase kinase, delta) | −0.93 | 3.07 |
| Hs.2132 | EPS8 | epidermal growth factor receptor pathway substrate 8 | −1.29 | 2.10 |
| Hs.65029 | GAS1 | growth arrest-specific 1 | −1.67 | 1.14 |
| Hs.370873 | IFI16 | interferon, gamma-inducible protein 16 | −0.68 | 1.20 |
| Hs.253067 | MAEA | macrophage erythroblast attacher | 0.34 | −1.14 |
| Hs.118630 | MXI1 | MAX interacting protein 1 | −0.98 | 1.81 |
| Hs.72660 | PTDSR | phosphatidylserine receptor | −0.74 | 1.26 |
| Hs.23582 | TACSTD2 | tumor-associated calcium signal transducer 2 | 0.99 | −1.07 |
| Cell adhesion | ||||
| Hs.415997 | COL6A1 | collagen, type VI, alpha 1 | −1.36 | 2.81 |
| Hs.79226 | FEZ1 | fasciculation and elongation protein zeta 1 (zygin I) | −2.55 | 1.49 |
| Hs.277324 | GALNT1 | UDP-N-acetyl-alpha-D-galactosamine:polypeptide N-acetylgalactosaminyltransferase 1 | 1.43 | −1.07 |
| Hs.437536 | LAMA4 | laminin, alpha 4 | −1.24 | 1.00 |
| Hs.436983 | LAMB3 | laminin, beta 3 | −1.73 | 1.49 |
| Hs.194431 | KIAA0992 | Paladin | −1.35 | 1.38 |
| Hs.46531 | PGM5 | phosphoglucomutase 5 | −1.46 | 1.38 |
| Cytoskeleton | ||||
| Hs.208641 | ACTA2 | actin, alpha 2, smooth muscle, aorta | −1.11 | 1.38 |
| Hs.309415 | CAPZA1 | capping protein (actin filament) muscle Z-line, alpha 1 | 0.58 | −1.00 |
| Hs.65248 | DNCI1 | dynein, cytoplasmic, intermediate polypeptide 1 | −1.46 | 1.07 |
| Hs.58414 | FLNC | filamin C, gamma (actin binding protein 280) | −2.17 | 1.68 |
| Hs.80342 | KRT15 | keratin 15 | −1.68 | 1.32 |
| Hs.103042 | MAP1B | microtubule-associated protein 1B | −1.37 | 1.00 |
| Hs.433814 | MYL9 | myosin, light polypeptide 9, regulatory | −1.56 | 2.46 |
| Hs.162953 | MYRIP | myosin VIIA and Rab interacting protein | 1.36 | −1.96 |
| Hs.387905 | SPTAN1 | spectrin, alpha, non-erythrocytic 1 (alpha-fodrin) | −0.71 | 1.26 |
| Hs.163111 | SVIL | Supervillin | −1.34 | 1.49 |
| Hs.133892 | TPM1 | tropomyosin 1 (alpha) | −1.35 | 1.38 |
| Lipid metabolism | ||||
| Hs.403436 | DCI | dodecenoyl-Coenzyme A delta isomerase | 1.13 | −1.20 |
| Hs.446676 | LYPLA1 | lysophospholipase I | 1.18 | −1.14 |
| Hs.211587 | PLA2G4A | phospholipase A2, group IVA (cytosolic, calcium-dependent) | −0.71 | 1.68 |
| Protease/Protease inhibitor | ||||
| Hs.440961 | CAST | Calpastatin | −0.45 | 1.14 |
| Hs.83942 | CTSK | cathepsin K (pycnodysostosis) | −1.10 | 1.43 |
| Hs.117874 | PACE4 | paired basic amino acid cleaving system 4 | 1.20 | −1.43 |
| Hs.41072 | SERPINB6 | serine (or cysteine) proteinase inhibitor, clade B (ovalbumin), member 6 | 0.82 | −1.07 |
| Hs.173594 | SERPINF1 | serine (or cysteine) proteinase inhibitor, clade F, member 1 | −1.24 | 1.32 |
| Signal transduction | ||||
| Hs.256398 | ADAM22 | a disintegrin and metalloproteinase domain 22 | −1.23 | 1.00 |
| Hs.409783 | ANK2 | ankyrin 2, neuronal | −1.08 | 1.00 |
| Hs.6838 | ARHE | ras homolog gene family, member E | −1.35 | 1.68 |
| Hs.245540 | ARL4 | ADP-ribosylation factor-like 4 | −0.76 | 1.20 |
| Hs.444947 | C8FW | phosphoprotein regulated by mitogenic pathways | 1.38 | −3.31 |
| Hs.12436 | CAMK2G | calcium/calmodulin-dependent protein kinase (CaM kinase) II gamma | −1.57 | 3.92 |
| Hs.458426 | CCK | cholecystokinin | −1.37 | 1.89 |
| Hs.163867 | CD14 | CD14 antigen | 0.88 | −1.43 |
| Hs.352554 | CDC42EP3 | CDC42 effector protein (Rho GTPase binding) 3 | −1.11 | 2.10 |
| Hs.255526 | DTNA | dystrobrevin, alpha | −0.69 | 1.07 |
| Hs.117060 | ECM2 | extracellular matrix protein 2, female organ and adipocyte specific | −0.93 | 1.00 |
| Hs.211202 | EDNRA | endothelin receptor type A | −1.59 | 1.20 |
| Hs.82002 | EDNRB | endothelin receptor type B | −1.57 | 1.14 |
| Hs.381870 | EFEMP2 | EGF-containing fibulin-like extracellular matrix protein 2 | −1.25 | 1.89 |
| Hs.133968 | FRAG1 | FGF receptor activating protein 1 | 0.78 | −2.51 |
| Hs.74471 | GJA1 | gap junction protein, alpha 1, 43kDa (connexin 43) | −1.51 | 1.14 |
| Hs.265829 | ITGA3 | integrin, alpha 3 (antigen CD49C, alpha 3 subunit of VLA-3 receptor) | −1.23 | 2.54 |
| Hs.188021 | KCNH2 | potassium voltage-gated channel, subfamily H (eag-related), member 2 | −0.82 | 2.54 |
| Hs.446645 | KDELR2 | KDEL (Lys-Asp-Glu-Leu) endoplasmic reticulum protein retention receptor 2 | 0.53 | −1.00 |
| Hs.357004 | LOC169611 | hypothetical protein LOC169611 | −2.11 | 1.00 |
| Hs.21917 | LPHN3 | latrophilin 3 | −2.35 | 1.43 |
| Hs.155048 | LU | Lutheran blood group (Auberger b antigen included) | 1.57 | −1.63 |
| Hs.370849 | MADH7 | MAD, mothers against decapentaplegic homolog 7 (Drosophila) | −0.60 | 1.32 |
| Hs.61638 | MYO10 | myosin X | 1.35 | −1.20 |
| Hs.445402 | PCTK3 | PCTAIRE protein kinase 3 | −2.77 | 1.58 |
| Hs.77439 | PRKAR2B | protein kinase, cAMP-dependent, regulatory, type II, beta | −0.75 | 1.14 |
| Hs.349845 | PRKCB1 | protein kinase C, beta 1 | −1.36 | 1.58 |
| Hs.47438 | SH3BGR | SH3 domain binding glutamic acid-rich protein | −1.76 | 1.26 |
| Hs.169300 | TGFB2 | transforming growth factor, beta 2 | −1.53 | 1.96 |
| Hs.342874 | TGFBR3 | transforming growth factor, beta receptor III (betaglycan, 300kDa) | −1.47 | 1.85 |
| Hs.332173 | TLE2 | transducin-like enhancer of split 2 (E(sp1) homolog, Drosophila) | −0.55 | 1.38 |
| Hs.274329 | TP53AP1 | TP53 activated protein 1 | 0.91 | −1.00 |
| Hs.459470 | WSB2 | WD repeat and SOCS box-containing 2 | 0.88 | −1.14 |
| Hs.79474 | YWHAE | tyrosine 3-monooxygenase/tryptophan 5-monooxygenase activation protein, epsilon polypeptide | 1.10 | −1.26 |
| Transcription/Transcriptional regulation | ||||
| Hs.356416 | CBX7 | chromobox homolog 7 | −1.12 | 1.43 |
| Hs.405961 | CREB3L1 | cAMP responsive element binding protein 3-like 1 | 2.67 | −2.20 |
| Hs.43697 | ETV5 | ets variant gene 5 (ets-related molecule) | −3.64 | 1.54 |
| Hs.171262 | ETV6 | ets variant gene 6 (TEL oncogene) | −0.63 | 2.00 |
| Hs.331 | GTF3C1 | general transcription factor IIIC, polypeptide 1, alpha 220kDa | 0.90 | −1.14 |
| Hs.127428 | HOXA9 | homeo box A9 | 1.14 | −1.00 |
| Hs.134859 | MAF | v-maf musculoaponeurotic fibrosarcoma oncogene homolog (avian) | −0.87 | 2.23 |
| Hs.368950 | MEF2C | MADS box transcription enhancer factor 2, polypeptide C | −0.88 | 2.14 |
| Hs.443881 | PAXIP1L | PAX transcription activation domain interacting protein 1 like | 0.31 | −1.26 |
| Hs.3192 | PCBD | 6-pyruvoyl-tetrahydropterin synthase/dimerization cofactor of hepatocyte nuclear factor 1 alpha (TCF1) | 0.79 | −1.14 |
| Hs.432574 | POLR2H | polymerase (RNA) II (DNA directed) polypeptide H | 0.87 | −1.00 |
| Hs.78202 | SMARCA4 | SWI/SNF related, matrix associated, actin dependent regulator of chromatin, subfamily a, member 4 | 0.67 | −1.07 |
| Hs.444445 | SMARCD3 | SWI/SNF related, matrix associated, actin dependent regulator of chromatin, subfamily d, member 3 | −1.91 | 2.56 |
| Hs.173911 | ZNF24 | zinc finger protein 24 (KOX 17) | 0.46 | −1.58 |
| Hs.419763 | ZNF43 | zinc finger protein 43 (HTF6) | 0.39 | −1.07 |
| Transporter | ||||
| Hs.374535 | ATP2A2 | ATPase, Ca++ transporting, cardiac muscle, slow twitch 2 | −0.65 | 1.85 |
| Hs.343522 | ATP2B4 | ATPase, Ca++ transporting, plasma membrane 4 | −2.23 | 2.41 |
| Hs.1602 | DPYD | dihydropyrimidine dehydrogenase | −0.79 | 1.58 |
| Hs.31720 | HEPH | Hephaestin | −1.34 | 1.38 |
| Hs.188021 | KCNH2 | potassium voltage-gated channel, subfamily H (eag-related), member 2 | −0.82 | 2.54 |
| Hs.102308 | KCNJ8 | potassium inwardly-rectifying channel, subfamily J, member 8 | −0.92 | 1.07 |
| Hs.446645 | KDELR2 | KDEL (Lys-Asp-Glu-Leu) endoplasmic reticulum protein retention receptor 2 | 0.53 | −1.00 |
| Hs.101307 | SLC14A1 | solute carrier family 14 (urea transporter), member 1 (Kidd blood group) | −4.07 | 1.07 |
| Hs.84190 | SLC19A1 | solute carrier family 19 (folate transporter), member 1 | 2.54 | −1.14 |
| Hs.417948 | TCN2 | transcobalamin II; macrocytic anemia | −0.60 | 1.00 |
| Tumor suppressor gene/Oncogene | ||||
| Hs.171262 | ETV6 | ets variant gene 6 (TEL oncogene) | −0.63 | 1.07 |
| Hs.65029 | GAS1 | growth arrest-specific 1 | −1.67 | 1.14 |
| Hs.349470 | SNCG | synuclein, gamma (breast cancer-specific protein 1) | −3.68 | 1.89 |
| Hs.203557 | ST7 | suppression of tumorigenicity 7 | 0.35 | −2.61 |
| Hs.8022 | TU3A | TU3A protein | −1.42 | 1.14 |
| Other functions | ||||
| Hs.75313 | AKR1B1 | aldo-keto reductase family 1, member B1 (aldose reductase) | −0.67 | 1.49 |
| Hs.1227 | ALAD | aminolevulinate, delta-, dehydratase | −1.32 | 2.63 |
| Hs.153591 | ALG3 | asparagine-linked glycosylation 3 homolog (yeast, alpha-1,3-mannosyltransferase) | 0.44 | −1.00 |
| Hs.102 | AMT | aminomethyltransferase (glycine cleavage system protein T) | −0.80 | 1.43 |
| Hs.135554 | APG-1 | heat shock protein (hsp110 family) | −0.90 | 1.20 |
| Hs.78614 | C1QBP | complement component 1, q subcomponent binding protein | 0.75 | −1.00 |
| Hs.413482 | C21orf33 | chromosome 21 open reading frame 33 | 0.67 | −1.43 |
| Hs.323053 | DKFZp547K1113 | hypothetical protein DKFZp547K1113 | −0.76 | 1.20 |
| Hs.444619 | DXS9879E | DNA segment on chromosome X (unique) 9879 expressed sequence | 0.48 | −2.29 |
| Hs.511915 | ENO2 | enolase 2 (gamma, neuronal) | −1.85 | 1.49 |
| Hs.412103 | FLJ34588 | Smhs2 homolog (rat) | 0.66 | −1.20 |
| Hs.28264 | FLJ90798 | hypothetical protein FLJ90798 | −1.20 | 1.49 |
| Hs.386567 | GBP2 | guanylate binding protein 2, interferon-inducible | −0.92 | 1.32 |
| Hs.121017 | HIST1H2AE | histone 1, H2ae | 3.67 | −2.63 |
| Hs.417332 | HIST2H2AA | histone 2, H2aa | 1.47 | −1.14 |
| Hs.44024 | MRPL19 | Mitochondrial ribosomal protein L19 | 0.83 | −1.26 |
| Hs.9235 | NME4 | non-metastatic cells 4, protein expressed in | 0.87 | −1.20 |
| Hs.447045 | PPIL2 | Peptidylprolyl isomerase (cyclophilin)-like 2 | 0.61 | −1.00 |
| Hs.153355 | QKI | quaking homolog, KH domain RNA binding (mouse) | −0.49 | 1.14 |
| Hs.81256 | S100A4 | S100 calcium binding protein A4 | −2.59 | 2.17 |
| Hs.288215 | SIAT7B | sialyltransferase 7 B | −0.95 | 1.26 |
| Hs.511400 | SND1 | staphylococcal nuclease domain containing 1 | 0.97 | −1.00 |
| Hs.498154 | SNX1 | sorting nexin 1 | −0.93 | 1.43 |
| Hs.2943 | SRP19 | signal recognition particle 19kDa | 0.97 | −1.63 |
| Hs.326 | TARBP2 | TAR (HIV) RNA binding protein 2 | 0.57 | −1.07 |
| Hs.8752 | TMEM4 | transmembrane protein 4 | 1.00 | −1.26 |
| Hs.112986 | TMEM5 | transmembrane protein 5 | 0.72 | −1.07 |
| Hs.370530 | TRIM14 | tripartite motif-containing 14 | 0.65 | −1.07 |
| Hs.66708 | VAMP3 | vesicle-associated membrane protein 3 (cellubrevin) | −0.49 | 1.68 |
| Unknown | ||||
| Hs.148258 | BC008967 | hypothetical gene BC008967 | −1.59 | 1.32 |
| Hs.277888 | CG018 | hypothetical gene CG018 | −0.9 | 1.68 |
| Hs.425144 | CRA | cisplatin resistance associated | −4.91 | 3.09 |
| Hs.183650 | CRABP2 | cellular retinoic acid binding protein 2 | −1.93 | 1.49 |
| Hs.108080 | CSRP1 | cysteine and glycine-rich protein 1 | −1.53 | 1.32 |
| Hs.200692 | DKFZP564G2022 | DKFZP564G2022 protein | 1.15 | −1.32 |
| Hs.75486 | FBXL8 | F-box and leucine-rich repeat protein 8 | −0.81 | 1.43 |
| Hs.7358 | FLJ13110 | hypothetical protein FLJ13110 | −0.80 | 2.07 |
| Hs.242271 | HHL | expressed in hematopoietic cells, heart, liver | −1.67 | 1.00 |
| Hs.236774 | HMGN4 | high mobility group nucleosomal binding domain 4 | −0.55 | 1.07 |
| Hs.18705 | KIAA1233 | KIAA1233 protein | −1.44 | 1.00 |
| Hs.234265 | LAP1B | lamina-associated polypeptide 1B | −0.51 | 1.00 |
| Hs.443881 | PAXIP1L | PAX transcription activation domain interacting protein 1 like | 0.31 | −1.26 |
| Hs.78748 | RIMS3 | regulating synaptic membrane exocytosis 3 | −3.96 | 1.00 |
| Hs.98259 | SAMD4 | sterile alpha motif domain containing 4 | −2.01 | 1.49 |
| Hs.76536 | TBL1X | transducin (beta)-like 1X-linked | −1.07 | 1.32 |
| Hs.27860 | MRNA; cDNA DKFZp586M0723 (from clone DKFZp586M0723) | −2.88 | 1.38 | |
| Hs.458282 | Transcribed sequence with strong similarity to protein ref:NP_065136.1 (H.sapiens) protocadherin 9 precursor; cadherin superfamily protein VR4-11 | −2.62 | 2.23 | |
| Hs.98314 | cDNA DKFZp586L0120 (from clone DKFZp586L0120) | −1.86 | 1.14 | |
| Hs.468490 | hypothetical protein FLJ20489 | −1.25 | 1.58 | |
For PC-3, the ratio is the maximum value of the data points from all the time- and concentration-series of selenium treatment. For PCa, it is the average tumor to normal ratio.
Selenium reverses the effect of androgen on the expression of androgen-regulated genes
In an attempt to identify the androgen-regulated genes of which the expression is opposed by selenium, we compared the list of androgen-regulated genes (422 genes) to the list of selenium-responsive genes in LNCaP (1,031 genes). A partial summary of our analysis is shown in Table V. The AR (androgen-regulated) column shows the genes which are sensitive to androgen. A positive sign means up-regulation, while a minus means down-regulation. A total of 92 genes were found to be present in both datasets. As a control, a list of 1,031 genes were selected randomly from the selenium LNCaP dataset, and compared with the list of androgen-regulated genes to identify genes in common. This process was repeated 10 times, and the number of overlap was 30.4±1.6 (mean±SEM), which is significantly less than the actual number of 92 genes common to the androgen and selenium datasets (p<0.0005). Out of these 92 genes, only 38 genes (~41%) are reciprocally modulated by androgen and selenium (Table V). These 38 genes are the ones presented in Table V. In the Discussion, we will offer additional explanation of why only a fraction of AR-targets are oppositely modulated by androgen and selenium, even though selenium is a potent inhibitor of androgen signaling.
Table V.
Selenium reverses the expression of androgen-regulated genes
| UniGene ID | Symbol | Gene description | Maximum Fold (log2)#
|
|
|---|---|---|---|---|
| AR | Se | |||
| Cell proliferation | ||||
| Hs.8230 | ADAMTS1 | a disintegrin-like and metalloprotease with thrombospondin type 1 motif, 1 | 2.00 | −1.66 |
| Hs.13291 | CCNG2 | cyclin G2 | −2.82 | 1.46 |
| Hs.405958 | CDC6 | CDC6 cell division cycle 6 homolog (S. cerevisiae) | 1.28 | −1.99 |
| Hs.374378 | CKS1B | CDC28 protein kinase regulatory subunit 1B | 1.23 | −1.84 |
| Hs.119324 | KIF22 | kinesin family member 22 | 1.54 | −1.08 |
| Signal transduction | ||||
| Hs.197922 | CaMKIINalpha | calcium/calmodulin-dependent protein kinase II | −3.43 | 1.41 |
| Hs.78888 | DBI | diazepam binding inhibitor | 2.00 | −1.69 |
| Hs.433488 | GUCY1A3* | guanylate cyclase 1, soluble, alpha 3 | 1.72 | −1.53 |
| Hs.81328 | NFKBIA | nuclear factor of kappa light polypeptide | ||
| gene enhancer in B-cells inhibitor, alpha | 1.68 | −1.78 | ||
| Hs.154151 | PTPRM | protein tyrosine phosphatase, receptor type, M | 1.33 | −1.74 |
| Hs.432842 | RALGPS1A | Ral guanine nucleotide exchange factor RalGPS1A | −1.28 | 1.21 |
| Transcriptional regulation | ||||
| Hs.55999 | NKX3-1 | NK3 transcription factor related, locus 1 (Drosophila) | 3.90 | −1.47 |
| Hs.408222 | PBX1* | pre-B-cell leukemia transcription factor 1 | −1.98 | 1.29 |
| Transporter | ||||
| Hs.307915 | ABCC4* | ATP-binding cassette, sub-family C (CFTR/MRP), member 4 | 2.96 | −1.08 |
| Hs.20952 | ATP2B1 | ATPase, Ca++ transporting, plasma membrane 1 | −1.76 | 2.53 |
| Metabolism | ||||
| Hs.75616 | DHCR24* | 24-dehydrocholesterol reductase | 2.58 | −1.07 |
| Hs.35198 | ENPP5 | ectonucleotide pyrophosphatase/phosphodiesterase 5 (putative function) | −1.78 | 1.01 |
| Hs.268012 | FACL3* | fatty-acid-Coenzyme A ligase, long-chain 3 | 3.98 | −1.14 |
| Hs.167531 | MCCC2 | methylcrotonoyl-Coenzyme A carboxylase 2 (beta) | 1.98 | −1.27 |
| Hs.237323 | PGM3 | phosphoglucomutase 3 | 2.07 | −1.16 |
| Hs.119597 | SCD | stearoyl-CoA desaturase (delta-9-desaturase) | 2.56 | −2.29 |
| Other functions | ||||
| Hs.6790 | DNAJB9 | DnaJ (Hsp40) homolog, subfamily B, member 9 | 2.00 | −2.05 |
| Hs.173381 | DPYSL2* | dihydropyrimidinase-like 2 | −1.75 | 1.14 |
| Hs.181350 | KLK2* | kallikrein 2, prostatic | 3.17 | −2.27 |
| Hs.171995 | KLK3* | kallikrein 3, (prostate specific antigen) | 3.35 | −2.45 |
| Hs.423095 | NUCB2 | nucleobindin 2 | −3.18 | 1.36 |
| Hs.171952 | OCLN | Occluding | −2.01 | 1.34 |
| Hs.188361 | RPS6KA3 | ribosomal protein S6 kinase, 90kDa, polypeptide 3 | 1.44 | −1.21 |
| Hs.152207 | SSBP2 | single-stranded DNA binding protein 2 | −1.59 | 1.72 |
| Unknown | ||||
| Hs.180197 | LOC375504 (LOC375504), mRNA | −1.42 | 1.63 | |
| Hs.22247 | CDNA FLJ42250 fis, clone TKIDN2007828 | 2.40 | −1.04 | |
| Hs.29189 | ATP11A | ATPase, Class VI, type 11A | −2.75 | 1.27 |
| Hs.512643 | AZGP1 | alpha-2-glycoprotein 1, zinc | 2.49 | −1.86 |
| Hs.7557 | FKBP5 | FK506 binding protein 5 | 4.67 | −1.20 |
| Hs.90797 | LOC129642 | hypothetical protein BC016005 | 3.90 | −1.40 |
| Hs.298646 | PRO2000 | PRO2000 protein | 3.28 | −1.76 |
| Hs.203557 | ST7 | suppression of tumorigenicity 7 | −2.07 | 1.14 |
the maximum value of the data points from all the time- and concentration-series of MSA or R1881 treatment.
Genes implicated in prostate cancinogenesis.
Discussion
Using prostate cancer chemoprevention as a research problem, Williams and Brooks (34) recently made a poignant commentary that microarray analysis holds great promise in unraveling the mechanisms of anticancer agents. Here we report, for the first time, a data mining approach to gain insight into the mechanisms of selenium utilizing published microarray datasets. The paradigm combines laboratory- and bioinformatics-based research to identify molecular targets or biomarkers of prostate cancer intervention by selenium. We recognize that this approach is only a first step in the discovery process. Nonetheless, the information extracted from this kind of analysis has significant potential in generating new leads to guide future research endeavors.
Rhodes et al. recently reported a meta-analysis of four datasets from prostate cancer gene expression profiling studies (35). Our study differs from the Rhodes study in a number of ways. First, two of the largest available datasets by Lapointe et al. (9) and Singh et al. (7) were not included in their analysis. Second, the Rhodes study compared localized prostate cancer to benign prostate tissue. The latter was inclusive of both normal prostate and benign prostatic hyperplasia (BPH). It has been reported that normal prostate and BPH have distinct gene expression patterns (36,37). Therefore, combining normal prostate and BPH into one single group could obscure some of the differences between normal and cancerous prostate. Third, instead of using a meta-analysis, we performed permutation t-test on each of the three datasets because they are large enough to generate independent and statistically verifiable information on their own. As a validation of our approach, the majority (~80%) of the top 40 over- and underexpressed genes of the Rhodes study are also present in our analysis (See our website). Additionally, our analysis picked up a few more genes (not found in the Rhodes paper) that are well known to be deregulated in prostate cancer, such as KLK2, KLK3 (PSA) (see our website), GSTP1, and SERPINB5 (Table IB).
We have identified 42 genes which are dysregulated in prostate cancer and are counter-regulated by selenium in both LNCaP and PC3 cells (Table II). In order to assess the significance of this analysis, we compared the functions of these genes with those of the 25 genes which are similarly regulated in prostate cancer and by selenium and found two major differences. First, there is no tumor suppressor gene modulated in the same direction in prostate cancer and by selenium. In contrast, there are four tumor suppressor genes which are down-regulated in prostate cancer, but are found to be up-regulated by selenium (Table II). Second, there is only one cell cycle regulatory gene modulated in the same direction in prostate cancer and by selenium. In contrast, there are five cell cycle regulatory genes (ATF5, AHR, CDKN1C, EXT1, and CHC1) which are modulated in opposite directions in prostate cancer and by selenium (Table II). More interestingly, selenium alters the expression of these genes in a manner that is consistent with growth inhibition.
In androgen-responsive prostate cancer, AR signaling is such a dominant pathway that shutting it down is likely to be sufficient for growth inhibition. Our previous publication showed that selenium markedly down-regulates AR signaling in LNCaP cells (5). Furthermore, we were able to confirm that overexpression of AR diminishes the sensitivity to selenium (unpublished data), suggesting that disruption of AR signaling by selenium is biologically relevant. Additionally, selenium is known to modulate a diverse number of cell cycle and apoptosis regulatory molecules, as well as survival signaling molecules, in different cell types regardless of the presence or absence of AR. Different cell types may present both common and unique targets to selenium intervention. Thus, it is apparent that selenium has many targets and there is no one key mechanism to account for the anticancer effect of selenium. The multitude of genes in Table II lends support to common mechanisms for the anticancer activity of selenium in both the androgen-responsive LNCaP cells and the androgen-unresponsive PC-3 cells. However, despite the overall similarity of their cellular responses to selenium, subtle differences exist between the two cell types. For example, selenium slows down cell cycle progression at multiple transition points in PC-3 (5), whereas mostly through G1 arrest in LNCaP (unpublished data). Genes distinctly targeted by selenium in these cells, as presented in Tables III and IV, could be attributable to the above disparities. They might also reflect the difference in genetic background such as response to androgen. Indeed, a noticeable distinction between Table III and Table IV is the presence of androgen-regulated genes in Table III.
Our analysis has identified 92 genes that are regulated by both selenium and androgen. However, only a modest proportion (38 out of 92) of these genes are modulated in reciprocal directions by selenium and androgen. A possible explanation for this is that genes have multiple regulatory elements, both positive and negative, in their promoter regions. Selenium is known to alter the expression of many transcription factors, co-activators and co-repressors (5). AR regulates the expression of its targets through both direct and indirect mechanisms. In other words, many other transcription factors and co-regulators are likely to be involved by virtue of the rippling effect initiated through AR signaling. Thus, it is to be expected that selenium could counteract the expression of some, but not all, androgen-regulated genes. The litmus test in the future is to study which AR-regulated genes sensitive to selenium reversal are important for modulation of prostate cancer risk.
The induction of forkhead O1A (FOXO1A) by selenium in both LNCaP and PC-3 cells is of special interest to us. FOXO1A is a member of the FOXO family of transcription factors, that induce the expression of pro-apoptotic genes including Fas ligand (38–40), bcl-2 family proteins (19,40,41), and TRAIL (20). Furthermore, FOXO1A is involved in cell cycle arrest (21). FOXO1A is phosphorylated and suppressed by AKT (42,43), which is an important survival molecule for prostate cancer (44). Androgen receptor (AR) also interacts with FOXO1A and inhibits its activation of Fas ligand expression (45). Selenium conveniently down-regulates both AKT and AR signaling (4,46). As shown in Figure 2, the stimulatory effect of selenium on FOXO1A signaling could be due to a direct induction of FOXO1A transcription coupled to an indirect activation of FOXO1A by alleviating the inhibitory modulation through AR and/or AKT.
Figure 2.
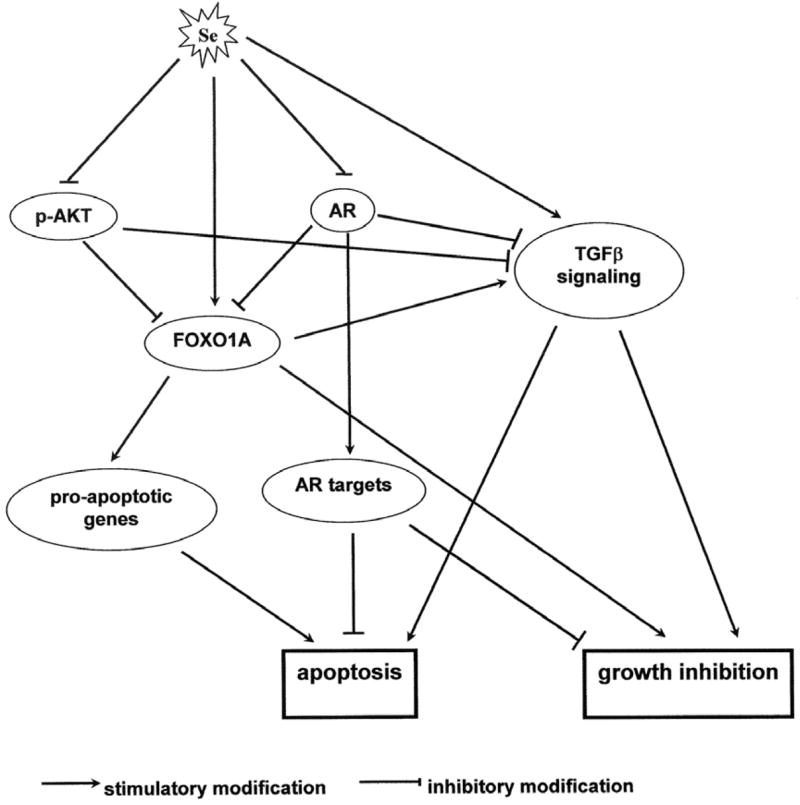
Proposed model of apoptosis induction and growth inhibition by selenium through the interplay of AKT, AR, and TGFβ signaling pathways.
Three key components of the transforming growth factor β (TGFβ) signaling pathway are consistently repressed in a large set of primary prostate tumors. These genes are TGFβ2, TGFβ receptor type II, and TGFβ receptor type III. Type I and II receptors have serine/threonine protein kinase domains and are directly involved in TGFβ signaling (47). Type III receptor does not have an intrinsic signaling domain; however, it facilitates the binding of all TGFβs, and especially TGFβ2, to the type II receptor (47). TGFβ is a pleiotropic cytokine, but is mainly a growth inhibitor of epithelial cancer, particularly at the early stage of development (48). It has been shown that the type I and II receptors are down-regulated in prostate cancer (49,50) and that loss of expression of the receptors is associated with poor prognosis (51). Therefore, from a prevention standpoint, stimulating TGFβ signaling is likely to produce a desirable outcome. In this study, we found that the expression of TGFβ2, TGFβ type II and III receptors is concertedly up-regulated by selenium. It is also worth mentioning that the expression of TGFβ2 is known to be induced by a forkhead transcription factor closely related to FOXO1A (52) and that both AR and AKT repress TGFβ signaling (53). Thus, the effect of selenium could be amplified by the crosstalk of TGFβ, AKT, and AR signals as illustrated in Figure 2. Our future research efforts will be directed towards elucidating the contribution of these pathways in selenium chemoprevention of prostate cancer.
Acknowledgments
This work was supported by a Department of Defense Postdoctoral Fellowship Award and an AACR-Cancer Research Foundation of the America Fellowship in Prevention Research Award, grant 62-2141 from the Roswell Park Alliance Foundation, grant CA91990 from the National Cancer Institute, and also in part by Cancer Center Support Grant P30 CA16056 awarded to RPCI from the National Cancer Institute, U.S.A. H. Zhao is supported by a Postdoctoral Traineeship Award from the United States Army MRMC Prostate Cancer Research Program (Award Number W81XWH-04-1-0080). The authors are grateful to Dorothy Donovan and Cathy Russin for their excellent technical assistance.
Abbreviations
- AR
androgen receptor
- ARE
androgen responsive element
- MSA
methylseleninic acid
- PCa
prostate cancer
- PSA
prostate specific antigen
- TGFβ
transforming growth factor β
References
- 1.Clark LC, Combs GF, Jr, Turnbull BW, Slate EH, Chalker DK, Chow J, Davis LS, Glover RA, Graham GF, Gross EG, Krongrad A, Lesher JL, Jr, Park HK, Sanders BB, Jr, Smith CL, Taylor JR. Effects of selenium supplementation for cancer prevention in patients with carcinoma of the skin. A randomized controlled trial Nutritional Prevention of Cancer Study Group. JAMA. 1996;276:1957–1963. [PubMed] [Google Scholar]
- 2.Clark LC, Dalkin B, Krongrad A, Combs GF, Jr, Turnbull BW, Slate EH, Witherington R, Herlong JH, Janosko E, Carpenter D, Borosso C, Falk S, Rounder J. Decreased incidence of prostate cancer with selenium supplementation: results of a double-blind cancer prevention trial. Br J Urol. 1998;81:730–734. doi: 10.1046/j.1464-410x.1998.00630.x. [DOI] [PubMed] [Google Scholar]
- 3.Duffield-Lillico AJ, Dalkin BL, Reid ME, Turnbull BW, Slate EH, Jacobs ET, Marshall JR, Clark LC. Selenium supplementation, baseline plasma selenium status and incidence of prostate cancer: an analysis of the complete treatment period of the Nutritional Prevention of Cancer Trial. BJU Int. 2003;91:608–612. doi: 10.1046/j.1464-410x.2003.04167.x. [DOI] [PubMed] [Google Scholar]
- 4.Dong Y, Lee SO, Zhang H, Marshall J, Gao AC, Ip C. Prostate specific antigen expression is down-regulated by selenium through disruption of androgen receptor signaling. Cancer Res. 2004;64:19–22. doi: 10.1158/0008-5472.can-03-2789. [DOI] [PubMed] [Google Scholar]
- 5.Dong Y, Zhang H, Hawthorn L, Ganther HE, Ip C. Delineation of the molecular basis for selenium-induced growth arrest in human prostate cancer cells by oligonucleotide array. Cancer Res. 2003;63:52–59. [PubMed] [Google Scholar]
- 6.Zhao H, Whitfield ML, Xu T, Botstein D, Brooks JD. Diverse effects of methylseleninic acid on the transcriptional program of human prostate cancer cells. Mol Biol Cell. 2004;15:506–519. doi: 10.1091/mbc.E03-07-0501. [DOI] [PMC free article] [PubMed] [Google Scholar]
- 7.Singh D, Febbo PG, Ross K, Jackson DG, Manola J, Ladd C, Tamayo P, Renshaw AA, D'Amico AV, Richie JP, Lander ES, Loda M, Kantoff PW, Golub TR, Sellers WR. Gene expression correlates of clinical prostate cancer behavior. Cancer Cell. 2002;1:203–209. doi: 10.1016/s1535-6108(02)00030-2. [DOI] [PubMed] [Google Scholar]
- 8.Welsh JB, Sapinoso LM, Su AI, Kern SG, Wang-Rodriguez J, Moskaluk CA, Frierson HF, Jr, Hampton GM. Analysis of gene expression identifies candidate markers and pharmacological targets in prostate cancer. Cancer Res. 2001;61:5974–5978. [PubMed] [Google Scholar]
- 9.Lapointe J, Li C, Higgins JP, van de RM, Bair E, Montgomery K, Ferrari M, Egevad L, Rayford W, Bergerheim U, Ekman P, DeMarzo AM, Tibshirani R, Botstein D, Brown PO, Brooks JD, Pollack JR. Gene expression profiling identifies clinically relevant subtypes of prostate cancer. Proc Natl Acad Sci USA. 2004;101:811–816. doi: 10.1073/pnas.0304146101. [DOI] [PMC free article] [PubMed] [Google Scholar]
- 10.Jenster G. The role of the androgen receptor in the development and progression of prostate cancer. Semin Oncol. 1999;26:407–421. [PubMed] [Google Scholar]
- 11.DePrimo SE, Diehn M, Nelson JB, Reiter RE, Matese J, Fero M, Tibshirani R, Brown PO, Brooks JD. Transcriptional programs activated by exposure of human prostate cancer cells to androgen. Genome Biol. 2002;3:RESEARCH0032. doi: 10.1186/gb-2002-3-7-research0032. [DOI] [PMC free article] [PubMed] [Google Scholar]
- 12.Nelson PS, Clegg N, Arnold H, Ferguson C, Bonham M, White J, Hood L, Lin B. The program of androgen-responsive genes in neoplastic prostate epithelium. Proc Natl Acad Sci USA. 2002;99:11890–11895. doi: 10.1073/pnas.182376299. [DOI] [PMC free article] [PubMed] [Google Scholar]
- 13.Kaminski N, Allard JD, Pittet JF, Zuo F, Griffiths MJ, Morris D, Huang X, Sheppard D, Heller RA. Global analysis of gene expression in pulmonary fibrosis reveals distinct programs regulating lung inflammation and fibrosis. Proc Natl Acad Sci USA. 2000;97:1778–1783. doi: 10.1073/pnas.97.4.1778. [DOI] [PMC free article] [PubMed] [Google Scholar]
- 14.Wang Y, Rea T, Bian J, Gray S, Sun Y. Identification of the genes responsive to etoposide-induced apoptosis: application of DNA chip technology. FEBS Lett. 1999;445:269–273. doi: 10.1016/s0014-5793(99)00136-2. [DOI] [PubMed] [Google Scholar]
- 15.Puga A, Xia Y, Elferink C. Role of the aryl hydrocarbon receptor in cell cycle regulation. Chem Biol Interact. 2002;141:117–130. doi: 10.1016/s0009-2797(02)00069-8. [DOI] [PubMed] [Google Scholar]
- 16.Ohtsubo M, Kai R, Furuno N, Sekiguchi T, Sekiguchi M, Hayashida H, Kuma K, Miyata T, Fukushige S, Murotsu T, et al. Isolation and characterization of the active cDNA of the human cell cycle gene (RCC1) involved in the regulation of onset of chromosome condensation. Genes Dev. 1987;1:585–593. doi: 10.1101/gad.1.6.585. [DOI] [PubMed] [Google Scholar]
- 17.Matsuoka S, Edwards MC, Bai C, Parker S, Zhang P, Baldini A, Harper JW, Elledge SJ. p57KIP2, a structurally distinct member of the p21CIP1 Cdk inhibitor family, is a candidate tumor suppressor gene. Genes Dev. 1995;9:650–662. doi: 10.1101/gad.9.6.650. [DOI] [PubMed] [Google Scholar]
- 18.Persengiev SP, Devireddy LR, Green MR. Inhibition of apoptosis by ATFx: a novel role for a member of the ATF/CREB family of mammalian bZIP transcription factors. Genes Dev. 2002;16:1806–1814. doi: 10.1101/gad.992202. [DOI] [PMC free article] [PubMed] [Google Scholar]
- 19.Gilley J, Coffer PJ, Ham J. FOXO transcription factors directly activate bim gene expression and promote apoptosis in sympathetic neurons. J Cell Biol. 2003;162:613–622. doi: 10.1083/jcb.200303026. [DOI] [PMC free article] [PubMed] [Google Scholar]
- 20.Modur V, Nagarajan R, Evers BM, Milbrandt J. FOXO proteins regulate tumor necrosis factor-related apoptosis inducing ligand expression. Implications for PTEN mutation in prostate cancer. J Biol Chem. 2002;277:47928–47937. doi: 10.1074/jbc.M207509200. [DOI] [PubMed] [Google Scholar]
- 21.Nakamura N, Ramaswamy S, Vazquez F, Signoretti S, Loda M, Sellers WR. Forkhead transcription factors are critical effectors of cell death and cell cycle arrest downstream of PTEN. Mol Cell Biol. 2000;20:8969–8982. doi: 10.1128/mcb.20.23.8969-8982.2000. [DOI] [PMC free article] [PubMed] [Google Scholar]
- 22.Cher ML, Biliran HR, Jr, Bhagat S, Meng Y, Che M, Lockett J, Abrams J, Fridman R, Zachareas M, Sheng S. Maspin expression inhibits osteolysis, tumor growth, and angiogenesis in a model of prostate cancer bone metastasis. Proc Natl Acad Sci USA. 2003;100:7847–7852. doi: 10.1073/pnas.1331360100. [DOI] [PMC free article] [PubMed] [Google Scholar]
- 23.Zou Z, Anisowicz A, Hendrix MJ, Thor A, Neveu M, Sheng S, Rafidi K, Seftor E, Sager R. Maspin, a serpin with tumor-suppressing activity in human mammary epithelial cells. Science. 1994;263:526–529. doi: 10.1126/science.8290962. [DOI] [PubMed] [Google Scholar]
- 24.Bass R, Fernandez AM, Ellis V. Maspin inhibits cell migration in the absence of protease inhibitory activity. J Biol Chem. 2002;277:46845–46848. doi: 10.1074/jbc.C200532200. [DOI] [PubMed] [Google Scholar]
- 25.Chen Z, Fan Z, McNeal JE, Nolley R, Caldwell MC, Mahadevappa M, Zhang Z, Warrington JA, Stamey TA. Hepsin and maspin are inversely expressed in laser capture microdissectioned prostate cancer. J Urol. 2003;169:1316–1319. doi: 10.1097/01.ju.0000050648.40164.0d. [DOI] [PubMed] [Google Scholar]
- 26.Lee HK, Driscoll D, Asch H, Asch B, Zhang PJ. Downregulated gelsolin expression in hyperplastic and neoplastic lesions of the prostate. Prostate. 1999;40:14–19. doi: 10.1002/(sici)1097-0045(19990615)40:1<14::aid-pros2>3.0.co;2-6. [DOI] [PubMed] [Google Scholar]
- 27.Asch HL, Head K, Dong Y, Natoli F, Winston JS, Connolly JL, Asch BB. Widespread loss of gelsolin in breast cancers of humans, mice, and rats. Cancer Res. 1996;56:4841–4845. [PubMed] [Google Scholar]
- 28.Dosaka-Akita H, Hommura F, Fujita H, Kinoshita I, Nishi M, Morikawa T, Katoh H, Kawakami Y, Kuzumaki N. Frequent loss of gelsolin expression in non-small cell lung cancers of heavy smokers. Cancer Res. 1998;58:322–327. [PubMed] [Google Scholar]
- 29.Tanaka M, Mullauer L, Ogiso Y, Fujita H, Moriya S, Furuuchi K, Harabayashi T, Shinohara N, Koyanagi T, Kuzumaki N. Gelsolin: a candidate for suppressor of human bladder cancer. Cancer Res. 1995;55:3228–3232. [PubMed] [Google Scholar]
- 30.Trompouki E, Hatzivassiliou E, Tsichritzis T, Farmer H, Ashworth A, Mosialos G. CYLD is a deubiquitinating enzyme that negatively regulates NF-kappaB activation by TNFR family members. Nature. 2003;424:793–796. doi: 10.1038/nature01803. [DOI] [PubMed] [Google Scholar]
- 31.Castro P, Liang H, Liang JC, Nagarajan L. A novel, evolutionarily conserved gene family with putative sequence-specific single-stranded DNA-binding activity. Genomics. 2002;80:78–85. doi: 10.1006/geno.2002.6805. [DOI] [PubMed] [Google Scholar]
- 32.Semba K, Nishizawa M, Miyajima N, Yoshida MC, Sukegawa J, Yamanashi Y, Sasaki M, Yamamoto T, Toyoshima K. yes-related protooncogene, syn, belongs to the protein-tyrosine kinase family. Proc Natl Acad Sci USA. 1986;83:5459–5463. doi: 10.1073/pnas.83.15.5459. [DOI] [PMC free article] [PubMed] [Google Scholar]
- 33.Chen D, Guo J, Miki T, Tachibana M, Gahl WA. Molecular cloning of two novel rab genes from human melanocytes. Gene. 1996;174:129–134. doi: 10.1016/0378-1119(96)00509-4. [DOI] [PubMed] [Google Scholar]
- 34.Williams ED, Brooks JD. New molecular approaches for identifying novel targets, mechanisms and biomarkers for prostate cancer chemopreventive agents. Urology. 2001;57:100–102. doi: 10.1016/s0090-4295(00)00951-1. [DOI] [PubMed] [Google Scholar]
- 35.Rhodes DR, Barrette TR, Rubin MA, Ghosh D, Chinnaiyan AM. Meta-analysis of microarrays: interstudy validation of gene expression profiles reveals pathway dysregulation in prostate cancer. Cancer Res. 2002;62:4427–4433. [PubMed] [Google Scholar]
- 36.Luo J, Dunn T, Ewing C, Sauvageot J, Chen Y, Trent J, Isaacs W. Gene expression signature of benign prostatic hyperplasia revealed by cDNA microarray analysis. Prostate. 2002;51:189–200. doi: 10.1002/pros.10087. [DOI] [PubMed] [Google Scholar]
- 37.Prakash K, Pirozzi G, Elashoff M, Munger W, Waga I, Dhir R, Kakehi Y, Getzenberg RH. Symptomatic and asymptomatic benign prostatic hyperplasia: molecular differentiation by using microarrays. Proc Natl Acad Sci USA. 2002;99:7598–7603. doi: 10.1073/pnas.112191399. [DOI] [PMC free article] [PubMed] [Google Scholar]
- 38.Kavurma MM, Khachigian LM. Signaling and transcriptional control of Fas ligand gene expression. Cell Death Differ. 2003;10:36–44. doi: 10.1038/sj.cdd.4401179. [DOI] [PubMed] [Google Scholar]
- 39.Suhara T, Kim HS, Kirshenbaum LA, Walsh K. Suppression of Akt signaling induces Fas ligand expression: involvement of caspase and Jun kinase activation in Akt-mediated Fas ligand regulation. Mol Cell Biol. 2002;22:680–691. doi: 10.1128/MCB.22.2.680-691.2002. [DOI] [PMC free article] [PubMed] [Google Scholar]
- 40.Dijkers PF, Medema RH, Lammers JW, Koenderman L, Coffer PJ. Expression of the pro-apoptotic Bcl-2 family member Bim is regulated by the forkhead transcription factor FKHR-L1. Curr Biol. 2000;10:1201–1204. doi: 10.1016/s0960-9822(00)00728-4. [DOI] [PubMed] [Google Scholar]
- 41.Tang TT, Dowbenko D, Jackson A, Toney L, Lewin DA, Dent AL, Lasky LA. The forkhead transcription factor AFX activates apoptosis by induction of the BCL-6 transcriptional repressor. J Biol Chem. 2002;277:14255–14265. doi: 10.1074/jbc.M110901200. [DOI] [PubMed] [Google Scholar]
- 42.Tang ED, Nunez G, Barr FG, Guan KL. Negative regulation of the forkhead transcription factor FKHR by Akt. J Biol Chem. 1999;274:16741–16746. doi: 10.1074/jbc.274.24.16741. [DOI] [PubMed] [Google Scholar]
- 43.Guo S, Rena G, Cichy S, He X, Cohen P, Unterman T. Phosphorylation of serine 256 by protein kinase B disrupts transactivation by FKHR and mediates effects of insulin on insulin-like growth factor-binding protein-1 promoter activity through a conserved insulin response sequence. J Biol Chem. 1999;274:17184–17192. doi: 10.1074/jbc.274.24.17184. [DOI] [PubMed] [Google Scholar]
- 44.Lin J, Adam RM, Santiestevan E, Freeman MR. The phosphatidylinositol 3′-kinase pathway is a dominant growth factor-activated cell survival pathway in LNCaP human prostate carcinoma cells. Cancer Res. 1999;59:2891–2897. [PubMed] [Google Scholar]
- 45.Li P, Lee H, Guo S, Unterman TG, Jenster G, Bai W. AKT-independent protection of prostate cancer cells from apoptosis mediated through complex formation between the androgen receptor and FKHR. Mol Cell Biol. 2003;23:104–118. doi: 10.1128/MCB.23.1.104-118.2003. [DOI] [PMC free article] [PubMed] [Google Scholar]
- 46.Jiang C, Wang Z, Ganther H, Lu J. Distinct effects of methylseleninic acid versus selenite on apoptosis, cell cycle, and protein kinase pathways in DU145 human prostate cancer cells. Mol Cancer Ther. 2002;1:1059–1066. [PubMed] [Google Scholar]
- 47.Massague J. TGF-beta signal transduction. Annu Rev Biochem. 1998;67:753–791. doi: 10.1146/annurev.biochem.67.1.753. [DOI] [PubMed] [Google Scholar]
- 48.Moses HL, Yang EY, Pietenpol JA. Regulation of epithelial proliferation by TGF-beta. Ciba Found Symp. 1991;157:66–74. doi: 10.1002/9780470514061.ch5. [DOI] [PubMed] [Google Scholar]
- 49.Eastham JA, Truong LD, Rogers E, Kattan M, Flanders KC, Scardino PT, Thompson TC. Transforming growth factor-beta 1: comparative immunohistochemical localization in human primary and metastatic prostate cancer. Lab Invest. 1995;73:628–635. [PubMed] [Google Scholar]
- 50.Williams RH, Stapleton AM, Yang G, Truong LD, Rogers E, Timme TL, Wheeler TM, Scardino PT, Thompson TC. Reduced levels of transforming growth factor beta receptor type II in human prostate cancer: an immunohistochemical study. Clin Cancer Res. 1996;2:635–640. [PubMed] [Google Scholar]
- 51.Kim IY, Ahn HJ, Lang S, Oefelein MG, Oyasu R, Kozlowski JM, Lee C. Loss of expression of transforming growth factor-beta receptors is associated with poor prognosis in prostate cancer patients. Clin Cancer Res. 1998;4:1625–1630. [PubMed] [Google Scholar]
- 52.Samatar AA, Wang L, Mirza A, Koseoglu S, Liu S, Kumar CC. Transforming growth factor-beta 2 is a transcriptional target for Akt/protein kinase B via forkhead transcription factor. J Biol Chem. 2002;277:28118–28126. doi: 10.1074/jbc.M203686200. [DOI] [PubMed] [Google Scholar]
- 53.Chipuk JE, Cornelius SC, Pultz NJ, Jorgensen JS, Bonham MJ, Kim SJ, Danielpour D. The androgen receptor represses transforming growth factor-beta signaling through interaction with Smad3. J Biol Chem. 2002;277:1240–1248. doi: 10.1074/jbc.M108855200. [DOI] [PubMed] [Google Scholar]