

Summary
One of the major causes of failure in the treatment of breast cancer is the occurrence of metastasis, the spreading of the primary tumor to distant organs. It is thus important to intervene at a key step of metastatic process, such as angiogenesis, for effective breast cancer treatment. Vascular endothelial growth factor (VEGF) plays a pivotal role in tumor angiogenesis. Because degree of tumor malignancy directly correlates with the expression of VEGF but inversely correlates with the expression of tumor suppressor gene p16, we examined whether restoration of p16 in breast cancer cells that lack p16 expression would modulate VEGF expression, and if so, how are the effects of p16 expression on tumor angiogenesis and metastasis. To facilitate induction of p16 expression, a recombinant adenovirus expressing p16 (AdRSVp16) was used to transduce breast cancer cell lines MDA-MB-231 and JygMC(A). This study showed that adenoviral-mediated p16 expression downregulated VEGF gene expression in breast cancer cells, inhibited breast cancer cell-induced angiogenesis, and suppressed breast tumor metastasis in a spontaneous metastasis model in mice. Moreover, the mechanism of how p16 regulates VEGF expression is also investigated.
Keywords: Adenoviral vector preparation/construction, Immunohistochemistry, Western blot analysis, Spontaneous metastasis assay, cellular localization, p16, angiogenesis, transcription
I. Introduction
Breast cancer is the leading type of cancer in women living in the United States today. It is estimated that there are 178,480 new cases and 40,460 deaths of breast cancer in American women in 2007 (Jemal et al, 2007). Metastasis, the spread of tumor cells from a primary site to distant organs to form secondary tumors, is a major cause of deaths of breast cancer patients (Marshall, 1993). Metastasis is a complex process including primary tumor growth, invasion through basement membrane and extracellular matrix, dissemination to lymphatic and/or blood circulation, motility to distant organs, angiogenesis and colonization in the secondary site (Steeg et al, 1998). It is therefore critical to intervene at the key steps of the metastatic process (such as angiogenesis) for effective breast cancer treatment.
In the angiogenesis process, endothelial cells initially respond to changes in the local environment and migrate toward the growing tumor. The endothelial cells then migrate together forming tubular structures that are ultimately encapsulated by recruiting periendothelial support cells to establish a vascular network that facilitates tumor growth and metastasis (Hanahan and Folkman, 1996). Angiogenesis, as the growth of new blood vessels from pre-existing vessels, is an essential prerequisite for aggressive tumor proliferation and spreading (Folkman, 1971) and it requires several angiogenic factors during the malignant transformation (Brem et al, 1997).
Among these angiogenic factors, VEGF plays a pivotal role in tumor angiogenesis (Hanahan and Folkman, 1996). VEGF is a dimeric glycoprotein secreted by cells that is able to induce permeability and angiogenesis in tumor-associated blood vessels (Ferrara and Henzel, 1989). The expression of VEGF, which markedly contributes to tumor-associated neovascularization, is correlated with the malignant transformation of breast cancer and the poor prognosis in the patients (Heffelfinger et al, 1999).
Tumor suppressor gene p16 is a cyclin-dependent kinase inhibitor and a negative cell cycle regulator (Shapiro and Rollins, 1996). The inactivation of p16 appears to be a common event in many cancers (Caldas et al, 1994; Jen et al, 1994; Cairns et al, 1995; Hatta et al, 1995; Xiao et al, 1995). Angiogenic capacity correlates with the degree of malignancy and the loss of p16 activity in high-grade gliomas (Quan et al, 2001). In this study, we examined the effects of p16 expression on regulation of VEGF gene expression, tumor angiogenesis and metastasis of breast cancer cells.
II. Materials and Methods
A. Cell lines and culture conditions
Dulbecco’s Modified Eagle medium (D-MEM) and RPM1-1640 were purchased from Gibco BRL (Gaithersburg, MD), fetal bovine serum (FBS) from Hyclone Laboratories (Logan, UT), and Endothelial Cell Basal Medium-2 (EBM-2) from Clonetics/Cambrex (Walkersville, MD). Human embryonic kidney 293 cells (American Type Culture Collection, Rockville, MD) were grown in D-MEM with 10% heat inactivated FBS. Human breast cancer cell line MDA-MB-231 (ATCC), and murine mammary carcinoma cell line JygMC(A) (a generous gift from Dr. H. Azuma, Osaka Medical College, Osaka, Japan) (Azuma et al, 2002), were grown in RPM1-1640 medium with 10% FBS and D-MEM with 10% FBS, respectively. Human microvascular endothelial cells (HMEC, a gift from Dr. X. Zhang, University of Tennessee Health Science Center, Memphis, TN) were grown in EBM-2 medium containing 10% FBS. All cell lines were grown in medium containing 100 units/ml penicillin, and 100 μg/ml streptomycin at 37°C in 5% CO2.
B. Adenoviral vector construction
The construction of AdRSVp16, a replication-defective, recombinant adenoviral vector expressing a human wild-type p16 cDNA gene under the control of a Rous sarcoma virus (RSV) promoter, was previously described (Steiner et al, 2000). The construction of the control virus, AdRSVlacZ, in which a bacterial β-galactosidase gene was under the control of the RSV promoter, was also described previously (Lu et al, 1999). The construction of Ad-HIF-1α/HT2, a recombinant adenoviral vector expressing a fusion protein of HIF-1α and a reporter HaloTag (HT2) was done as follows: The HaloTag pHT2 vector (Promega, Madison, WI) was cut with EcoR V and Not I to release an approximate 890-bp HT2 cDNA, which encodes a HaloTag reporter protein that forms a covalent bond with its fluorescent-coupled ligand (Promega, Los et al, 2005). The HT2 cDNA was subcloned into the pacAd5CMVNpA (University of Iowa, Iowa City, IA) to generate the adenoviral shuttle vector pacAd5-HT2. A 2.5-kb PCR product of human HIF-1α cDNA was generated from HIF-1α expression vector (a generous gift from Dr. B. Jiang, West Virginia University, Morgantown, WV) using a set of primers specific to the human HIF-1α cDNA gene: primer 1 was 5′CATGGGATCCATGGAGGGCGCCGGCGGCGC3′ that contains the ATG start codon of the HIF-1α cDNA gene; primer 2 was 5′GCTGGGATCCGCCGCCGCCGCCAGAGTTAACTTGATCCAAAGC3′ that contains the sequence of the 3′-end of the HIF-1α cDNA gene immediately prior to the stop codon and a 5′Ser-Gly-Gly-Gly-Gly3′ linker peptide (sequence in italic) in between the two proteins (i.e., HIF-1α and HT2) for better protein folding for each protein as recommended by Promega. The primers contained an introduced Bam HI site (underlined sequences in the primers) at both ends of the PCR products. After digestion with Bam HI on both the 2.5-kb PCR product of HIF-1α and pacAd5-HT2, the HIF-1α cDNA was inserted into at the 5′-terminal of the HT2 gene to create an adenoviral shuttle vector pacAd5- HIF-1α/HT2, which contains a fusion protein construct of 5′- HIF-1α/HT2-3′. The fusion construct was sequenced to ensure the correct linkage and frame-reading through the entire fusion protein construct. The pacAd5-HIF-1α/HT2 was cotransfected with adenoviral genome vector into the 293 cells to generate a recombinant adenovirus (Ad-HIF-1α/HT2) expressing the fusion protein HIF-1α/HT2.
C. Adenoviral vector preparation, titration and transduction
Individual clones of adenoviral vector AdRSVp16 (which expresses a human wild-type p16 cDNA gene) and AdRSVlacZ (which expresses an E. coli β-galactosidase gene and serves as a control virus) were propagated in 293 cells. The culture medium of the 293 cells showing the complete cytopathic effect was collected, and adenoviral vectors were purified by Clontech Adeno-X Virus Purification Kits (Clontech, Mountain View, CA) according to the manufacturer’s instructions. The viral titration and transduction were performed as standard procedures as previously described (Graham and Prevec, 1991).
D. Immunohistochemistry
A total of 15 paired clinical samples of normal and cancerous breast tissues in paraffin-embedded blocks were either obtained from Cooperative Human Tissue Network (CHTN Southern Division, University of Alabama at Birmingham, AL) or purchased from National Disease Research Interchange (NDRI, Philadelphia, PA). The tissue blocks were sectioned by a microtome. The samples (slides) was first incubated with first antibody against human p16 (final concentration at 1 μg/ml) (mouse anti-human p16 antibody, Santa Cruz Biotechnology, Inc., Santa Cruz, CA) for 16 h at 4°C, then by corresponding second antibody (goat anti-mouse antibody) and the Universal Elite ABC Kit (Vector Laboratories, Inc., Burlingame, CA) according to the manufacturer’s protocol. The reaction was visualized with DAB solution (75 mg 3,3′-Diaminobenzidine and 30 μl 50% H2O2 in 150 ml PBS) for 3–10 min. The immunohistochemical staining results were scored using a semiquantitative scoring system (Chen et al, 2005) to define no, weak, moderate and high expression of p16 protein.
For tumor sections derived from JygMC(A) allograft subcutaneous (s.c.) tumors grown on nude mice (see more detail in “Spontaneous metastasis assay” section below), samples were processed for immunohistochemical staining as described previously (Steiner et al, 2000), using primary antibody against CD31 (final concentration at 0.3 μg/ml) (Pharmigen, BD Biosciences, San Diego, CA), followed by corresponding secondary antibody and DAB staining procedures as described above. The quantitation of CD31 staining was represented as microvessel density, which was measured by the method as described before (Weidner et al, 1991; Hiraga et al, 2007). In brief, the areas of highest neovessel density (so called “hot spots”) were identified by light microscopy after scanning the entire tumor section at low power. Then, individual microvessels were counted at high power (x200 field) in an adequate area (e.g., 0.74 mm2 per field using x20 objective lens and x10 ocular). Any CD31-positive stained endothelial cells or clusters separate from adjacent vessels were counted as a single microvessel, even in the absence of vessel lumen. Five randomly selected “hot spots” field were counted from each tumor (at least 3 tumors/mice per group) and the mean ± SD are represented in the figure.
E. Western blot analysis
Cells were extracted and processed for gel electrophoresis as previously described (Lu et al, 1995). Cell extract lysates (100 μg) were loaded on polyacrylamide gels and subjected to sodium dodecylsulfate (SDS) gel electrophoresis, then transferred to a nitrocellulose membrane (Bio-Rad Laboratories, Hercules, CA). The membrane was treated with blocking solution (15% nonfat milk, and 0.02% sodium azide in PBS) overnight at 4°C. The membrane was incubated for 1 h at room temperature with the primary antibody, either with mouse anti-human p16 antibody (see above) or mouse anti-human HIF-1α antibody (1:1,000 dilution, cat# 610958, BD Biosciences). The membrane was then incubated for 1 h at room temperature with goat anti-mouse secondary antibody coupled to peroxidase, followed by detection with chemiluminescent reagents (ECL kit, Amersham).
F. Reverse transcription-polymerase chain reaction (RT-PCR)
Cells were extracted and total RNA was isolated by RNeasy Total RNA Kit (Qiagen, Santa Clarita, CA). After treatment of total RNA with RNase-free DNase I (Gibco BRL), the reverse transcriptase reaction was carried out using Superscript II RT (Gibco BRL) according to the manufacturer’s protocol. An aliquot of the RT mixture was subsequently used for the PCR reaction. The primers were specific to the VEGF gene: primer 1 was 5′GGATGTCTATCAGCGCAGCTAC3′ and primer 2 was 5′TCACCGCCTCGGCTTGTCACATC3′. This primer set could detect mRNA of VEGF165, giving a 454-bp band (Houck et al, 1991). PCR was performed in 50 ml total volume containing one fifth of the above RT mixture, in a final concentration of 2 mM MgCl2, 50 mM KCl, 0.2 mM each of dNTPs, 20 mM Tris-HCl (pH 8.4), 1 μM each of the primers, and 2.5 units of Taq DNA polymerase (Gibco BRL). The reaction was carried out at 94°C for 4 min; then for 30 cycles at 94°C for 1 min, 61°C for 2 min, and 72°C for 2 min; followed by 72°C for 10 min. To ensure the quality of total RNA samples, the same RT mixture mentioned above was used for PCR of the housekeeper gene β-actin. The set of primers specific to the β-actin gene and the PCR conditions were described previously (Steiner et al, 1999).
G. Transactivation assay of VEGF promoter
A chimeric construct containing a 2.4-kb VEGF promoter and a luciferase reporter gene (pVEGF/Luc) (Forsythe et al, 1996) were cotransfected with or without p16 expression vector, pAvsp16 (Steiner et al, 2000), by Fugene 6 (Roche, Indianapolis, IN) according to the manufacturer’s instructions. In addition, a β-galactosidase expression vector pSV40βgal (Promega) was also cotransfected for normalizing the transfection efficiency. Forty-eight hours after transfection, the cells were lysed using 1x Reporter Lysis Buffer (Promega) and processed to luciferase activity assay using a Luciferase Assay Kit (Promega) and β-galactosidase activity using a β-gal Assay Kit (Promega). The detection of luciferase activity was performed using a luminometer (Turner Designs Instrument, Model TD2020, Sunnyvale, CA), and the transcriptional activity of was presented as luciferase activity/β-gal activity.
H. In vitro angiogenic assay using human microvascular endothelial cells (HMEC) as a model for tubular formation assay
Preparation of conditioned media
MDA-MB-231 cells were harvested in the log phase of growth, washed twice with serum-free culture media, and replated in three 10 cm culture dishes. When cells were approximately 80% confluent, cells were either untreated or transduced with control virus AdRSVlacZ or AdRSVp16 at moi=200 for 72 h, respectively. Culture supernatants were collected, and sequentially centrifuged at 1,200 rpm and 12,000 rpm for 10 min, respectively. The final supernatant was used as conditioned medium for the following tubular formation assay.
Tubular formation assay was performed as previously described (Kim et al, 2002). Briefly, 200μl matrigel (BD Biosciences) was pipetted into a 48-well plate and polymerized for 1 hour at 37°C. HMECs incubated in EBM-2 containing 10% FBS for 24 hours were harvested after trypsin treatment, resuspended in the above-mentioned conditioned medium, and then replated onto the layer of matrigel at a density of 3×10³ cells/well. Matrigel cultures were incubated at 37°C. At time points of 1, 6, and 24 h after HMEC planting onto the matrigel, the tube-like structure of the cells was photographed. To compare tubular connections (i.e., tubular network formation) in a quantitative manner, five randomly selected fields at each time point were counted for the vessel crossing points and represented as mean ± SD.
I. Spontaneous metastasis assay
Highly metastatic breast cancer JygMC(A) cells were either untreated, or transduced with AdRSVlacZ or AdRSVp16 at moi of 200. Forty-eight hours after viral infection, the cells were harvested and the viable cell numbers were counted in a hemocytometer using trypan blue exclusion. Cells (1×10⁷ cells per mouse) were injected subcutaneously into the flanks of 8-week-old female nude mice (Harlan Sprague Dawley, Indianapolis, IN). Three groups of mice, with five mice in each group, were formed corresponding to the three groups of cells mentioned above. Mice were monitored every day. All the mice were sacrificed at day 28 post inoculation when some of them became moribund. To examine metastasis, lung, liver, spleen, and kidney were removed and metastases were counted under the dissection stereoscope after fixation in Bouin’s solution (Sigma). The mean ± SD of total metastases per mouse were represented. In addition, the s.c. primary tumors were harvested and processed to tumor sections for immunohistochemical staining for CD31 expression. The statistical analysis we used throughout this study was student t-test.
J. HaloTag TMR ligand staining for cellular localization of HIF-1α/HT2 fusion protein
A recombinant adenovirus (Ad-HIF-1α/HT2) expressing fusion protein of hypoxia inducible factor-1α (HIF-1α) and a reporter gene HaloTag (HT2) (Promega) was used in this assay to trace the cellular localization of HIF-1α protein. The HT2 gene encodes a HaloTag reporter protein that forms a covalent bond with its fluorescent-coupled ligand.
The MDA-MB-231 cells were seeded at 5×10⁴ cell/per SlideFlask. Next day the cells were transduced with either Ad-HIF-1α/HT2 plus AdRSVp16 (moi=100 for each of adenoviral vectors), or Ad-HIF-1α/HT2 plus AdRSVlacZ (moi=100 for each of adenoviral vectors) for 72 h. The cell were fixed with 4% paraformadehyde containing 0.4 M sucrose in PBS for 10 min at 37°C, 5% CO2. After washing with PBS, the cells were permeablized with 0.1% Triton X-100 in PBS for 30 min at 37°C, 5% CO2. The cells were incubated with 5 mM working solution of HaloTag ligand tetramethyl rhodamine (TMR, Promega) for 45 min at 37°C, 5% CO2 in the dark. TMR ligand is a small chemical tag and brightly fluorescent, it is cell-membrane permeable and forms covalent bond with HT2 (HaloTag) protein (Los et al, 2005). After removing the TMR ligand solution, the cells were refed with fresh growth medium and incubated at 37°C, 5% CO2 for another 30 min in the dark. After washing with PBS, the slides were mounted using Fluor Saver Reagent (Calbiochem, La Jolla, CA) and were observed under fluorescent microscopy.
III. Results
A. Loss of p16 expression in clinical breast cancer specimens
To examine whether there is differential expression of p16 in normal and cancerous human breast tissues, immunohistochemical staining using anti-p16 antibody was performed on human breast specimens that have various disease stages ranged from ductal cancer, lobular cancer, infiltrating ductal carcinoma to invasive ductal cancer. In general and typically, we found that there is a strong p16 expression (dark brown color, see arrows for the representative staining, Figure 1A) in normal human breast tissue, mostly around the tubular structure of the breast tissue; in contrast, there is little, if any, p16 expression in breast cancer tissues (Figure 1B), which have lost as well the typical tubular structure of breast tissue. Among the 15 paired specimens, we found all (100%) of normal adjacent breast tissues expressed p16, with 8 (53.3%) in high, 6 (40%) in moderate and 1 (6.7%) in low expression of p16. In contrast, among 15 breast cancer tissues, 12 of them (80%) had no p16 expression, only 2 (13.3%) had moderate, and 1 (6.7%) had low expression of p16. Consistently, loss of p16 expression in primary breast carcinomas was reported by others (Brenner et al, 1996; Silva et al, 2003) and a differential or increased expression of p16 was observed among benign breast tissue in comparison with its cancerous counterpart (Esposito et al, 2006; Yu et al, 2007).
Figure 1. Lack of p16 expression in human breast cancer tissues.
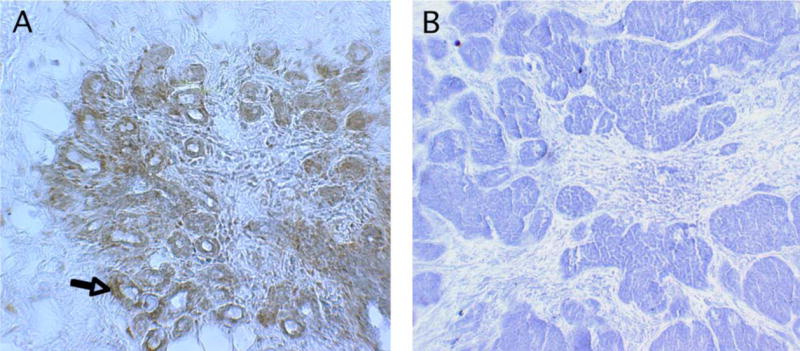
A typical and representative paired samples of normal adjacent (A) and cancerous (B) human breast tissues were presented. A total of 15 paired clinical samples were analyzed by immunohistochemical staining with anti-p16 antibody, followed by biotinylated secondary antibody, then by avidin-coupled horseradish peroxidase system. The reaction was visualized with DAB (3,3′-diaminobenzidine) solution. The specimen sections were counterstained with hematoxylin. The immunohistochemical staining results were scored using a semiquantitative scoring system (Chen et al, 2005) to define no, low, moderate and high expression of p16 protein. The original magnification is x66.
B. Adenovirus AdRSVp16 expresses high-level p16 protein in breast cancer cells
To facilitate induction of p16 expression, a replication-defective recombinant adenovirus expressing human wild-type p16 under the control of a Rous sarcoma virus (RSV) promoter, AdRSVp16, was used to transduce breast cancer cells. To demonstrate that AdRSVp16 is able to transfer and express p16 protein in breast cancer cells, human breast cancer MDA-MB-231 cells were transduced with AdRSVp16 at multiplicity of infection (moi) of 200. Three days later the cells were processed for a Western blot analysis using primary antibody against p16. As shown in Figure 2, cells transduced by AdRSVp16 expressed a high level of p16 protein. The same Western blot results also demonstrate that MDA-MB-231 cells do not express endogenous p16 protein (Figure 2).
Figure 2. Ectopic p16 expression in human breast cancer MDA-MB-231 cells after AdRSVp16 transduction.
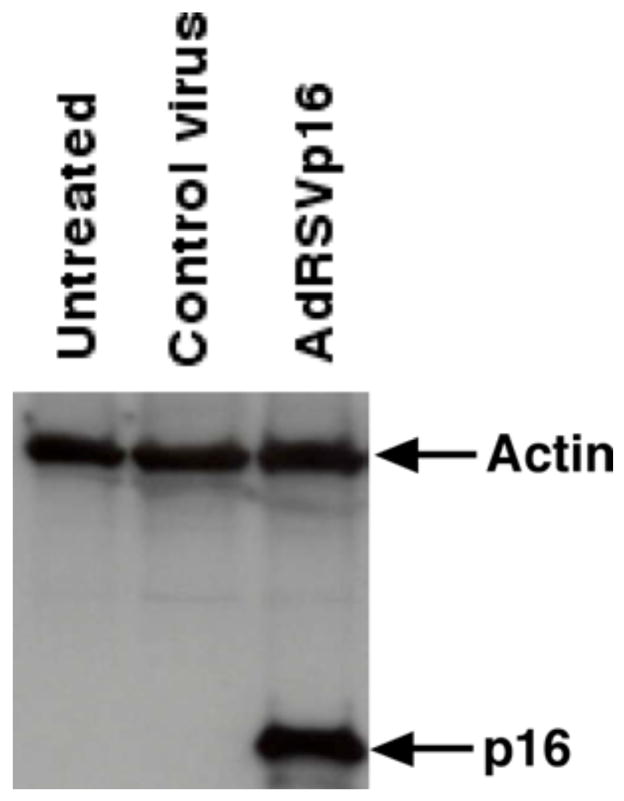
Adenoviral-mediated p16 expression as determined by Western blot analysis. MDA-MB-231 cells were grown in culture dishes and transduced by recombinant adenovirus expressing p16 (AdRSVp16) at moi of 200. Seventy-two h later the cells were harvested and cell lysate was subjected to a Western blot analysis using anti-p16 antibody as the primary antibody. The same blot was immunoblotted with anti-actin antibody as an internal control.
C. p16 downregulates VEGF gene expression
To determine whether p16 modulates VEGF gene expression at the mRNA level, breast cancer JygMC(A) cells were either untreated or transduced by control virus (AdRSVlacZ) or AdRSVp16 (Figure 3), and 48 h later the total RNA was isolated. By using primers specific to the VEGF gene that would result in an 454-bp RT-PCR product corresponding to VEGF165 (Houck et al, 1991), our results showed that there was a dramatically decreased expression of VEGF mRNA in AdRSVp16-transduced cells compared to that of the untreated control (Figure 3). A similar result was observed in MDA-MB-231 cells that p16 expression downregulated VEGF mRNA expression (Lu et al, 2003). Moreover, our previous study (Lu et al, 2003) also showed by ELISA assay that AdRSVp16-transduced MDA-MB-231 cells had significantly reduced VEGF protein secreted into the medium compared to the untreated control cells. Together, these data demonstrated that p16 downregulates VEGF gene expression in breast cancer cells at both mRNA and protein levels.
Figure 3. p16 expression decreased VEGF expression at mRNA level in breast cancer JygMC(A) cells.
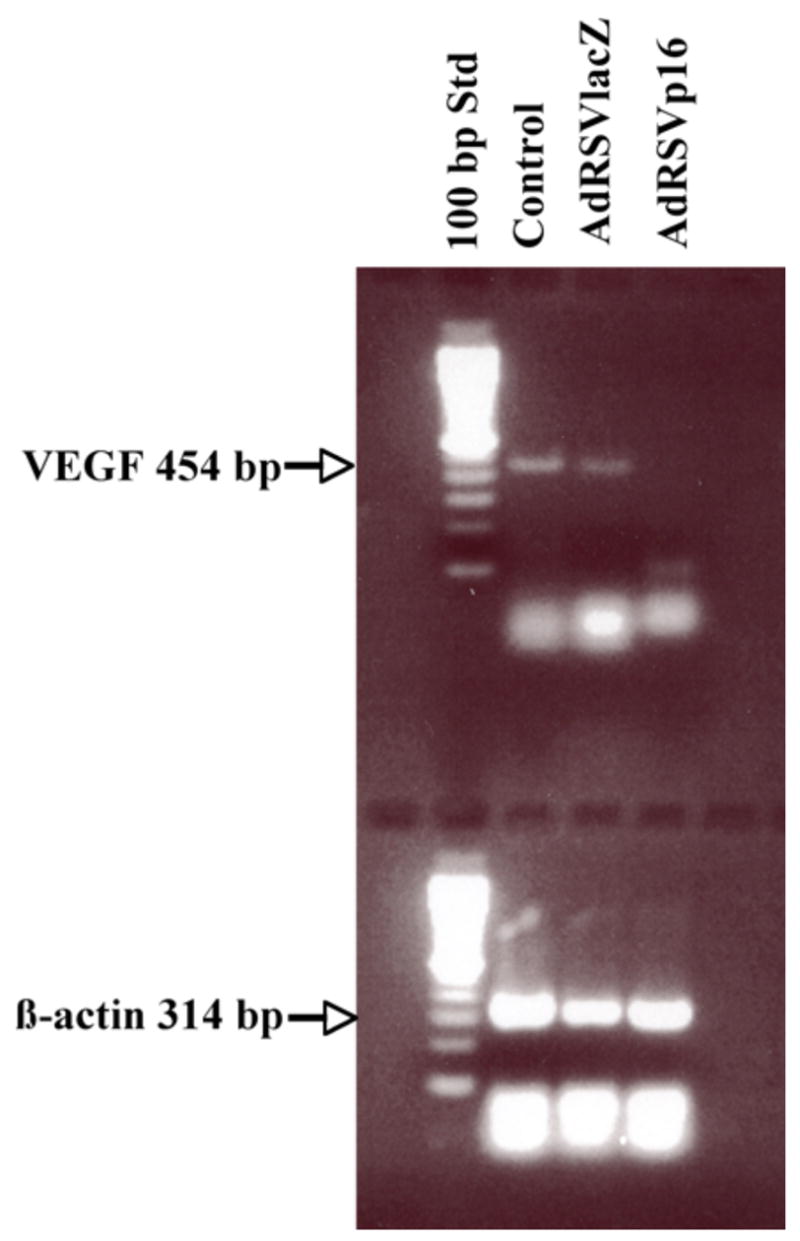
JygMC(A) cells were either untreated (Control) or transduced with control virus AdRSVlacZ (AdlacZ) or AdRSVp16 (Adp16) at moi of 200. The total RNA was isolated from cells at 48 h after viral transduction and subjected to a reverse transcriptase reaction. An aliquot of the RT mixture was subsequently used for the PCR reaction. The primers specific to the VEGF gene resulted in a 454 bp RT-PCR product. To ensure the quality of total RNA samples and equal measurement, the same RT mixture mentioned above was used for PCR of housekeeper gene β-actin that resulted in a 314 bp PCR product.
D. p16 inhibits VEGF expression at the transcriptional level
As p16 downregulated VEGF expression at both mRNA and protein levels in MDA-MB-231 cells, we next examined whether p16 regulates VEGF gene expression at the transcriptional level. We transiently cotransfected a VEGF promoter/luciferase reporter chimeric construct (pVEGF/Luc) (Forsythe et al, 1996) with p16 expression vector pAvsp16 (p16) (Steiner et al, 2000) or empty control vector (empty vector) into MDA-MB-231 cells for 48 h. In addition, a sample (untreated control) with only pVEGF/Luc construct transfected was used as an additional control. As shown in Figure 4, there was a basal level transcriptional (Luc/β-gal) activity in the absence of p16 expression (i.e., with untreated control or empty vector control, 1st and 2nd lane from left, Figure 4), reflecting a native moderate transactivation activity in MDA-MB-231 cells for VEGF transcription. However, the introduction of p16 expression into the cells remarkably reduced the transcriptional activity by about 69% (Figure 4) when compared to the control groups, suggesting that p16 downregulates VEGF expression at the transcriptional level. Moreover, this p16-mediated downregulation is specific to p16 and it is independent of p16’s cell-cycle arrest effect, because cotransfection of expression vector of another CDK inhibitor and cell-cycle arrest gene, p21Waf1, did not show any transcriptional regulatory effect on the VEGF/Luc gene (Figure 4).
Figure 4. p16 regulates VEGF gene expression at the transcription level.
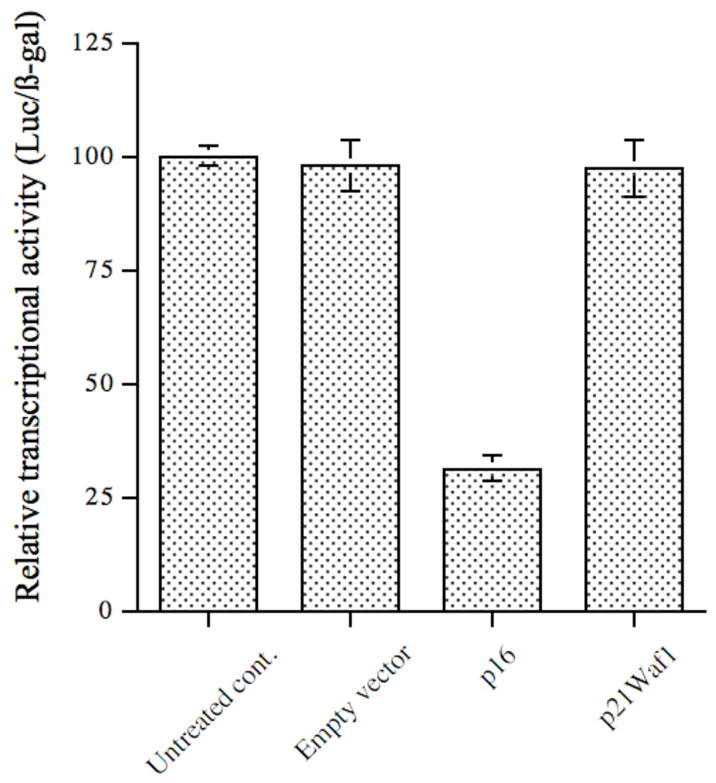
VEGF promoter-luciferase reporter chimeric construct pVEGF/Luc was cotransfected into MDA-MB-231 cells either alone (Untreated control), or with empty vector, or p16 expression vector pAvsp16 by Fugene 6 for 48 h. In addition, plasmid pSV40βgal was also cotransfected in all groups to normalize the transfection efficiency. After lysis of the cells, aliquots of cell extracts were used for luciferase activity assay and β-galactosidase assay, respectively. The relative transcriptional activities were represented as luciferase/β-galactosidase (Luc/β-gal) and normalized to the value of the untreated control. The data (mean ± SD) were from two independent experiments; each was conducted in triplicate. The differences between p16 group and other three groups are statistically significant (p<0.05).
E. p16 inhibits angiogenesis in vitro
To analyze p16’s effect on angiogenesis in vitro, HMEC cells were used as an in vitro angiogenic assay model. Conditioned medium from untreated, control virus-treated or AdRSVp16-treated MDA-MB-231 cells were collected, and used to culture HMEC cells growing on Matrigel. The status of the tubular network formation on Matrigel, as an indicator of angiogenic ability of HMEC cells, was examined at 1 h, 6 h, 24 h, 48 h and 72 h, respectively. When the HMEC cells grew in conditioned medium isolated from the untreated MDA-MB-231 cells, the cells tended to form tubular structures very quickly on the Matrigel; even at 1 h, the cells started to aggregate together to form a pre-tubular structure (Figure 5A). The apparent tubular structure was observed at 6 h (Figure 5B), and the mature tubular network maintained at 24 h (Figure 5C). At longer incubation, the tubular structure began to dissociate and disappear at 72 h (data not shown), probably due to the dying HMEC cells in the depleted condition of the growth factor in the medium (as the conditioned medium was already 3-day-old when it was collected from MDA-MB-231 cells before culturing HMEC cells). These results suggested that there were some growth factors secreted from MDA-MB-231 cells that were able to stimulate angiogenesis of HMEC cells (Figure 5A–5C). In contrast, when HMEC cells grew in conditioned medium isolated from AdRSVp16-treated MDA-MB-231 cells, their abilities to form the tubular network were significantly reduced (Figure 5D–5E). Even at 6 h and 24 h time points, where the control groups formed a well-developed tubular network (Figure 5B and Figure 5C), the AdRSVp16-treated group had few, if any, visible tubular connections (Figure 5E and 5F). These results indicate that p16 effectively inhibited HMEC angiogenesis stimulated by growth factors secreted from MDA-MB-231 cells. When HMEC cells grew in similar conditions as in Figure 5A–5C, but with added neutralized antibody against VEGF, the cells’ abilities to form a tubular network were totally blocked (Figure 5G), implying that it was the VEGF, secreting from MDA-MB-231 cells, which played the major role in stimulating HMEC cell angiogenesis. Consistently, our previous study by ELISA assay (Lu et al, 2003) and report by other’s (Sartippour et al, 2002) demonstrated that MDA-MB-231 cells indeed secreted VEGF. Moreover, this p16-mediated inhibition on tubular structure was not due to viral part of AdRSVp16, as ability to form tubular network of HMEC cells grown in conditioned medium from control virus-treated MDA-MB-231 cells did not reduce, if not somehow increased (Figure 5H). Taken together, these observations demonstrated that p16 inhibited angiogenesis in an in vitro angiogenic assay, as evidenced by its ability to prevent the formation of the tubular network in HMEC cells grown on Matrigel in conditioned medium derived from MDA-MB-231 cells.
Figure 5.
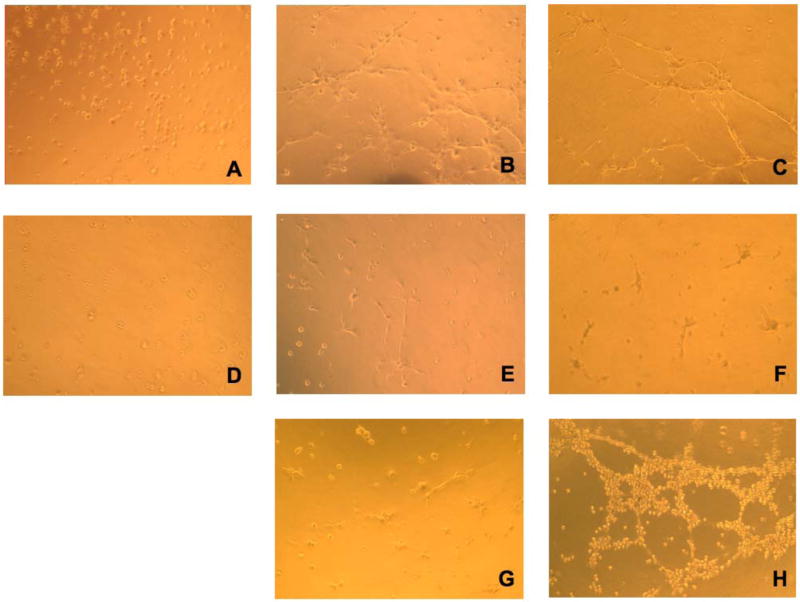
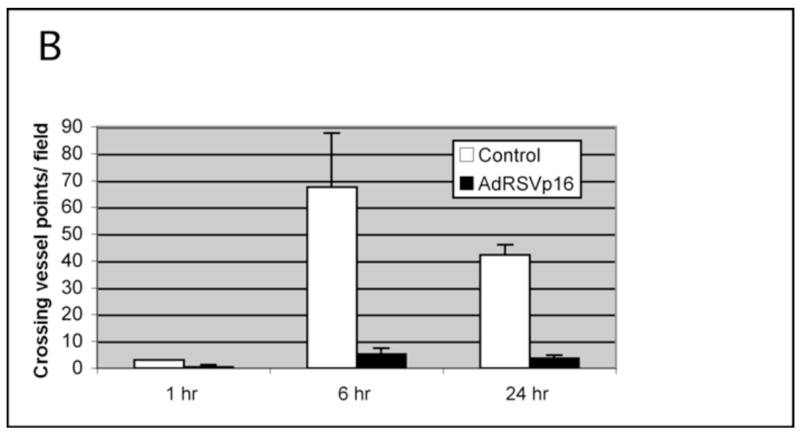
Figure 5A. p16 inhibited HMEC tubular network formation cultured in conditioned medium of MDA-MB-231 cells. HMEC cells were planted onto Matrigel-coated wells in the conditioned medium derived from untreated (A,B,C) or AdRSVp16 transduced (D,E,F) MDA-MB-231 cells, respectively. The development of the tubular network of HMEC cells was recorded at 1h (A and D), 6 h (B and E), and 24 h (C and F) after HMEC cell seeding onto the Matrigel. As controls, the images of tubular network of HMEC cells grown in the same conditioned medium derived from untreated MDA-MB-231 cells but containing 1 μg/ml neutralized anti-VEGF antibody (G), and in the conditioned medium derived from control virus AdRSVlacZ transduced MDA-MB-231 cells (H) were recorded at 24 h after seeding onto Matrigel.
Figure 5B. Quantitation of tubular network formation. The number of tubular connections (i.e., crossing vessel points) was counted (five randomly selected fields at each time point) and the average crossing vessel points per field was presented for a quantitative comparison. The p values for differences between the control and AdRSVp16 group at 1, 6, and 24 h are 0.03775, 0.000822 and 1.38 × 10⁻⁵, respectively, so all are statistically significant (p<0.05).
F. p16 suppressed breast tumor metastases in a spontaneous metastasis animal model
JygMC(A) cells are highly metastatic breast cancer cells that are able to form metastasis in nude mice in a spontaneous metastasis model (Azuma et al, 2002). JygMC(A) cells were either untreated, or transduced with control virus or AdRSVp16 at moi=200, and were harvested 48 h later, then 1×10⁷ cells per mouse were injected subcutaneously into the flanks of female nude mice. All mice formed allograft primary tumors on the injection sites and secondary tumors (metastasis). This suggests that p16 expression did not affect tumorigenicity and metastatic incidence of JygMC(A) cells. The majority of metastasis of untreated JygMC(A) cells in this spontaneous model was found in the lungs (Figure 6), with a minority found in the livers and occasional metastases in the kidneys and spleens. However, AdRSVp16 treated mice had significantly less metastasis--with a 52.6% reduction of average number of total metastases (sum of all metastases in lung, liver, kidney and spleen) compared to the untreated mice group and the control virus (AdRSVlacZ treated) group (Table 1).
Figure 6. Representative lung metastasis in AdRSVp16 treated mice and control groups of mice.
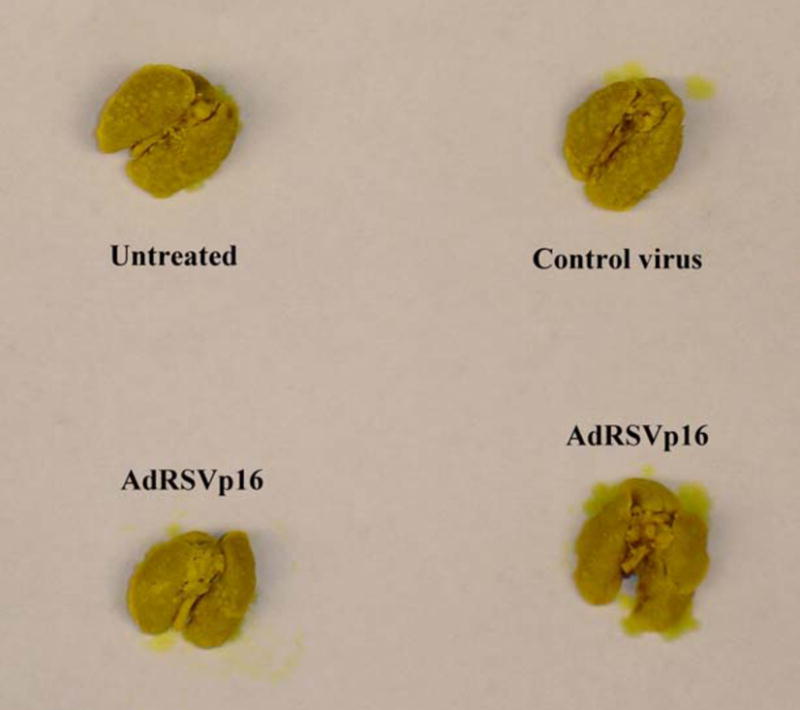
JygMC(A) cells were untreated or transduced with either control virus AdRSVlacZ or AdRSVp16 (moi=200) for 48 h. The cells were then harvested and injected subcutaneously into the flanks of female nude mice. The mice were sacrificed at day 28 after tumor inoculation for examining metastases. Shown are the representative lung metastases from mouse groups injected with untreated JygMC(A) cells (Untreated), or JygMC(A) cells treated with AdRSVlacZ (Control), or JygMC(A) cells treated with AdRSVp16 (p16 virus).
Table 1.
Spontaneous Metastasis Assay in Nude Mice.
| Mouse group | Mean (average) of metastasis* per mouse |
|---|---|
| Untreated (n=5) | 165.8 ± 19.1 |
| AdRSVlacZ (n=5) | 161.4 ± 18.2 |
| AdRSVp16 (n=5) | 78.6 ± 16.6** |
Sum of (total) metastases in lung, liver, kidney and spleen were indicated.
The differences in number of total metastasis between AdRSVp16 treated group and the other two groups are statistically significant (p<0.05), whereas the differences between the untreated group and control virus AdRSVlacZ treated group are statistically insignificant (P>0.05).
Cells were transduced with adenovirus at moi=200 for 48 hr. 1×10⁷ cells (untreated, AdRSVlacZ or AdRSVp16 transduced) were injected subcutaneously into the flanks of 8-week-old female nude mice. Mice were sacrificed at day 28 after tumor cell inoculation and metastases in various organs were examined. Five mice were used in each group. The student t-test was used for statistical analysis. The data are represented as mean (average) ± Standard deviation (SD).
G. Immunohistochemical staining for CD31 expression in tumor sections
To analyze p16’s effects on anti-angiogenesis in vivo, the mouse s.c. tumors harvested at the autopsy were processed to tumor sections and subjected to immunohistochemical (IHC) staining for neovascularization marker CD31 (Figure 7). The AdRSVp16-treated tumor had much less CD31 expression (dark brown staining, Figure 7C and 7D) compared to the untreated tumor (Figure 7A) or control-virus treated tumor (Figure 7B), suggesting that p16 expression inhibited tumor vascularization in vivo. These dark brown staining is specific for CD31 protein, as the negative control, in which the same IHC protocol on untreated tumor section was performed except for the omission of the use of the anti-CD31 primary antibody, did not show any positive dark brown color (data not shown).
Figure 7. p16 inhibited angiogenesis in breast tumors.
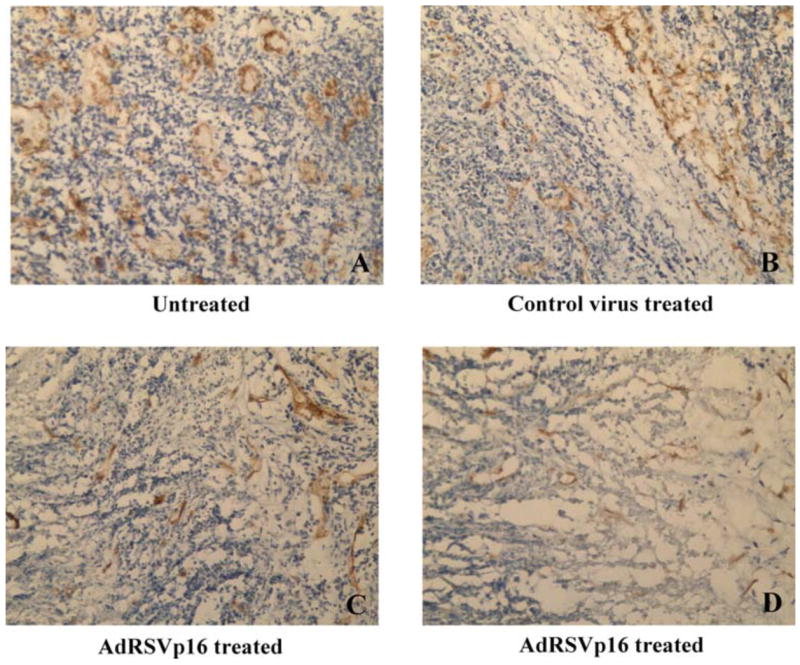
The s.c. allograft tumors were harvested at day 28 post tumor cells implantation. The tumor sections were analyzed by immunohistochemistry using anti-CD31 primary antibody, followed by appropriate secondary antibody and procedures as described in Figure 1 legend. Shown are CD31 staining for tumor section from untreated control (A), control virus treated group (B), and AdRSVp16-treated group (C and D).
Moreover, the CD31 expression can be quantitated and presented as microvessel density (Figure 8). Taken together, these results demonstrated that p16 expression inhibited microvessel formation, or angiogenesis, inside the tumors.
Figure 8. Microvessel density measurement in breast tumors.
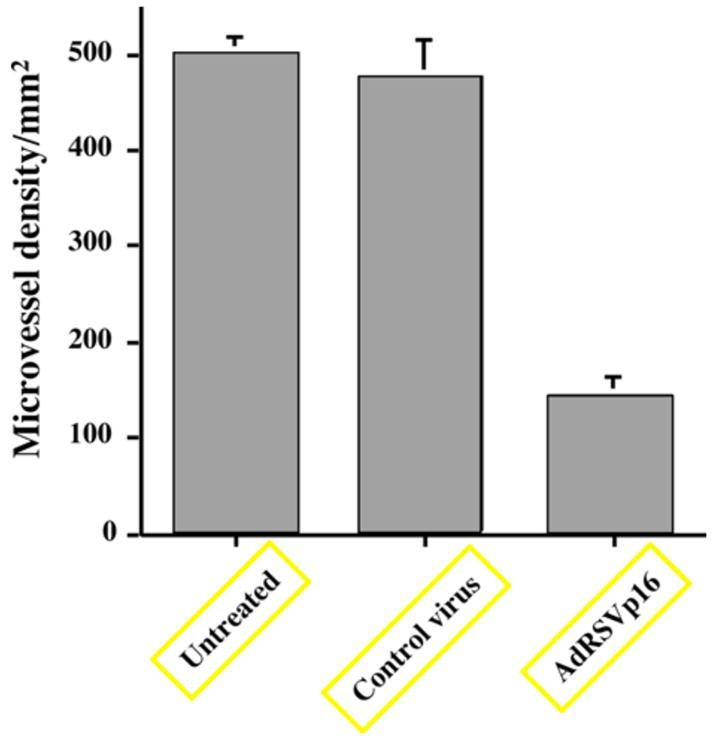
A quantitation of CD31 staining from Figure 7 is represented here as the microvessel density as measured by the method described in Materials and Methods. Five selected fields each from tumors of at least three mice per group were used to generate mean ± SD for per group. Each field was counted under high power lens for the individual microvessel. Any stained endothelial cells or clusters separate from adjacent vessels were counted as a single microvessel, even in the absence of vessel lumen. Student t-test was used to perform the statistical analysis. The p value between AdRSVp16 group and untreated (or control virus treated) group is 0.00001393 and 0.0001873, respectively (both < 0.001, statistically significant). The p value between untreated and control virus treated group is 0.36167 > 0.05 (statistically insignificant).
H. p16 changed HIF-1α cellular localization from the nucleus to the cytoplasm
Hypoxia-inducible factor-1 (HIF-1) is a transcriptional activator for the VEGF gene promoter (Forsythe et al, 1996). HIF-1 is composed of an inducible subunit, HIF-1α and a constitutively expressed subunit, HIF-1β (Forsythe et al, 1996). Heterodimerization of HIF-1α and HIF-1β is required to form the transcriptionally active HIF-1 (Forsythe et al, 1996) and mediate its nuclear translocation (Semenza et al, 2004), and the consequent binding of HIF-1 to the promoter regions of target genes such as VEGF (Semenza et al, 2004).
One possible mechanism of how p16 regulates VEGF gene expression is that p16 somehow affects the cellular location of HIF-1α, the transcription factor of the VEGF gene. To test that possibility, a recombinant adenovirus, Ad-HIF-1α/HT2, which expresses a fusion protein of HIF-1α and HT2, was constructed (Figure 9) and used to trace the cellular localization of HIF-1α protein. The HT2 gene encodes a HaloTag reporter gene that forms a covalent bond with its brightly fluorescent-coupled ligand. Therefore, the fluorescent staining for HT2 protein can be used as an indicator of whereabouts of HIF-1α protein in the cells after Ad-HIF-1α/HT2 transduction. To demonstrate that this Ad-HIF-1α/HT2 fusion construct is functional and expresses HIF-1α protein, MDA-MB-231 cells were transduced with Ad-HIF-1α/HT2 for 72 h and the cell extracts were subjected to a Western blot analysis using anti-HIF-1α as the primary antibody. As shown in Figure 10, cells transduced with Ad-HIF-1α/HT2 indeed expressed HIF-1α protein at an expected size around 120 KDa. The cell extracts from MDA-MB-231 cells incubated under the hypoxia conditions were used as positive control to show the induced endogenous expression of HIF-1α protein (Figure 10, right lane).
Figure 9. Schematic diagram of Ad-HIF-1α/HT2.
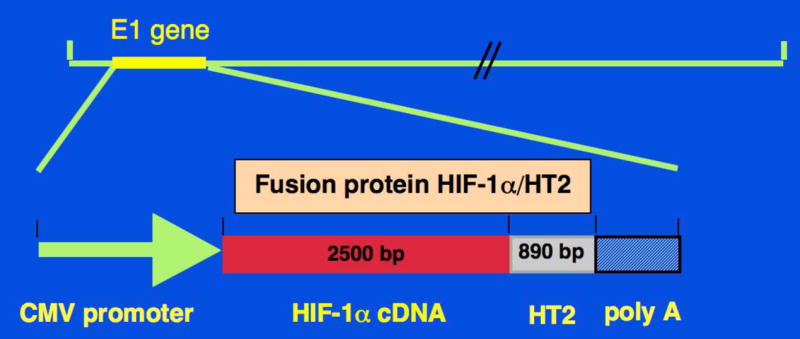
Replication-defective recombinant adenoviral vector expressing fusion protein HIF-1α/HT2 (Ad-HIF-1α/HT2) was generated, in which the Ad5 early region (E1) gene that is required for adenoviral replication, is replaced by the expression cassette that contains the fusion protein.
Figure 10. Adenoviral vector containing fusion protein construct HIF-1α/HT2 (Ad-HIF-1α/HT2) expresses HIF-1α protein.
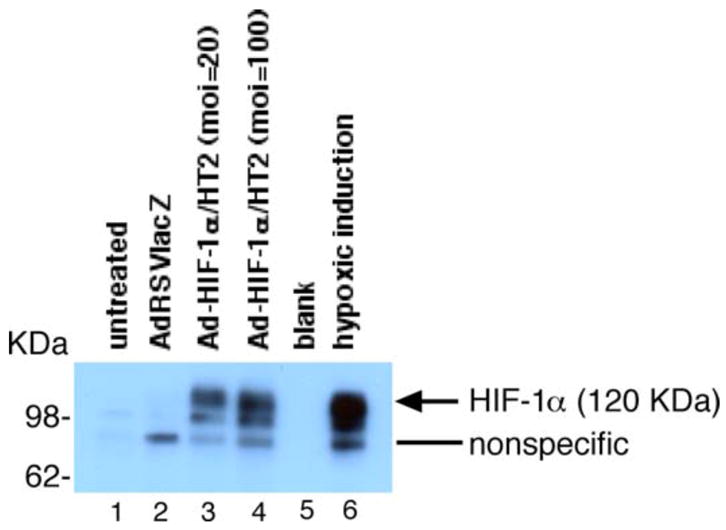
MDA-MB-231 cells were transduced with either no virus (lane 1), control virus (lane 2) or Ad-HIF-1α/HT2 at moi=50 (lane 3) or moi=200 (lane 4) for 72 h. Cell extracts (100 mg per lane) were loaded for Western blot analysis and proceeded using anti-HIF-1α antibody as the primary antibody. As a positive control, cell extracts of MDA-MB-231 cells that were incubated under hypoxic conditions (1% O2, 5% CO2) for 18 h were used for demonstrating endogenous HIF-1α protein induction (lane 6).
To analyze whether p16 expression affects cellular localization of HIF-1α protein, the MDA-MB-231 cells were either transduced with Ad-HIF-1α/HT2 plus AdRSVlacZ, or Ad-HIF-1α/HT2 plus AdRSVp16 for 72 h. As shown in Figure 11, in the absence of p16 protein, HIF-1α protein localizes in the nucleus as indicated by the red fluorescent staining (Figure 11A), an expected cellular location for the transcriptional factors such as HIF-1α. However, in the presence of p16 protein, there is an apparent cellular translocation of HIF-1α protein in the cytoplasm (Figure 11B), indicating that p16 changed cellular location of the HIF-1α protein from the nucleus to the cytoplasm. To further confirm this observation, we did a similar experiment of cotransduction of MDA-MB-231 cells with a fixed dose of Ad-HIF-1α/HT2 and none or an increased dose of AdRSVp16, and the nuclei were counterstained with Hoechst 33258. As shown in Fig. 12A, in the absence of AdRSVp16, all Ad-HIF-1α/HT2 transduced cells expressed HIF-1α protein (bright red) in the nuclei. At low dose of AdRSVp16 (Figure 12B), the cells started to show the blue color---which is otherwise overshadowed by the bright red color, implying that HIF-1α protein (red) is moving away from the nucleus; while at high dose of AdRSVp16 (Figure 12C), a more separate and distinguished red and blue color were observed, suggesting the further translocation of the HIF-1α protein away from the nucleus (blue), with some cells showed an intact blue-stained nucleus surrounded by the red color (see representative arrow). Taken together, Figure 12 has clearly demonstrated that p16 protein shifted HIF-1α protein (red) from the nucleus (blue color) to the cytoplasm. This finding is quite exciting, not only it is the first such kind report to demonstrate that p16 translocates HIF-1α protein from the nucleus to cytoplasm, but also it lights up the way how p16 may downregulate VEGF gene expression---probably by preventing HIF-1α, the transactivator of the VEGF gene, from staying at its supposed location, the nucleus; thus blocking the binding of HIF-1α to the VEGF promoter and consequently transcription activation of the VEGF gene.
Figure 11. p16 changes HIF-1α protein cellular location from the nucleus to the cytoplasm in a dose-dependent manner.
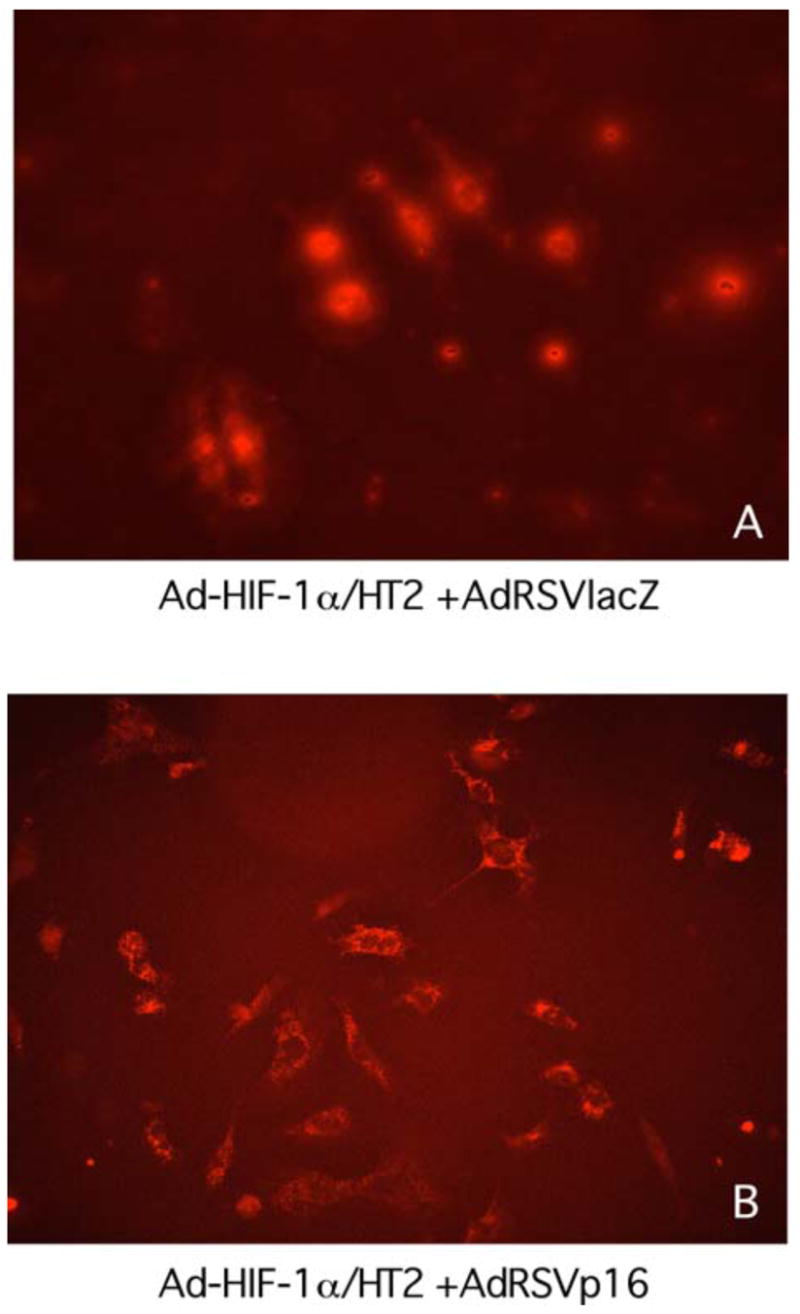
MDA-MB-231 cells were co-transduced for 3 days with either (A) Ad-HIF-1α/HT2 (moi=100) plus AdRSVlacZ (moi=100), or (B) Ad-HIF-1α/HT2 (moi=100) plus AdRSVp16 (moi=100). The cells were labeled with HaloTag TMR ligand to show the cellular location of the reporter HT2 (HaloTag) protein, as an indicator of whereabouts of HIF-1α protein cellular location. The cellular location of HIF-1α protein (i.e., fusion protein HIF-1α/HT2) was indicated as red color.
Figure 12. p16 changes HIF-1α cellular location in a dose-dependent manner.

MDA-MB-231 cells were transduced with a fixed amount of Ad-HIF-1α/HT2 (moi=100) (red) and various dose of AdRSVp16 at moi=0 (A), moi=20 (B), and moi=100 (C) for 3 days. The cells were then labeled with HaloTag TMR ligand and processed as described in Figure 11 legend. The nuclei were counterstained with Hoechst 33258 (blue).
IV. Discussion and conclusions
The inactivation of p16 appears to be a common event in many cancers (Caldas et al, 1994; Jen et al, 1994; Cairns et al, 1995; Hatta et al, 1995; Xiao et al, 1995). Angiogenic capacity correlates with the degree of malignancy and the loss of p16 activity in gallbladder cancer (Quan et al, 2001). Angiogenic capacity correlates with the degree of malignancy and the loss of p16 activity in high-grade gliomas (Harada et al, 1999). Induction of endogenous p16 protein in lung cancer cells, by demethylation agent 5-aza-2′-deoxycytidine of p16 gene promoter, resulted in downregulation of VEGF expression (Miki et al, 2000). Mice with multiple intestinal neoplasia (Min) developed smaller colon tumors, and had much lower VEGF content and vascularity around the tumors, than their INK4A/ARF locus (where the p16 gene locates) knockout counterparts, suggesting that p16 suppresses tumor progression and angiogenesis (Gibson et al, 2003). Loss of p16 expression was reported in human primary breast carcinomas (Brenner et al, 1996; Silva et al, 2003). Consistently, we found a lack or significant reduction of p16 expression in clinical specimens of breast cancer tissues, when compared to normal human breast tissues (Figure 1). Thus, the combined information from literature and our results demonstrate that lack of p16 expression occurs in many cancers including breast cancer, suggesting that p16 may play a role in suppression of tumor angiogenesis and malignancy.
In summary, our studies showed that adenoviral-mediated overexpression of p16 decreased VEGF expression in breast cancer cells. The results of in vitro angiogenesis assay showed that p16 inhibited HEMC cell angiogenesis (in terms of tubular network formation) that was stimulated by conditioned media from MDA-MB-231 cells. Moreover, breast tumors treated with AdRSVp16 had significantly reduced metastases in an animal model. These results together strongly demonstrate that p16 downregulates VEGF gene expression, inhibits tumor-cell induced angiogenesis and suppresses metastasis in breast cancer cells. More excitingly, our study is the first demonstration, to our knowledge, that p16 changes the cellular location of HIF-1α, a nuclear protein and transcriptional activator for VEGF gene promoter, from the nucleus to the cytoplasm. Our future studies will include transient transfection of MDA-MB-231 cells with VEGF promoter-reporter chimeric constructs containing deleted promoter region (such as deletion of hypoxia response element), to further confirm that HIF-1α mediates p16’s regulation of VEGF. In addition, HIF-1α knock out cell line will be used in our future study to evaluate whether p16-mediated VEGF regulation requires HIF-1α. Although MCF-7, the estrogen receptor (ER) positive breast cancer cell line, shares some similar pattern as its ER-negative counterpart, MDA-MB-231 line, in terms of lack of p16 endogenous expression and growth inhibition by exogenous p16 expression (our unpublished data); whether all the results from this study also hold true to ER+ breast cancer cells needs further investigation.
Our study has demonstrated that p16 downregulates VEGF gene expression. Likewise, other tumor suppressor genes p53 (Bouvet et al, 1998) and Rb2/p130 (Claudio et al, 2001) were reported to downregulate VEGF expression and inhibit angiogenesis in colon and lung cancer cells, respectively. However, the link between tumor suppressor genes and angiogenesis remains obscure, in particular, how p16 exactly regulates VEGF expression is not clear. Based on the results of this study, it is speculated that p16 regulates VEGF gene expression at the transcriptional level. Our ongoing study of coimmunoprecipitation assay revealed that p16 appears to directly bind to HIF-1α (data not shown). Based on all these results, we hypothesize that p16 downregulates VEGF gene expression at the transcriptional level by directly binding to HIF-1α, changing HIF-1α’s cellular location from the nucleus (where all genes, including the VEGF gene, are located) to the cytoplasm, thus preventing HIF-1α’s binding (and consequently its transactivation) to the VEGF promoter.
While the number of research studies focusing on breast cancer treatment has increased dramatically in recent years and some therapies of local control appear to be effective, there is still no effective approach to prevent and cure tumor metastasis -- the fatal cause for the death of breast cancer patients. The relative success at local control has been confounded by a general failure to progressively and substantially reduce breast cancer death rates. Thus, a critical need exists to understand and develop effective treatments for those parameters contributing to breast cancer metastasis. This study may have provided an innovative approach to combat and prevent breast cancer metastasis by using tumor suppressor gene p16, which downregulates VEGF gene expression, inhibits breast tumor angiogenesis and suppress secondary tumor formation (metastasis) of breast cancer. Thus, AdRSVp16 may provide a therapeutic tool to be used as a gene therapy approach to potentially suppress breast cancer metastasis when in conjunction with other therapeutic modalities. While adenoviral vectors have high in vivo transduction efficiency, they do not integrate into the host cell chromosome thus they lack sustained expression of the therapeutic transgene, and they cause host immune response (Berkner, 1988) against the repeated adenoviral-mediated gene transfer. Therefore, better gene therapy vector (such as lentiviral vectors) may be pursued to obtain an effective and optimal therapy in clinical application.
Acknowledgments
This study was supported in part by National Institutes of Health grants CA107162 (Y.L.) and DK65962 (Y.L.). We thank Dr. Syamal K. Bhattacharya, and Ms. Patti L. Johnson for reviewing this manuscript.
Abbreviations
- Dulbecco’s Modified Eagle medium
(D-MEM)
- Endothelial Cell Basal Medium-2
(EBM-2)
- fetal bovine serum
(FBS)
- human microvascular endothelial cells
(HMEC)
- Hypoxia-inducible factor-1
(HIF-1)
- immunohistochemical
(IHC)
- recombinant adenovirus expressing p16
(AdRSVp16)
- Reverse transcription-polymerase chain reaction
(RT-PCR)
- Rous sarcoma virus
(RSV)
- sodium dodecylsulfate
(SDS)
- Vascular endothelial growth factor
(VEGF)
References
- Azuma H, Takahara S, Ichimaru N, Wang JD, Itoh Y, Otsuki Y, Morimoto J, Fukui R, Hoshiga M, Ishihara T, Nonomura N, Suzuki S, Okuyama A, Katsuoka Y. Marked prevention of tumor growth and metastasis by a novel immunosuppressive agent, FTY720, in mouse breast cancer models. Cancer Res. 2002;62:1410–1419. [PubMed] [Google Scholar]
- Berkner KL. Development of adenovirus vectors for the expression of heterologous genes. BioTechniques. 1988;6:616–629. [PubMed] [Google Scholar]
- Bouvet M, Ellis LM, Nishizaki M, Fujiwara T, Liu W, Bucana CD, Fang B, Lee JJ, Roth JA. Adenovirus-mediated wild-type p53 gene transfer down-regulates vascular endothelial growth factor expression and inhibits angiogenesis in human colon cancer. Cancer Res. 1998;58:2288–2292. [PubMed] [Google Scholar]
- Brem SS, Gullino PM, Medina D. Angiogenesis, a marker for neoplastic transformation of mammary papillary hyperplasia. Science. 1997;195:880–881. doi: 10.1126/science.402692. [DOI] [PubMed] [Google Scholar]
- Brenner AJ, Paladugu A, Wang H, Olopade OI, Dreyling MH, Aldaz CM. Preferential loss of expression of p16(INK4a) rather than p19(ARF) in breast cancer. Clin Cancer Res. 1996;2:1993–1998. [PubMed] [Google Scholar]
- Cairns P, Polascik TJ, Eby Y, Sidransky D. High frequency of homozygous deletion at p16/CDKN2 in primary human tumors. Nature Genet. 1995;11:210–212. doi: 10.1038/ng1095-210. [DOI] [PubMed] [Google Scholar]
- Caldas C, Hahn SA, De Costa LT, Redston MS, Schutte M, Seymour AB, Weistein CL, Hruban RH, Yeo CJ, Kern SE. Frequent somatic mutations and homozygous deletions of the p16 (MTS1) gene in pancreatic adenocarcinoma. Nature Genet. 1994;8:27–32. doi: 10.1038/ng0994-27. [DOI] [PubMed] [Google Scholar]
- Chen WT, Huang CJ, Wu MT, Yang SF, Su YC, Chai CY. Hypoxia-inducible factor-1alpha is associated with risk of aggressive behavior and tumor angiogenesis in gastrointestinal stromal tumor. Jpn J Clin Oncol. 2005;35:207–213. doi: 10.1093/jjco/hyi067. [DOI] [PubMed] [Google Scholar]
- Claudio PP, Stiegler P, Howard CM, Bellan C, Minimo C, Tosi GM, Rak J, Kovatich A, De Fazio P, Micheli P, Caputi M, Leoncini L, Kerbel R, Giordano GG, Giordano A. RB2/p130 gene-enhanced expression down-regulates vascular endothelial growth factor expression and inhibits angiogenesis in vivo. Cancer Res. 2001;61:462–468. [PubMed] [Google Scholar]
- Esposito NN, Mohan D, Brufsky A, Lin Y, Kapali M, Dabbs DJ. Phyllodes tumor: a clinicopathologic and immunohistochemical study of 30 cases. Arch Pathol Lab Med. 2006;130:1516–1521. doi: 10.5858/2006-130-1516-PTACAI. [DOI] [PubMed] [Google Scholar]
- Ferrara N, Henzel WJ. Pituitary follicular cells secrete a novel heparin-binding growth factor specific for vascular endothelial cells. Biochem Biophys Res Commun. 1989;161:851–858. doi: 10.1016/0006-291x(89)92678-8. [DOI] [PubMed] [Google Scholar]
- Folkman J. Tumor angiogenesis, therapeutic implications. N Engl J Med. 1971;285:1182–1186. doi: 10.1056/NEJM197111182852108. [DOI] [PubMed] [Google Scholar]
- Forsythe JA, Jiang BH, Iyer NV, Agani F, Leung SW, Koos RD, Semenza GL. Activation of vascular endothelial growth factor gene transcription by hypoxia-inducible factor 1. Mol Cell Biol. 1996;16:4604–4613. doi: 10.1128/mcb.16.9.4604. [DOI] [PMC free article] [PubMed] [Google Scholar]
- Gibson SL, Dai CY, Lee HW, DePinho RA, Gee MS, Lee WM, Furth EE, Brensinger C, Enders GH. Inhibition of colon tumor progression and angiogenesis by the Ink4a/ARF locus. Cancer Res. 2003;15:742–746. [PubMed] [Google Scholar]
- Graham FL, Prevec L. Gene transfer and expression protocols. In: Murray EJ, editor. Methods in Molecular Biology. Vol. 7. Humana Press; Totowa, New Jersey: 1991. pp. 109–128. [Google Scholar]
- Hanahan D, Folkman J. Patterns and emerging mechanisms of the angiogenic switch during tumorigenesis. Cell. 1996;86:353–364. doi: 10.1016/s0092-8674(00)80108-7. [DOI] [PubMed] [Google Scholar]
- Harada H, Nakagawa K, Iwata S, Saito M, Kumon Y, Sakaki S, Sato K, Hamada K. Restoration of wild type p16 down-regulates vascular endothelial growth factor expression and inhibits angiogenesis in human gliomas. Cancer Res. 1999;59:3783–3789. [PubMed] [Google Scholar]
- Hatta Y, Hirama T, Miller CW, Tomonaga M, Koeffler HP. Homozygous deletions of the p15 (MTS2) and p16 (CDKN2/MTS1) genes in adult T-cell leukemia. Blood. 1995;85:2699–2704. [PubMed] [Google Scholar]
- Heffelfinger SC, Miller MA, Yassin R, Gear R. Angiogenic growth factors in preinvasive breast disease. Clin Cancer Res. 1999;5:2867–2876. [PubMed] [Google Scholar]
- Hiraga T, Kizaka-Kondoh S, Hirota K, Hiraoka M, Yoneda T. Hypoxia and hypoxia-inducible factor-1 expression enhance osteolytic bone metastases of breast cancer. Cancer Res. 2007;67:4157–4163. doi: 10.1158/0008-5472.CAN-06-2355. [DOI] [PubMed] [Google Scholar]
- Houck KA, Ferrara N, Winer J, Cachianes G, Li B, Leung DW. The vascular endothelial growth factor family, identification of a fourth molecular species and characterization of alternative splicing of RNA. Mol Endocrinol. 1991;5:1806–1814. doi: 10.1210/mend-5-12-1806. [DOI] [PubMed] [Google Scholar]
- Jemal A, Siegel R, Ward E, Murray T, Xu J, Thun MJ. Cancer Statistic, 2007. CA Cancer J Clin. 2007;57:43–66. doi: 10.3322/canjclin.57.1.43. [DOI] [PubMed] [Google Scholar]
- Jen J, Harper JW, Bigner SH, Bigner DD, Papadopoulos N, Markowitz S, Willson JKV, Kinzler KW, Vogelstein B. Deletion of p16 and p15 genes in brain tumors. Cancer Res. 1994;54:6353–6358. [PubMed] [Google Scholar]
- Kim YM, Lee YM, Kim HS, Kim JD, Choi Y, Kim KW, Lee SY, Kwon YG. TNF-related activation-induced cytokine (TRANCE) Induces angiogenesis through the activation of Src and phospholipase C (PLC) in human endothelial cells. J Biol Chem. 2002;277:6799–6805. doi: 10.1074/jbc.M109434200. [DOI] [PubMed] [Google Scholar]
- Lu Y, Whitaker LL, Li X, Lotan D, Lotan R. Co-expression of galectin-1 and its complementary glycoconjugates laminin and lysosome-associated membrane proteins in murine PCC4.aza1R embryonal carcinoma cells induced to differentiation by butyrate. Mol Cell Differ. 1995;3:175–191. [Google Scholar]
- Lu Y, Carraher J, Zhang Y, Armstrong J, Lerner J, Roger W, Steiner MS. Delivery of adenoviral vectors to the prostate for gene therapy. Cancer Gene Ther. 1999;6:64–72. doi: 10.1038/sj.cgt.7700011. [DOI] [PubMed] [Google Scholar]
- Lu Y, Zhang J, Beech DJ, Myers LK, Jennings LK. p16 downregulates VEGF and inhibits angiogenesis in breast cancer cells. Cancer Ther. 2003;1:143–151. [Google Scholar]
- Los GV, Darzins A, Karassina N, Zimprich C, Learish R, Mcdougall MG, Encell LP, Friedman-Ohana R, Wood M, Vidugiris G, Zimmerman K, Otto P, Klaubert DH, Wood KV. HaloTag Interchangeable Labeling Technology for cell imaging and protein capture. Cell Notes. 2005;11:2–6. doi: 10.1021/cb800025k. [DOI] [PubMed] [Google Scholar]
- Marshall E. Breast cancer research, a special report. Search for a killer, focus shifts from fat to hormones. Science. 1993;259:618–621. doi: 10.1126/science.8430308. [DOI] [PubMed] [Google Scholar]
- Miki K, Shimizu E, Yano S, Tani K, Sone S. Demethylation by 5-aza-2′-deoxycytidine (5-azadC) of p16INK4A gene results in downregulation of vascular endothelial growth factor expression in human lung cancer cell lines. Oncol Res. 2000;12:335–342. doi: 10.3727/096504001108747783. [DOI] [PubMed] [Google Scholar]
- Quan ZW, Wu K, Wang J, Shi W, Zhang Z, Merrell RC. Association of p53, p16, vascular endothelial growth factor protein expressions with the prognosis and metastasis of gallbladder cancer. J Am Coll Surg. 2001;193:380–383. doi: 10.1016/s1072-7515(01)01012-2. [DOI] [PubMed] [Google Scholar]
- Sartippour MR, Shao ZM, Heber D, Beatty P, Zhang L, Liu C, Ellis L, Liu W, Go VL, Brooks MN. Green tea inhibits vascular endothelial growth factor (VEGF) induction in human breast cancer cells. J Nutr. 2002;132:2307–2311. doi: 10.1093/jn/132.8.2307. [DOI] [PubMed] [Google Scholar]
- Semenza GL. Hydroxylation of HIF-1, oxygen sensing at the molecular level. Physiology. 2004;19:176–82. doi: 10.1152/physiol.00001.2004. [DOI] [PubMed] [Google Scholar]
- Shapiro GI, Rollins BJ. p16INK4A as a human tumor suppressor. Biochem Biophys Acta. 1996;1242:165–169. doi: 10.1016/0304-419x(95)00011-4. [DOI] [PubMed] [Google Scholar]
- Silva J, Silva JM, Dominguez G, Garcia JM, Cantos B, Rodriguez R, Larrondo FJ, Provencio M, Espana P, Bonilla F. Concomitant expression of p16INK4a and p14ARF in primary breast cancer and analysis of inactivation mechanisms. J Pathol. 2003;199:289–297. doi: 10.1002/path.1297. [DOI] [PubMed] [Google Scholar]
- Steeg PS, Hartsough MT, Clare SE. Nm23, breast differentiation, cancer metastasis. In: Bowcock AM, editor. Breast Cancer. Humana Press; Totowa, New Jersey: 1998. pp. 267–283. [Google Scholar]
- Steiner MS, Zhang Y, Carraher J, Lu Y. In vivo expression of prostate specific adenoviral vectors in a canine model. Cancer Gene Ther. 1999;6:456–464. doi: 10.1038/sj.cgt.7700065. [DOI] [PubMed] [Google Scholar]
- Steiner MS, Zhang Y, Farooq F, Lerner J, Wang Y, Lu Y. Adenoviral vector containing wild type p16 suppresses prostate cancer growth and prolongs survival by inducing cell senescence. Cancer Gene Ther. 2000;7:360–372. doi: 10.1038/sj.cgt.7700151. [DOI] [PubMed] [Google Scholar]
- Weidner N, Semple JP, Welch WR, Folkman J. Tumor angiogenesis and metastasis--correlation in invasive breast carcinoma. N Engl J Med. 1991;324:1–8. doi: 10.1056/NEJM199101033240101. [DOI] [PubMed] [Google Scholar]
- Xiao S, Li D, Corson JM, Vijg J, Fletcher JA. Codeletion of p15 and p16 genes in primary non-small cell lung carcinoma. Cancer Res. 1995;55:2968–2971. [PubMed] [Google Scholar]
- Yu E, Ahn YS, Jang SJ, Kim MJ, Yoon HS, Gong G, Choi J. Overexpression of the wip1 gene abrogates the p38 MAPK/p53/Wip1 pathway and silences p16 expression in human breast cancers. Breast Cancer Res Treat. 2007;101:269–278. doi: 10.1007/s10549-006-9304-y. [DOI] [PubMed] [Google Scholar]