

Summary
Ephrin-As and their receptors, EphAs, are expressed in the developing cortex where they may act to organize thalamic inputs. Here, we map the visual cortex (V1) in mice deficient for ephrin-A2, -A3, and -A5 functionally, using intrinsic signal optical imaging and microelectrode recording, and structurally, by anatomical tracing of thalamocortical projections. V1 is shifted medially, rotated, and compressed and its internal organization is degraded. Expressing ephrin-A5 ectopically by in utero electroporation in the lateral cortex shifts the map of V1 medially, and expression within V1 disrupts its internal organization. These findings indicate that interactions between gradients of EphA/ephrin-A in the cortex guide map formation, but that factors other than redundant ephrin-As are responsible for the remnant map. Together with earlier work on the retinogeniculate map, the current findings show that the same molecular interactions may operate at successive stages of the visual pathway to organize maps.
Introduction
The mammalian cerebral cortex is organized into modality-specific areas that are innervated by their corresponding thalamic nuclei. Within each cortical area, the thalamocortical (TC) axons are organized into topographic maps, which are thought to ensure that sensory information is processed correctly. Recent findings suggest that the initial broad patterning of the cortex into different areas occurs embryonically and is regulated by signaling molecules and transcription factors expressed in the developing cortex (Grove and Fukuchi-Shimogori, 2003; Rakic, 1988). Topographic mapping within a given area occurs perinatally (in rodents) and depends, at least in part, on the activity patterns and molecular cues carried by TC axons (Dufour et al., 2003; Lopez-Bendito and Molnar, 2003; O’Leary, 1989; Sur and Leamey, 2001). The identities and the mechanism of action of the molecules that guide TC axons to the proper cortical areas and mediate the establishment of functional topographic maps of TC axons within each cortical area are largely unknown.
The Eph family of receptor tyrosine kinases and their cell-surface bound ligands, ephrins, are likely candidates for patterning TC axons. Eph receptors and ephrins play important roles in many processes of neural development. Most notably, they act as positional labels in the establishment of topographic maps by triggering contact-mediated repulsion or attraction (Bolz et al., 2004; Flanagan and Vanderhaeghen, 1998; Hansen et al., 2004; McLaughlin et al., 2003; Wilkinson, 2001). A role for EphA/ephrin-A interactions in patterning TC axons has been inferred from their normal graded expression patterns in the developing thalamus and cortex (Donoghue and Rakic, 1999a; Donoghue and Rakic, 1999b; Gao et al., 1998; Mackarehtschian et al., 1999; Sestan et al., 2001; Vanderhaeghen et al., 2000) and from defects in ephrin-A knockout mice (Dufour et al., 2003; Uziel et al., 2002; Vanderhaeghen et al., 2000). For example, in EphA4/ephrin-A5 double mutant mice, the topographic mapping of TC axons to the somatosensory cortex is perturbed, and the somatosensory cortex also receives aberrant projections from the motor thalamic nucleus (Dufour et al., 2003). These results suggest that Ephs and ephrins are involved in the routing of TC axons through the ventral forebrain, to determine their rostrocaudal targeting, and are used in the cortex for topographic mapping (Garel and Rubenstein, 2004; Vanderhaeghen and Polleux, 2004). However, the phenotypes in most loss-of-function studies are often subtle and only partially penetrant, leaving the possibility that either other EphA receptors or ephrin-A ligands act redundantly (with those knocked out), or that non-EphA/ephrin-A mechanisms exist to compensate in these projections. In addition, these experiments have largely depended on anatomical methods (except for Prakash et al., 2000), and therefore the extent to which cortical function is altered in ephrin mutants remains unknown.
With the development of intrinsic signal imaging, it is now possible to carry out functional analyses of cortical organization in the mouse visual system (Kalatsky and Stryker, 2003). This method allows for rapid determination of detailed retinotopic maps of several areas in the adult mouse visual cortex. Therefore, in the first set of experiments in the present study, we combined this new imaging method of functional analysis with classical anatomical tracing to examine the patterning of visual TC axons in mice deficient for ephrin-A2, ephrin-A3, and ephrin-A5, the three ephrin-As that account for almost all ephrin-A ligand expression in the developing visual thalamus and cortex (Pfeiffenberger et al., 2005 and present study). In ephrin-A2/A3/A5 triple knockout (ephrin-A TKO) mice, we find that the TC projection from the dorsal lateral geniculate nucleus (dLGN) to the visual cortex shows abnormal topographic mapping. Functional imaging in ephrin-A TKOs reveals that the primary visual area (V1) is rotated and shifted medially and that the internal organization of the visuotopic map is disrupted. To confirm the cortical origin of these defects, we misexpress ephrin-A ligands in the embryonic cortex and allow animals to develop. The ectopic expression of ephrin-A5 in regions lateral to the visual cortex causes V1 to shift medially. Furthermore, when ephrin-A5 or ephrin-A2 is ectopically expressed within the visual cortex, its functional topography is locally disrupted.
Taken together, these experiments demonstrate that the ephrin-A ligands are required for two processes of visual TC axon patterning along the medial-lateral axis: (1) positioning—determining the location of a cortical area on the cortical plate, and (2) internal organization—guiding the orderly layout of a map within a cortical area. They indicate that EphA/ephrin-A interactions may be used at multiple stages in the visual system to guide the formation of topographic maps.
Results
EphA Receptor and Ephrin-A Ligand Expression in the Developing Thalamocortical Visual Projection
The retina projects to multiple subcortical areas including the superior colliculus (SC) in the midbrain and the dorsal lateral geniculate nucleus (dLGN) in the thalamus. Visual information destined to be processed for perception is transferred from the dLGN to the primary visual cortex (V1), located near the caudal pole of the hemispheres. V1 in turn projects to higher-order visual areas, most notably the secondary visual cortex (V2). Each visual area contains a topographic representation of the visual field that is maintained through connections between visual areas. In the mouse visual system, the nasal-temporal axis of the visual field (azimuth) maps along the ventral-lateral to dorsal-medial axis of the dLGN, which, in turn, maps roughly along the medial-lateral axis of V1 and V2. Gradients of ephrin-A ligands and EphA receptors are expressed in the retina and in retinal targets, where they are required for establishing normal retinotopic maps (Feldheim et al., 2000, 2004, 1998; Frisén et al., 1998; Rashid et al., 2005).
In the dLGN, ephrin-A2 and ephrin-A5 are expressed in a ventral-lateral-anterior (high) to dorsal-medial-posterior (low) gradient, whereas EphA7, and probably other EphA receptors, are expressed in the opposite gradient (Feldheim et al., 1998; Pfeiffenberger et al., 2005 and Figure 1). Ephrin-A3 is expressed at low levels in the dLGN and dorsal thalamus (Feldheim et al., 1998; Pfeiffenberger et al., 2005). EphA/ephrin-A expression in the dLGN suggests a model whereby EphA/ephrin-A gradients are used to target dLGN neurons to V1 in a mechanism similar to that used to target retinal axons to the dLGN. Therefore, we examined the expression patterns of ephrin-A and EphA family members along the medial-lateral axis of the posterior cortex and compared this to the expression of cadherin-8 (Cad8). Cad8 is a homophilic cell adhesion protein expressed in patterns that mark primary and secondary visual cortex in early postnatal mice (Hamasaki et al., 2004; Suzuki et al., 1997). Consistent with previous observations by others in mouse, rat, and monkey (Flanagan et al., 2000; Sestan et al., 2001; Yun et al., 2003), we found complementary expression of EphA receptors and ephrin-A ligands in the posterior cortex that falls within the Cad8 expression area (Figure 1 and Figure S1). At postnatal day 4 (P4), Cad8 is expressed in layers 2/3 and 4 of the posterior cortex. Cad8 expression is continuous in layer 4, but is in a distinct part of the dorsomedial posterior cortex in layers 2/3, potentially encompassing presumptive V1 and V2 (Figure 1A) (Suzuki et al., 1997). Whole-mount RNA in situ hybridization of wild-type (WT) P4 brains for Cad8 expression showed that Cad8 is expressed in a wedge-shaped area in the posterior cortex (Figure 1J). The Cad8 expression pattern has a similar tilt and orientation, with respect to the midline, to those of visual areas measured functionally in adult mice, suggesting that Cad8 is a marker of visual cortex. Two EphA receptors, EphA7 and EphA4, have expression patterns similar to those of Cad8 in the posterior cortex, but have a slight peak of expression within the Cad8-expressing area (Figures 1B and 1C). This peak may represent the boundary between V1 and V2, but this cannot be verified without a V1- or V2-specific marker.
Figure 1. Expression of EphA Receptors and Ephrin-A Ligands in the Developing Visual Cortex.
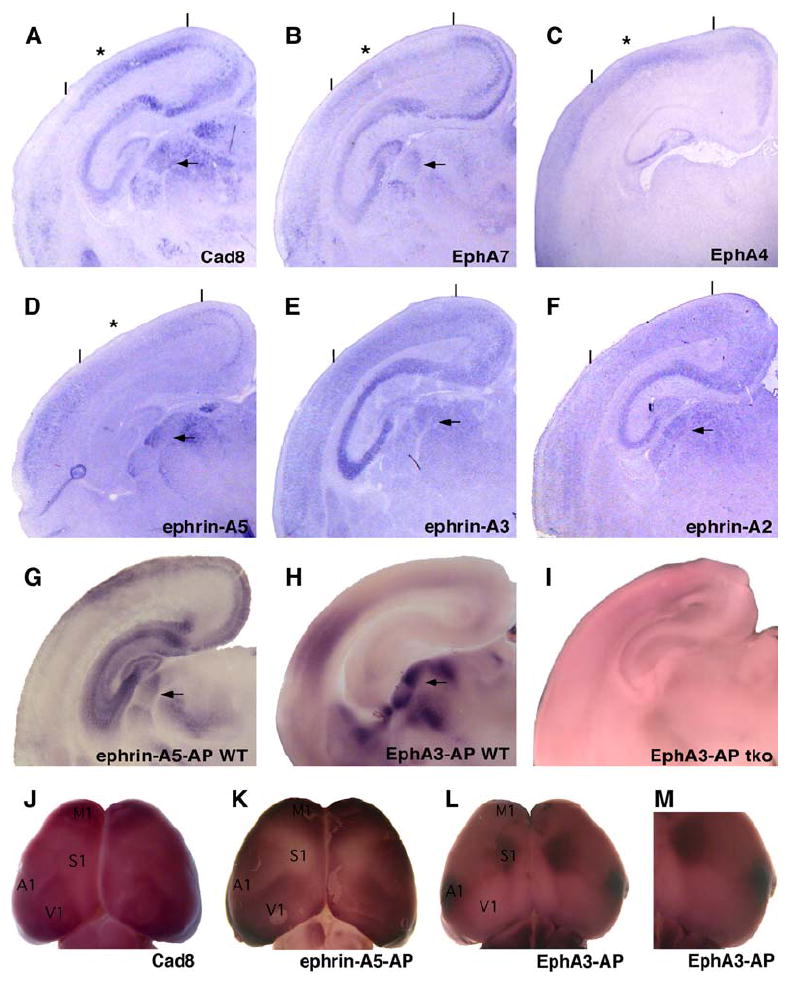
(A–F) Coronal sections from P4 mouse posterior cortex were treated with hybridization probes for Cadherin-8 (Cad8) (A), EphA7 (B), EphA4 (C), ephrin-A5 (D), ephrin-A3 (E), and ephrin-A2 (F). * indicates inflection point in expression. (G–I) Coronal sections were stained with ephrin-A5-AP (G) in wild-type (WT) or EphA3-AP (H and I) in WT and ephrin-A TKO mice. Lines indicate approximate boundaries of the visual cortex as assayed by Cad8 expression. Arrows indicate dLGN. Dorsal is at the top, medial is at the right of each panel. (J–M) Whole-mount views comparing Cad8 RNA expression with EphA and ephrin-A protein expression in P4 cortex. (J) Whole-mount RNA in situ hybridization detecting Cad8 RNA expression. (K) Ephrin-A5-AP (detects EphA protein) staining shows EphA protein overlapping with Cad8 in posterior cortex. (L and M) EphA3-AP (detects ephrin-A protein) shows a complementary binding pattern to that of ephrin-A5-AP that is highest surrounding Cad8. M1, primary motor cortex; S1, primary somatosensory cortex; A1, primary auditory cortex; V1, primary visual cortex. Location of the cortical areas is approximate at P4 and is based on (Hamasaki et al., 2004).
Ephrin-A5 exhibited an expression pattern complementary to that of EphA4 and EphA7, being highest in the region where receptor expression is lowest and vice-versa (Figure 1D and Figure S1). Ephrin-A5 was expressed at highest levels lateral and medial to the Cad8 expression areas and at low levels within it. Ephrin-A2 and ephrin-A3 were expressed in the cortex at low levels in a high medial to low lateral pattern (Figures 1E and 1F). Whole-mount treatment of WT P4 cortex with an EphA3-alkaline phosphatase (AP) fusion protein or an ephrin-A5-AP fusion protein that detects ephrin-As and EphAs, respectively (Flanagan et al., 2000) showed complementary staining patterns throughout the cortex (Figures 1K and 1L). Notably, ephrin-A expression was high in areas surrounding Cad8-expressing areas (Figures 1L and 1M). These expression patterns are consistent with the idea that gradients of EphA/ephrin-A are used to map visual TC projections in a manner similar to their use in the mapping of the retinocollicular and retinogeniculate projections (Brown et al., 2000; Hansen et al., 2004; Rashid et al., 2005). Ephrin-A2, -A3, and -A5 account for almost all of the ephrin-A expression in the cortex, as determined by the lack of binding to EphA3-AP in cortical sections derived from mice deficient in ephrin-A2, -A3, and -A5 (ephrin-A TKO mice, Figure 1I).
Defective Maps of Cortical Retinotopy in Ephrin-A TKO Mice
To determine the requirement for ephrin-As in cortical patterning and topographic mapping, we compared the functional and anatomical innervation patterns of V1 in WT mice with those in the ephrin-A TKOs. Using intrinsic signal imaging (Kalatsky and Stryker, 2003), we delineated detailed retinotopic maps of V1 in the adult mouse visual cortex. In this method, anesthetized mice were stimulated by thin bars drifting continuously and periodically across a video monitor 25 cm away. The optical signal of each pixel of the imaged cortical area was extracted by Fourier analysis at the stimulus frequency to obtain the values of response amplitude and phase relative to the position of the drifting bar on the monitor. The phase value of each pixel was converted to degrees of visual angle and displayed according to a color scale corresponding to the functional retinotopic map (Figure 2). The bars drifted either vertically or horizontally to obtain elevation and azimuth maps, respectively.
Figure 2. Abnormal Retinotopic Maps in the Cortex of Ephrin-A TKOs.
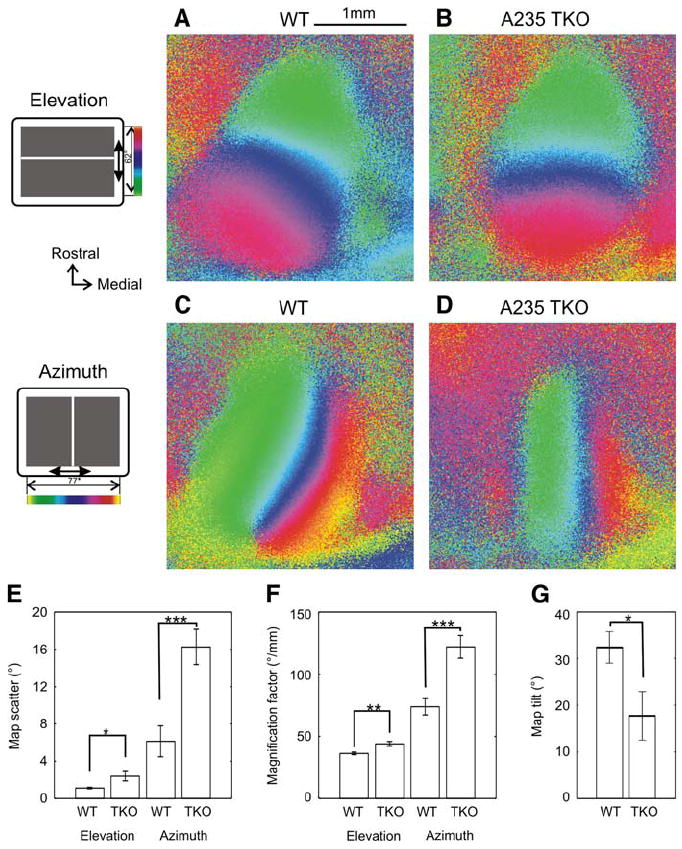
(A and B) Cortical elevation maps of a WT (A) and an ephrin-A TKO mouse (B). The color code used to represent positions of different elevation lines on the stimulus monitor is shown to the left of (A). (C and D) Azimuth maps of the same WT (C) and ephrin-A TKO mouse (D). The color code is shown to the left. (E) Map scatters of cortical retinotopy. Both elevation and azimuth maps of ephrin TKOs were more scattered than the control maps (*p < 0.05; ***p < 0.001). (F) Ephrin-A TKOs have bigger cortical magnification factors for both elevation (**p < 0.01) and azimuth (***p < 0.001). (G) The orientation of V1 in relation to the lambda suture is altered in the ephrin-A TKO (*p < 0.05). Error bars represent the mean ± SEM.
Examples of cortical retinotopic maps from WT and ephrin-A TKOs are shown in Figure 2 and Figure S2. Although the gross polarity of the retinotopic map in V1 was largely normal in the ephrin-A TKOs, the progression of the receptive field (RF) position along the retinotopic maps was more scattered, and this defect was especially severe for the azimuth map. To compare the maps quantitatively, we computed the “map scatter” by calculating the differences between the phase values of the individual pixels within the visual area to those of their near neighbors (Figure 2E). For maps with high quality and strong visual response, these phase differences should be quite small due to the smooth progression. Indeed, for the WT elevation maps, the standard deviation of the difference was only 1.1 ± 0.1° (n = 12), while in ephrin-A TKOs the elevation maps had more than twice the scatter (2.4 ± 0.5°, n = 13), significantly different from WT (p < 0.05). We analyzed the azimuth maps similarly and found that they were more severely defective in the ephrin-A TKOs (scatter of 16.3 ± 1.9° [n = 13] compared to WT: 5.5 ± 1.7° [n = 12]; p < 0.001). The relatively large scatter in WT azimuth maps was mainly due to the fact that the pixels included for the analyses were chosen on the basis of their response magnitude in the elevation map (see Experimental Procedures). We next calculated the cortical magnification factors, defined as degrees of visual space represented by unit length in the visual cortex (Figure 2F). The magnification factors of the ephrin-A TKOs were significantly greater for both elevation (WT: 36.2 ± 1.1°/mm [n = 12] versus TKO: 44.0 ± 1.9°/mm [n = 13]; p < 0.01) and azimuth (WT: 73.8 ± 6.6°/mm [n = 12] versus TKO: 122.0 ± 9.2°/mm [n = 13]; p < 0.001). Finally, we found that the orientation of the map of V1 was rotated in the ephrin-A TKOs (Figure 2G). In WT mice, the 0° isoelevation line (a line connecting the pixels that have the same phase value in elevation) had an angle of 32.4 ± 3.4 deg (n = 12) in relation to the lambda suture, while that of the ephrin-A TKOs was 17.8 ± 5.2 deg (n = 12; p < 0.05).
To confirm that the defect of cortical retinotopy in the ephrin-A TKOs revealed by optical imaging resulted from poor RF organization of cortical cells, we carried out multiunit recording using microelectrodes (Figure 3). We determined the response patterns of visual cortical neurons to horizontal or vertical bars sweeping across the stimulus monitor. A typical response from recordings of wild-type mice is shown in Figure 3A, where the sweeping bar evoked spiking responses when moving in the RF. Although the majority of response patterns in ephrin-A TKOs were similar to those in WT, about 20% (n = 29/166 for azimuth) of recording sites, across all layers of the cortex, displayed multiple, discontinuous peaks of spike activity in response to the continuously moving bar (Figure 3A). To quantify the difference, we calculated the extent of the visual space that elicited responses for individual recording sites (Figures 2B and 2C). For vertical bars moving horizontally (azimuth), as a result of the multiple peaks, the RF extent was significantly greater in the ephrin-A TKOs (41.2 ± 1.4° [n = 166] compared to wild-type: 39.1 ± 1.0° [n = 148]; p = 0.02, Kolmogorov-Smirnov [K-S] test, Figure 3B). For the elevation, although response patterns with multiple peaks were also seen in the ephrin-A TKOs (data not shown), their RF extent was similar to that in WT mice (WT: 38.5 ± 1.0° [n = 169]; TKO: 38.5 ± 1.1° [n = 173]; p = 0.29, Kolmogorov-Smirnov test, Figure 3C). Together with the findings of the optical imaging studies, these results demonstrate that the functional cortical retinotopy is defective in ephrin-A TKO mice and that the defect is especially severe along the axis of azimuth, consistent with the axis of graded Eph/ephrin expression.
Figure 3. Abnormal Cortical Response Patterns in Ephrin-A TKOs.
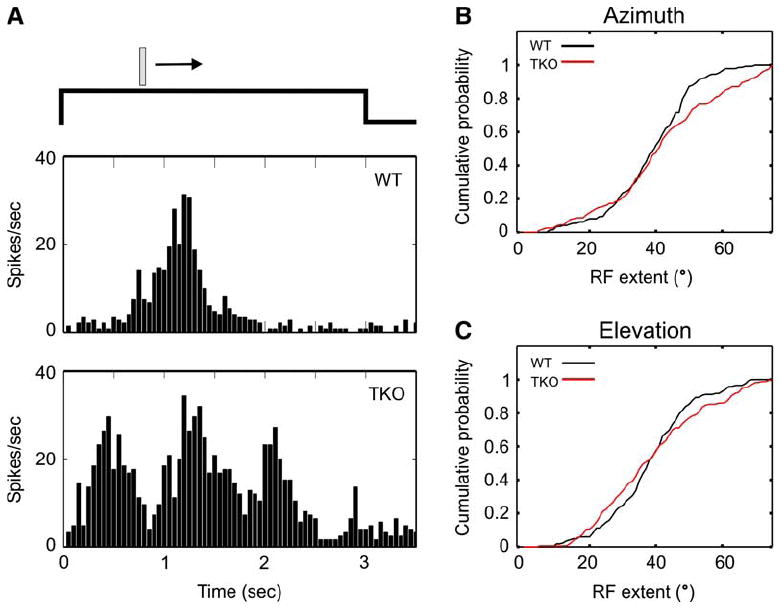
(A) Examples of cortical spiking responses to a moving bar. The peristimulus time histogram (PSTH) of a typical WT response is shown in the upper panel. About 20% of recording sites in ephrin-A TKOs displayed multiple peaks in response to the moving bar, and a representative example is shown in the bottom panel.
(B and C) Cumulative probability plots of the extent of the visual space that elicited responses for individual recording sites. For azimuth (B), the receptive field (RF) extent was significantly greater in the ephrin-A TKO (p = 0.02, K-S test). For elevation (C), the RF extent was similar between WT and ephrin-A TKOs (p = 0.29, K-S test).
Abnormal Visual Thalamocortical Projection Patterns in Ephrin-A TKO
Because retinotopic mapping of the primary retinal projections is abnormal in mice deficient for ephrin-As (Feldheim et al., 2000, 1998; Frisén et al., 1998; Pfeiffenberger et al., 2005), the defective retinotopic maps in the primary visual cortex of ephrin-A TKOs revealed by our functional studies could simply reflect a defective retinogeniculate map. To determine directly whether the geniculocortical projections are disrupted in the ephrin-A TKOs, we examined the geniculocortical map anatomically by injecting tracers into V1 to retrogradely label dLGN neurons. Following functional imaging (Figures 4A and 4B), the neuronal tracer cholera toxin subunit B (CTB) was injected at defined topographic locations within V1. For a given cortex, two colors of CTBs were injected approximately 500 μm apart. In WT mice, retrogradely labeled dLGN neurons of the same color were nicely clustered and located in a topographic manner (Figure 4E). In contrast, the ephrin-A TKOs displayed dramatically different patterns of labeling (Figures 4C and 4D). For many injections, the labeled cells were dispersed over large areas of the dLGN (green labels in Figure 4), and for others, the labeled cells were more dispersed than those in the controls despite some level of clustering (red labels in Figure 4).
Figure 4. Abnormal Geniculocortical Projection Patterns in Ephrin-A TKOs.
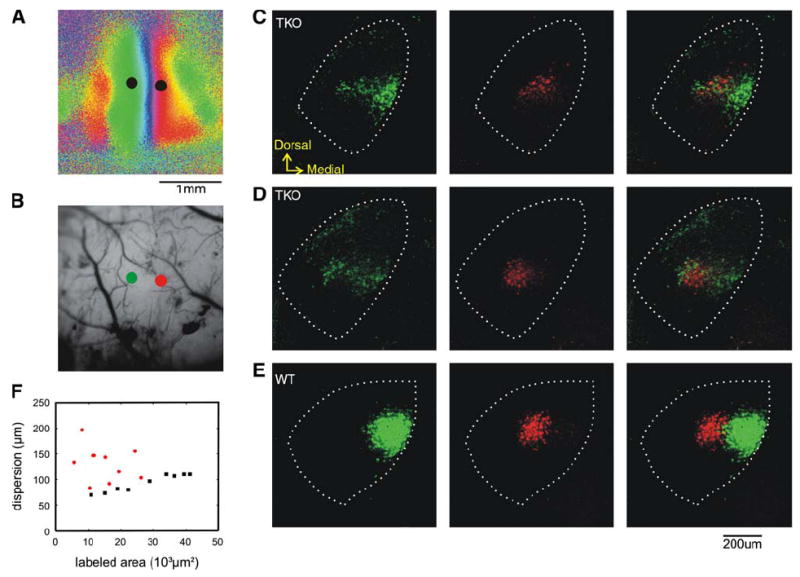
(A and B) Azimuth map (A) of an ephrin-A TKO and the vascular pattern (B) in the region of cortex imaged. The two dots on each panel indicate the positions where the retrograde labeling marker CTBs were injected. In (B), the green and red dots mark the injection positions of the corresponding color of CTB.
(C–E) Retrogradely labeled dLGN neurons in this ephrin-A TKO ([C] and [D] show two different coronal sections) and a WT control (E). Neurons labeled by CTB-Alexa488 (green, left column), CTB-Alexa568 (red, middle column), and the overlay of the two (right column) are shown. In all of the panels, dotted lines mark the border of the dLGN.
(F) Quantification of label dispersion in the dLGN. The distance within which 80% of the labeled pixels were found is plotted against the area occupied by labeled pixels. Red dots, ephrin-A TKO, black dots, wild-type.
To quantify the differences between WT and ephrin-A TKOs, we measured the dispersion as the distance from the center of the labeling area within which 80% of labeled pixels were found. As expected, in WT, a larger labeled area correlated with greater dispersion (Figure 4F). The dispersion of the ephrin-A TKOs (131.5 ± 10.8 μm, n = 10) was significantly greater than that of the WT (93.2 ± 5.6 μm, n = 9; p < 0.01) and was not due to a larger labeled area (Figure 4F). In conclusion, the orderly pattern of TC projections from the dLGN to the visual cortex is severely disrupted in mice deficient for ephrin -A2, -A3, and -A5.
Position Shift of the Visual Cortex in Ephrin-A TKO Mice
As shown in Figure 2, the V1 map of ephrin-A TKOs was rotated and compressed along the azimuthal axis. Using the same imaging method, we also found that the position of the visual cortex in the ephrin-A TKOs was shifted medially. We used the location of the 0° elevation line (corresponding to the midline of the stimulus monitor) at the V1/V2 border as the reference point to mark the position of the primary visual area and measured its distance to the midline and lambda suture. V1 was clearly shifted medially in ephrin-A TKOs (Figures 5A–5C; from midline suture, 2.8 ± 0.08 mm [n = 9]; WT: 3.3 ± 0.04 mm [n = 5]; p < 0.01). This medial shift was not due to a reduction of brain size in the mutants because the WT and TKOs had similarly sized brains at the age of imaging (Figure S3). Furthermore, the V1 positional shift was only observed in the ephrin-A2/A3/A5 TKOs and not in any of the ephrin-A double mutants (Figure 5D; ephrin-A2/A5 double mutant: 3.2 ± 0.07 mm [n = 6]; ephrin-A2/ A3: 3.2 ± 0.13 mm [n = 2]; ephrin-A3/A5: 3.3 ± 0.1 mm [n = 2]; p > 0.05 for all comparisons with WT), suggesting a great redundancy of the three ephrin-As in controlling cortical patterning. Finally, the positional shift was seen in the medial-lateral axis, but not along the anterior-posterior axis of the cortex (measured as the distance to the lambda suture, p > 0.05 for all comparisons with WT) (Figure 5E). This medial shift defect is consistent with the idea that the high ephrin-A expression lateral and medial to V1 acts to guide its location within the posterior cortex.
Figure 5. Ephrin-A TKOs Have Medial-Lateral Positioning Defects in Primary Visual Cortex.
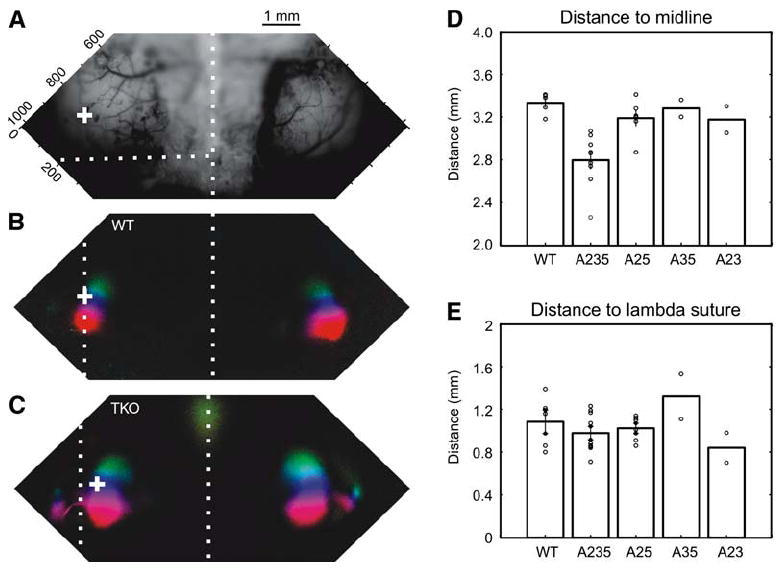
(A) Surface vasculature pattern of the imaged cortical area of a WT mouse. The midline and lambda sutures are indicated by the vertical and horizontal white dotted lines, respectively. (B) Elevation map of V1 from a WT mouse, shown as a polar map in which color encodes visual field position according to the scale in Figure 2, and brightness represents the magnitude of the response. “+” marks the position of 0° elevation at the V1/V2 border.
(C) Elevation map of an ephrin-A TKO. (D) The distances from V1/V2 border to the midline are plotted for the five genotypes: WT, TKO (A235), and the three types of double KOs, ephrin-A2/A5 (A25), ephrin-A3/5 (A35), and ephrin-A2/A3 (A23). Only the triple KO is significantly different from the WT (p < 0.01). (E) The visual cortex position of the five genotypes is similar along the anterior-posterior axis of the cortex, measured as the distance to the back of the brain (p > 0.05 for all comparisons). Error bars represent the mean ± SEM.
Effect of Ephrin-A5 Misexpression in the Developing Visual Cortex
The expression patterns in the dLGN and visual cortex suggest that gradients of ephrin-As expressed in the caudal cortex play a role in targeting visual TC projections that express complementary gradients of EphAs. We therefore reasoned that disturbing the normal ephrin-A expression pattern could lead to aberrant TC projections and, hence, abnormal visual cortical organization. To disturb ephrin-A patterns in the developing cortex, we ectopically expressed ephrin-A in limited areas of one cerebral hemisphere by electroporating cDNA in utero. A mixture of ephrin-A5 and GFP expression plasmids was injected into the lateral ventricle of the left hemisphere at E13.5–E14.5, when neurons that are destined to reside in layer 2/3 and 4 of the neocortex are born (Hashimoto and Mikoshiba, 2004). In pilot experiments, we compared the expression patterns of GFP and ephrin-A5 in whole-mount brains at P1–P5 by detecting the binding activity of the ephrin-A indicator EphA3-AP. In general, the GFP-positive area overlapped with patches of ectopic EphA3-AP binding sites, while the GFP-negative area showed no ectopic labeling with EphA3-AP (data not shown). Although the GFP signal declined during development, its expression persisted in adult cortices (present observation; Tabata and Nakajima, 2001). Therefore, we used the GFP expression pattern in adults as an indicator of the location of ectopically expressed ephrin-A5 earlier in development. In mice that had had ephrin-A5 ectopically expressed in the left hemisphere in utero, functional visual cortical maps were examined using intrinsic signal imaging at P60–P90 followed by post hoc determination of electroporation regions. Control animals in which electroporation was carried out with GFP alone were entirely normal regardless of where the GFP was expressed (Figure 7B). Of 36 animals (eight litters) analyzed following electroporation of ephrin-A5/GFP, 13 showed strong GFP signals in the left caudal cortex (misexpression-positive, ME+, Figure 6D), whereas GFP expression was either undetectable or very weak in 23 animals (misexpression-negative, ME−). In 10 of the 13 ME+ animals, the GFP signal was present in the area just lateral to the visual cortex, but was absent within the visual cortex itself. In these ten animals, V1 of the electroporated left hemisphere was positioned more medially than it was in the control V1 of the right hemisphere (Figures 6A–6C). The distance between the V1/V2 border and midline was significantly shorter in the left (2.72 ± 0.16 mm) than in the right (3.24 ± 0.10 mm) hemisphere (p < 0.01, one-way ANOVA followed by Newman-Keuls test). No difference was detected in visual area position between hemispheres in ME− animals (left: 3.19 ± 0.10 mm and right: 3.21 ± 0.14 mm, p > 0.05). The size of ME+ hemispheres did not significantly differ from that of ME− hemispheres, indicating that the medial shift was not caused by a reduction in size of the electroporated hemispheres. In contrast to the altered V1 position, map quality in the ME+ animals did not differ from that in ME− animals; mean scatter indexes were 0.73 ± 0.18° for elevation maps and 1.33 ± 0.30° for azimuth maps in ME− animals (n = 10) and 0.60 ± 0.27° for elevation maps and 1.18 ± 0.31° for azimuth maps in ME+ animals (n = 7). Cortical magnification factors in ME+ animals (29.3 ± 5.2°/mm for elevation and 75.8 ± 5.7°/mm for azimuth [n = 10]) were also comparable to those in ME− animals (32.1 ± 2.8°/mm for elevation and 68.7 ± 6.2°/mm for azimuth [n = 7]).
Figure 7. Misexpression of Ephrin-A5 within V1 Disrupts Functional Retinotopy.
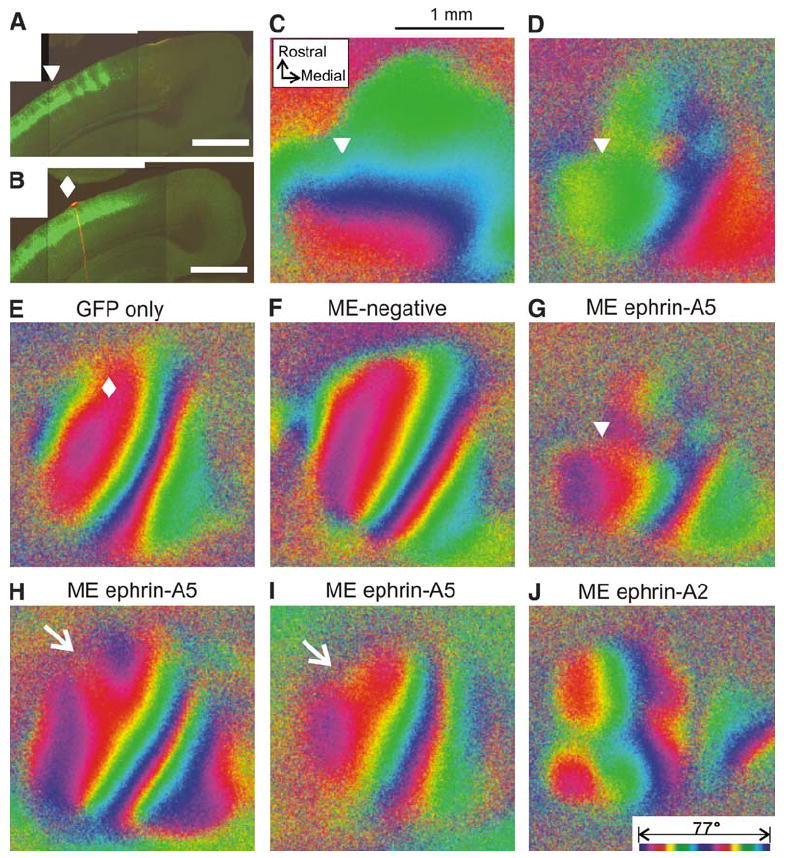
(A and B) Coronal sections of the left caudal cortex from animals that received electroporation of ephrin-A5 and GFP (A) and GFP only (B). The arrowhead in (A) and the diamond in (B) indicate the position of the DiI marker corresponding to their positions in (C), (D), and (G) and in (E), respectively. GFP expression extends medially to the DiI marker indicating that the expression is present within as well as lateral to V1. (C and D) Functional elevation (C) and azimuth (D) maps in the left cortex from the animal shown in (A). The color codes representing positions on the stimulus monitor are the same as those in Figure 2. (E–J) Azimuth maps in control (E and F) and experimental animals (G–J). In (E)–(J), the visual field is represented by two cycles of colors (bottom of [J]) instead of a single cycle as shown in (B), to reveal the retinotopic structure at higher resolution. The control animal in (E) received electroporation of GFP plasmid alone, the expression of which is shown in (B). The diamond indicates the DiI injection site. The other control animal (F) had received GFP and ephrin-A5 plasmids by electroporation, but did not show clear expression. (G) The same map as in (D), except using the double color scale. (H and I) Additional examples of disrupted azimuth maps in animals that showed ephrin-A5 misexpression within V1. Note that in both of these maps, the lateral red isoazimuth contour bifurcates rostrally (arrows) in the area where ectopic ephrin-A5 expression was detected. (J) An example of a disrupted azimuth map in an animal in which ephrin-A2 was misexpressed within V1. All scale bars, 1.0 mm.
Figure 6. Lateral Misexpression of Ephrin-A5 Shifts V1 Medially.
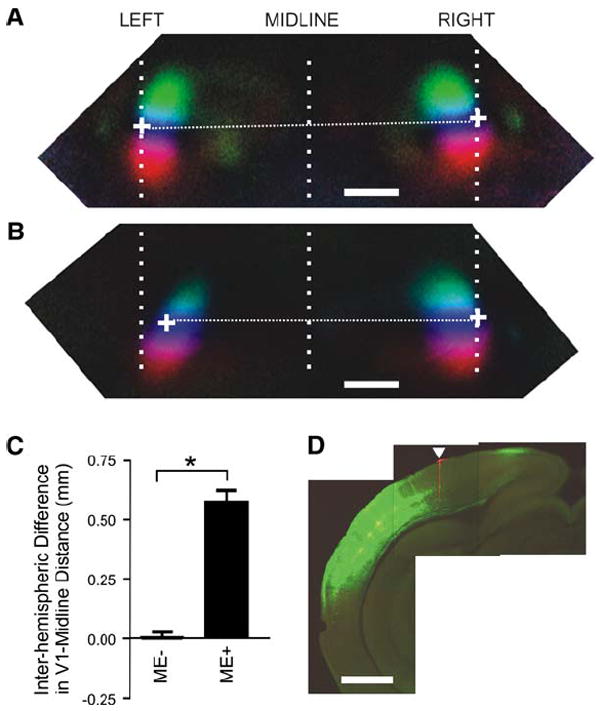
(A–D) Misexpression of ephrin-A5 in caudal cortex just lateral to V1 caused V1 to shift medially. Medium-resolution retinotopic maps in a ME− animal (A) and a ME+ animal (B). Visually evoked responses in both hemispheres were simultaneously imaged, and the position of V1 was analyzed using the same method as that described in Figure 5. White crosses indicate the position of the V1/V2 border at 0° elevation. RIGHT, right hemisphere; LEFT, left hemisphere; MIDLINE, the line corresponding to the sagittal suture. (C) Differences in the V1/V2 border-midline distance between left and right hemispheres of ME− (n = 23) and ME+ animals (n = 10), *p < 0.001. (D) A coronal section of the left hemisphere from the animal shown in (B), showing an intense GFP signal in the dorsolateral cerebral wall. The section is at approximately mid-V1 level in its rostrocaudal extent. The arrowhead indicates the position of the DiI mark at the lateral margin of V1. All scale bars, 1.0 mm. Error bars represent the mean ± SEM.
In the remainder of these ME+ animals (n = 3), ephrin-A5/GFP expression was detected within V1 in addition to the lateral area (Figure 7A). In these animals, we found that the functional retinotopy was dramatically disrupted. Although the gross polarity of the retinotopic map was preserved, progression of the visual space position was abnormal, with more severe irregularity along the nasotemporal axis than in the dorsoventral axis. To demonstrate abnormal retinotopy in detail, azimuth maps in control and in experimental animals are shown in a color code that represents the azimuth lines on the stimulus monitor with two cycles of colors (Figures 7E–7J). Disruption of retinotopic structure was more prominent in the area that showed higher levels of misexpression: the rostral part of V1 in Figure 7G and the rostral-lateral part of V1 in Figures 7H and 7I. In contrast, such disruption of retinotopy was never observed in control animals in which only GFP plasmid was electroporated (Figures 7B and 7E) or in which expression was undetectable after ephrin-A5+GFP electroporation (Figure 7F). We also observed disruption of V1 retinotopy in an animal in which ephrin-A2 was misexpressed within V1 (Figure 7J). Although the exact mechanisms and sites of action of misexpressed ephrin-A are yet to be investigated, these results demonstrate that the endogenous pattern of ephrin-A5 in the caudal cortex is critical for the normal patterning of V1. In addition, they provide evidence of a cortical locus for the site of the two main defects seen in the ephrin-A TKOs: defects in both the position of V1 and in the order of the retinotopic map within V1.
Discussion
During development, two levels of specificity are achieved for thalamocortical (TC) targeting. First, the TC axons have to reach the correct location of a cortical area on the cortical plate. Second, within each cortical area, TC axons must organize into an orderly map. In the present study, we have demonstrated that EphA/ephrin-A signaling in the cortex is required in both processes of visual TC targeting by disrupting one, the other, or both in different experiments. In mice deficient for ephrin-A2, -A3, and -A5 (ephrin-A TKOs), the functional visual cortical maps are shifted medially, rotated, and compressed along the medial-lateral axis of the cortex. The orderly internal organization of these maps is also severely disrupted, as shown by a combination of intrinsic optical imaging, multiunit recording, and anatomical tracing methods. Positioning defects and different changes in internal topography are also seen in mice in which ephrin-As have been ectopically expressed in the developing cortex, indicating a causal role of cortical EphA/ephrin-A signaling in patterning TC axons. With ectopic expression in lateral cortex, positioning is altered, but internal topography is normal. With ectopic expression within V1, position is normal, but internal topography is disrupted.
Control of the Visual Cortex Position by Ephrin-A2, -A3, and -A5
Recent studies have revealed that cortical arealization is regulated by intrinsic factors including locally secreted signaling molecules such as FGF8 (Fukuchi-Shimogori and Grove, 2001, 2003; Garel et al., 2003) and several transcription factors such as Emx2, Pax6, and COUP-TF1 that show restricted or graded expression across the cortex (Bishop et al., 2000, 2002; Hamasaki et al., 2004; Zhou et al., 2001). It is hypothesized that the activities of these factors pattern the cortex and induce expression of guidance molecules used for area-specific TC axon targeting. However, the molecular mechanisms and identities of molecules downstream of these intrinsic factors are largely unknown (Grove and Fukuchi-Shimogori, 2003). Here, we show that ephrin-As expressed in the cortex participate in the positioning of the visual cortex, providing compelling evidence that ephrin-As are one class of the effector molecules downstream from the transcription factors controlling arealization. This idea is consistent with the observations that altering the expression patterns of FGF8, Emx2, or Pax6 shift the expression domain of ephrin-A5 in the cortex (Bishop et al., 2002; Fukuchi-Shimogori and Grove, 2001; Shimogori and Grove, 2005).
The temporal and spatial expression patterns of ephrin-A2, -A3, and -A5 are consistent with their roles in area-specific targeting of visual TC axons during development. TC axons in the rat arrive at the lower layers of the occipital cortex between E16 and E20 (Molnar et al., 1998). Visual TC axons are believed to invade upward to arrive at layer 4 perinatally, similar to somatosensory TC axons (Agmon et al., 1995, 1993). Ephrin-A ligands are expressed both embryonically and perinatally in multiple areas of the brain that are implicated in the mapping of visual TC axons. These areas include the dLGN (Feldheim et al., 1998; Pfeiffenberger et al., 2005), the ventral telencephalon (Dufour et al., 2003), and the posterior cortex (Donoghue and Rakic, 1999a, 1999b; Mackarehtschian et al., 1999; Sestan et al., 2001; Yun et al., 2003). Thus, altered TC axon targeting that we observed in ephrin-A TKOs could result from the lack of ephrin-As at the cortical or subcortical level. To address this question, we examined the effects of misexpressing ephrin-A5 only in the cortex. We found that expression of ephrin-A5 in the posterior-lateral cortex shifted V1 medially, indicating that the cortex is a site of EphA/ephrin-A function in visual area positioning along the medial-lateral axis.
Recent results by Vanderhaeghen and colleagues indicate that ephrin-As expressed in a gradient within the ventral telencephalon act as an intermediate target for TC axons to guide TC axons to their proper anterior-posterior position in the cortex based on their EphA receptor expression (Dufour et al., 2003). For example, in the EphA4/ephrin-A5 double knockout mice, the somatosensory cortex receives aberrant projections from the motor thalamic nucleus (Dufour et al., 2003). Interestingly, although these mice have defects in patterning motor and somatosensory cortex, there is no defect in the patterning of V1 (P. Vanderhaeghen, personal communication), suggesting an important difference in the mechanism of regionalization of anterior (somatosensory/motor) and posterior (visual) cortex.
How might one explain the V1 position shift in ephrin-A TKOs? In wild-type cortex, ephrin-As are expressed in high levels laterally and medially to Cad8, a homophilic adhesion molecule used as a marker for visual cortex (Figure 1 and Figure S1). We propose that high levels of ephrin-A-repellent activity adjacent to VC acts as an “electric fence” for dLGN axons and thus is partly responsible for the characteristic shape and location of the VC. This is similar to the role proposed for the high ephrin-A5 levels in the inferior colliculus—preventing RGC axons from leaving the SC (Frisén et al., 1998, and Figure 8A). One model that could explain the medial shift of V1 in ephrin-A TKOs uses a combination of attractive forces provided by Cad8 homophilic adhesion, creating a permissive zone for geniculate input, with the repulsive interactions of ephrin-A ligands. This model predicts that, in the absence of ephrin-A expression, dLGN axons would not be repelled from the medial region of high Cad8 expression, thus shifting V1 medially (Figure 8B). Alternatively, dLGN axons could be attracted to a midline-derived cue (Grove and Fukuchi-Shimogori, 2003) that is normally balanced by repulsion from the ephrin-A that is also expressed in this region. Ectopic expression of ephrin-As lateral to the visual cortex also shifted the position of the map similarly, presumably because of increased repulsion from the lateral side in combination with existing EphA/ephrin-A gradients within V1 (Figure 8C).
Figure 8. EphA/ephrin-A Interactions Are Required for the Position and Internal Order of the Primary Visual Cortex.
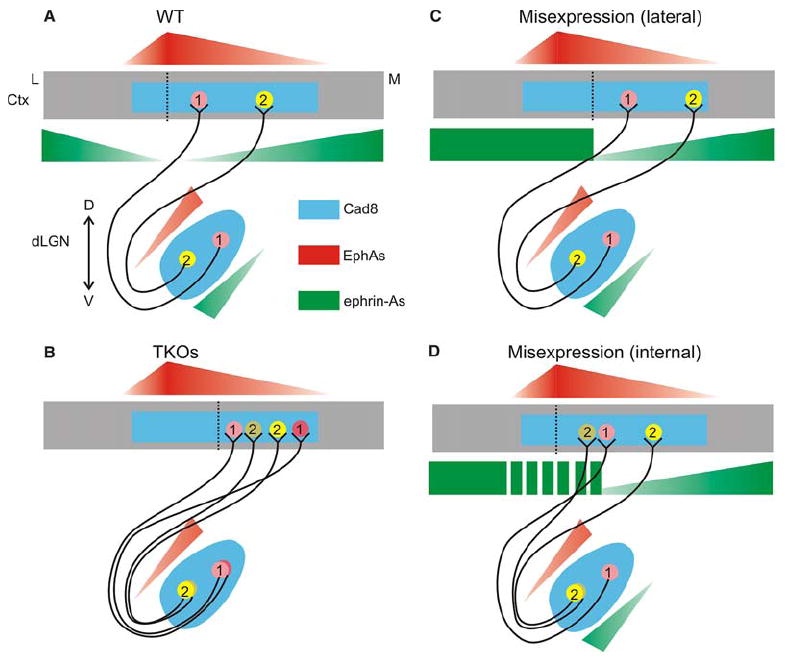
(A) Expression of EphA receptors and ephrin-A ligands in the developing geniculocortical projection. Cadherin-8 (Cad8) (and perhaps other cadherin family members, blue) is expressed in both dLGN and visual cortex and marks available territory for LGN neurons. Neurons in the dorsal-medial dLGN (pink circle 1) that contain high amounts of EphA receptor (red) and low amounts of ephrin-A ligand (green) project to lateral V1, while ventral-lateral dLGN neurons containing high ephrin-A and low EphA (yellow circle 2) map to medial V1. These gradients are proposed to instruct the internal order of V1 via their graded repellent activities toward one another. High expression of ephrin-As both lateral and medial to visual cortex is proposed to act as a barrier for dLGN axons and place visual cortex in its stereotypic location. These gradients may also be used to map the topographic projection from V1 to V2 in a similar manner. (B) In ephrin-A TKO mice, ephrin-As are removed from the dLGN and cortex. This affects both the position of V1 and the internal order of the topographic map. V1 shifts medially in the absence of repulsion from high ephrin-A expression within the Cad8 permissive zone. (C and D) Misexpression of ephrin-As lateral to visual cortex repels V1 medially, but maintains internal order, while expression of patches of ephrin-A within V1 disrupts the V1 map. Ctx, cortex; D, dorsal; V, ventral; M, medial; L, lateral. Dotted lines indicate the V1/V2 boundary.
Notably, the V1 position shift was observed in ephrin-A TKOs, but not in any of the three ephrin-A double mutant mice. There are eight EphA receptors and five ephrin-A ligands annotated in the mouse genome. Among members of the EphA and ephrin-A families, expression patterns, binding activities, and functional properties are overlapping, which often results in functional redundancy in neural development. For example, ephrin-A2 and -A5 are expressed in overlapping rostral-caudal gradients in the SC and act as topographically specific repellent molecules in vitro. Gene disruption of either ephrin-A2 or ephrin-A5 results in moderate mapping errors, while the phenotype is much more severe in ephrin-A2/A5 double mutant mice (Feldheim et al., 2000, 1998). Likewise, in the projection from the ventral-postero-medial nucleus to the primary somatosensory cortex, EphA4/ephrin-A5 double mutant mice have stronger defects in topography than either single mutant (Dufour et al., 2003). In our experiments, the genetic redundancy of ephrin-As is even more prominent. Deletion of all three—ephrin-A2, -A3, and -A5—was required to produce a significant phenotype, indicating that any one of these ephrin-As can compensate for the loss of the other two to restore the normal patterning of the visual TC axons.
Although its position is shifted medially, V1 in ephrin-A TKOs is still localized to the posterior cortex and maintains its general shape. Because we deleted all of the ephrin-As that display significant cortical expression, other ephrin-As are not candidates for this role. This suggests that mechanisms other than EphA/ephrin-A signaling must also play an important role in visual cortical patterning.
Ephrin-As Are Required for the Functional Topographic Mapping of Visual Thalamocortical Projections
The visual system has been a long-standing model in the study of topographic map development. EphA receptors and ephrin-A ligands have been shown to be necessary for the development of topographic maps from the retina to two of its subcortical targets, the superior colliculus (SC) in the midbrain and dorsal lateral geniculate nucleus (dLGN) in the thalamus (Feldheim et al., 2000, 2004, 1998; Frisén et al., 1998). The dLGN then projects to the visual cortex. In this study, we have found that the topographic mapping of geniculocortical projections is disrupted both structurally and functionally in an ephrin-A TKO. The expression patterns of EphA receptors and ephrin-A ligands in the geniculocortical projection are consistent with EphA/ephrin-A interactions acting in TC projections in the same manner as that proposed for EphA/ephrin-A interactions in subcortical mapping (Brown et al., 2000; Feldheim et al., 2000; Hansen et al., 2004; O’Leary and McLaughlin, 2005; Rashid et al., 2005). In the cases in which we successfully misexpressed ephrin-A ligand within the developing visual cortex, the functional topographic maps were defective, consistent with ephrin-A ligands acting as molecular labels in the cortex (Figure 8D). Together, these experiments suggest that the same mapping mechanisms are used at subcortical and cortical stages, acting in each projection and target area to maintain the topographic order of visual information as it is transferred to the next stage.
In our analysis of visual maps of ephrin-A TKOs, we were surprised to see that the topographic map obtained by functional imaging appeared more nearly normal than one would expect based on the topography seen from anatomical tracing. One interpretation of this result is that our method of functional imaging is not sensitive enough to detect functional defects of retinotopic maps. We employed Fourier analysis to calculate the phase of cortical optical signals in relation to the visual stimulus (Kalatsky and Stryker, 2003), which essentially looks at the timing of the maximum response of the population of V1 neurons at each point on the cortex. Consequently, the optical map may still appear normal even if the TC projections from the dLGN are aberrantly widespread so long as they are on average in the normal position. We addressed this concern by performing multiunit recordings from V1 neurons in ephrin-A TKOs. While 20% of the recording sites had multiple foci of response to different positions in the visual field, as expected from anatomical tracing studies, we found that 80% of sites had relatively normal visual field responses. It is thus possible that dLGN axons from topographically incorrect regions (or synapses in topographically incorrect places) are not as efficient at driving postsynaptic neurons to fire action potentials. In other words, these aberrant axons may not retain strong functional synapses with cortical neurons. This could result from a Hebbian process of synapse strengthening or weakening as proposed in activity-dependent mapping models. Such a refinement process could be driven by patterned retinal activity, either evoked or spontaneous (Wong, 1999).
Functional Imaging in the Study of Cortical Development
In the present study, we used a combination of functional and anatomical techniques to analyze the position and topography of the primary visual cortex in both knockout and manipulated mice. The power of our imaging method for studying cortical patterning is clearly demonstrated in these experiments. This method of intrinsic signal imaging using Fourier analysis (Kalatsky and Stryker, 2003) allows for rapid, noninvasive delineation of detailed retinotopic maps of visual areas in the visual cortex from mice older than three weeks of age. Combined with mouse genetics, this imaging method is a useful technique to study the factors responsible for controlling cortical development. In the present study, the defect of visual cortex positioning and changes of internal topography were readily detected in ephrin-A TKOs. Intrinsic signal imaging is also easily combined with conventional methods of anatomical tracing and physiological recordings to permit targeted and reproducible labeling and recording, as evident in the experiments of the present study.
Conclusions
These experiments demonstrate that EphA/ephrin-A interactions in the developing cortex affect both the position and internal organization of V1, a cortical visual area. These results demonstrate that, in addition to their roles in rostral-caudal patterning, EphA/ephrin-A interactions participate in thalamocortical targeting along the medial-lateral axis of the cortical plate. As the same mapping mechanisms are used in both subcortical and thalamocortical mapping in the visual system, it would be intriguing to test the roles of EphA/ephrin-A in mapping projections from the primary visual area to higher visual areas.
Experimental Procedures
Animals
Ephrin-A2/A3/A5 triply mutant mice (Pfeiffenberger et al., 2005) were generated from crossing of each single mutant (Cutforth et al., 2003; Feldheim et al., 2000; Frisén et al., 1998). Triple mutants can be viable and fertile, although a significant percentage (20%–30%) dies as embryos. The animals were maintained in the animal facilities at the University of California Santa Cruz (UCSC) or the University of California San Francisco (UCSF) and used in accordance with protocols approved by the UCSC and UCSF Institutional Animal Care and Use Committee.
In Situ RNA Hybridization
Complementary DNAs for ephrin-A5 (containing nucleotides 102–682 of the open reading frame (ORF), ephrin-A2 (containing nucleotides 112–636 of the ORF), ephrin-A3 (containing nucleotides 100–687 of the ORF), EphA7 (containing nucleotides 721–1193 of the ORF), EphA4 containing nucleotides 402–786 of the ORF), and Cad8 (containing nucleotides 241–1481 of the ORF) were used to make antisense and sense digoxigenin-labeled RNA probes. Frozen section and whole-mount in situ hybridization was done as previously described (Feldheim et al., 1998); proteinase K treatments were 1 μg/ml for 1 min for the sections and 10 μg/ml for 1 hr for the P4 whole mounts. Stained sections and whole brains were photographed using a Coolpix digital camera (Nikon) mounted onto a dissecting microscope.
Affinity Probe In Situ
EphA3-AP and ephrin-A5-AP in situ was done as described (Feldheim et al., 1998). For EphA3-AP, brains were dissected from neonatal pups and rapidly embedded in 5% agarose in PBS. 250 μm coronal sections were cut using a vibratome, and those containing visual cortex were treated with EphA3-AP as floating sections. For ephrin-A5-AP staining, brains were dissected from neonatal pups, mounted in freezing medium, and cut as 25 μm frozen sections onto superfrost slides. Sections were fixed in 30% methanol for 30 s and treated with probe as above. Stained sections were photographed using a Coolpix digital camera (Nikon) mounted onto a dissecting microscope.
Functional Imaging and Analysis of Retinotopic Maps
To image maps of retinotopy in the mouse visual cortex, we followed the method developed by Kalatsky and Stryker (2003). The detailed description of surgical and imaging procedures can be found in the Supplemental Experimental Procedures. In brief, adult mice were anesthetized with urethane (1.0 g/kg in 10% saline solution). Optical images of cortical intrinsic signal were obtained at the wavelength of 610 nm, using a Dalsa 1M30 CCD camera (Dalsa, Waterloo, Canada) controlled by custom software. A high refresh rate monitor (Nokia Multigraph 445×, 1024 × 768 pixels at 120 Hz) was placed 25 cm away from the animal. Drifting thin bars (2° width and full-screen length) were generated by a Matrox G450 board (Matrox Graphics, Inc., Quebec, Canada) and displayed on the monitor. Animals were presented with thin bars drifting in the axis of dorsal-ventral or nasal-temporal in order to stimulate the constant lines of elevation or azimuth, respectively. By extracting the optical signal at the stimulus frequency, we computed the response magnitudes and timing in reference to the stimulus cycle, which can then be converted to the location of visual field. The absolute phase maps were then calculated by the method of “phase reversal” (Kalatsky and Stryker, 2003). A 0° phase indicates the midline of the monitor, both horizontally and vertically.
To assess map quality, we analyzed the phase scatter of the retinotopic maps. Specifically, we used the elevation map to select the response area, because the azimuth maps of the mutant mice were weak and more defective. The 20,000 pixels (1.60 mm2 of cortical space) that had the greatest response magnitude in the elevation maps were selected. For each of these pixels, we calculated the difference between its phase value and the mean phase value of its surrounding 25 pixels. For maps of high quality, the phase differences are quite small due to smooth phase progression. The standard deviation of the phase difference was then used as an index of map quality.
To determine the magnification factor of elevation maps, we drew a straight line across the map in the middle of V1. Special care was taken to have the line approximately follow the steepest phase progression along the map. We then calculated the cortical distance between the two points along the line that have an elevation phase of −20° and 20°, respectively. The magnification factor, in deg/mm, is then the ratio of phase difference (40° in this case) and cortical distance. The magnification factor of the azimuth map is similarly calculated with the following modifications. First, the line was 0° isoelevation contour from the elevation map in the same animal in order to reduce subjectivity. Second, the ratio was calculated between the points of −30° and 30°, because the stimulus monitor’s width is greater than its height.
To measure the position of the left visual cortex, we first calculated the 0° isoelevation line from the elevation maps and then determined the V1/V2 border along the contour line by finding the point at which the phase from the corresponding azimuth is minimal—used as the reference point marking the position of primary visual area—and we then measured its distance from the midline suture and the lambda suture. Finally, the orientation of V1 was determined by calculating the angle between 0° isoelevation line and the lambda suture.
Multiunit Recording of Cortical Neurons and Analysis of Receptive Fields
Guided by the optical maps, we recorded multiunit spikes from V1 with tungsten microelectrodes (10 MΩ Frederick Haer Company, Bowdoinham, ME). For each animal, three to six penetrations were made perpendicular to the pial surface across V1, and three to seven sites (>50 μm apart) were recorded in each penetration. The spikes were acquired using a System 3 workstation (Tucker Davis Technologies, FL) and analyzed using Matlab (The Mathworks, MA). Single drifting bars 5° wide and 80° long at the speed of 25°/sec were used to drive cortical cells. In each trial, the drifting bar was presented in four directions—rightward, leftward, upward, and downward—in a random sequence. Twenty to thirty of such trials were repeated to construct a peristimulus time histogram (PSTH) for each stimulus direction, using 5 ms bins. The PSTH was subsequently smoothed using a 10 ms window. The mean rate (Rb) and standard deviation (Stdb) of the background firing activity were calculated from the period of PSTH when no stimulus was presented. A thresh-old was calculated as Rb + 3 * Stdb, and the interval between the first and last bins in the PSTH above the threshold was converted to the extent of the visual space that elicited responses for individual recording sites.
Retrograde Labeling of Thalamocortical Projections and Image Analysis
Cholera toxin subunit B (CTB) conjugated to Alexa Fluor (Molecular Probes, OR), CTB-488 (green), and CTB-594 (red) was injected into the cortex guided by the retinotopic maps in order to retrogradely label dLGN neurons. A small amount of 2 mg/ml solution of each CTB in PBS was injected by Nanoject (Drummond Scientific Company, PA) using a glass pipette with a 20–30 μm tip opening. The Nanoject was set to inject 32.2 nl of the dye, but small variations of injection volume were unavoidable. Mice were sacrificed and intracardially perfused with 4% paraformaldehyde in PBS 48 hr later. The brains were fixed overnight before they were sectioned at 100 mm coronally using a vibratome (Lancer, MO). Images of the dLGN and injection sites in the cortex were captured with a confocal microscope (Biorad MRC 1024, CA).
To analyze the patterns of retrogradely labeled cells in the dLGN, we first calculated the background signal as the mean signal of an area within the dLGN where no labeled cells were seen. The image was then thresholded separately for each color at the level of 1.5 times the background. (A wide range of threshold from 1.2 to 1.8 was tested and similar results were obtained.) We then calculated the position of the center of mass for all of the labeled pixels within the dLGN. The percentage of labeled pixels within the dLGN as a function of the distance from the center was then computed. The above procedure was repeated for all of the sections of the dLGN excluding those sections at the rostral and caudal ends (six to seven 100 μm sections per animal), and the resulting curves were averaged. To quantify the differences between WT and TKOs, we used the distance within which 80% of the labeled pixels were found to represent the degree of the dispersion. Finally, we calculated the mean area occupied by labeled pixels in all sections of each animal.
Ectopic Expression by In Utero Electroporation
Complementary DNA encoding mouse ephrin-A5 (Feldheim et al., 1998) and EGFP (BD Biosciences-Clontech, Mountain View, CA) were inserted into the expression vector pEF1/Myc-His C (Invitrogen) that allows expression driven from the human elongation factor 1α promoter enhancer. In utero electroporation was performed as previously described (Saito and Nakatsuji, 2001) with modifications. Timed pregnant WT C57/BL6 mice at E13.5–E14.5 were anesthetized with intraperitoneal injection of ketamine (80 mg/kg) and xylazine (5 mg/kg) supplemented with inhalation of isoflurane 1%–1.5% in oxygen. After laparotomy, embryos were visualized through the uterus with a fiber optic light source. A mixture of ephrin-A5 plasmid (1.0 mg/ml), EGFP plasmid (0.5 mg/ml), and 0.1% Fast Green was injected into the left lateral ventricle of each embryo through a glass capillary (Drummond Scientific, Broomall, PA). The head of the embryo was placed between a pair of rectangular (3 × 5 mm) paddle-style electrodes, and a series of five square-wave current pulses (40–50 V, 50 ms duration, at an interval of 950 ms) was delivered by a pulse generator (ECM830; BTX, San Diego, CA). The electrodes were positioned to aim for gene transfection in the dorsolateral wall of the left hemisphere. The surgical incision in the mother was closed, and embryos were allowed to develop in utero followed by natural (vaginal) delivery, after which pups were allowed to grow into adulthood.
At P60–P90, functional maps in the visual cortex were obtained, using intrinsic signal imaging as described above. The V1 position was determined on images acquired simultaneously from both hemispheres. Retinotopic maps of the left visual cortex were examined further in detail by acquiring high-resolution maps. After functional mapping, the visual cortex was marked with DiI at several points using a tungsten microelectrode, and the animal was immediately perfused with 4% formaldehyde in 0.1 M phosphate buffer. The brain was dissected out, postfixed in 4% paraformaldehyde overnight at 4°C, and cut coronally using a vibratome. EGFP expression and DiI markings were examined using a confocal microscope (MRC1024; Bio-Rad, CA).
Data Analysis
The statistical test used was the Student’s t test, and results were expressed as the mean ± SEM, unless otherwise indicated.
Supplementary Material
Supplemental Data include three figures and Supplemental Experimental Procedures and are available with this article online at http://www.neuron.org/cgi/content/full/48/4/577/DC1/.
Acknowledgments
The work was supported by U.S. National Institutes of Health (N.I.H.) grants EY014689 (D.A.F.) and EY02874 (M.P.S.). J.C. is an Aventis Pharmaceuticals Fellow of the Life Sciences Research Foundation. We thank Ann Schreiber, for help with brain sectioning; Hema Vaidyanathan, Cory Pfeiffenberger, Ben Stafford, and Pierre Vanderhaeghen, for critical reading of the manuscript; and Andrew Huberman and members of the Feldheim and Stryker labs, for thoughtful discussion.
References
- Agmon A, Yang LT, O’Dowd DK, Jones EG. Organized growth of thalamocortical axons from the deep tier of terminations into layer IV of developing mouse barrel cortex. J Neurosci. 1993;13:5365–5382. doi: 10.1523/JNEUROSCI.13-12-05365.1993. [DOI] [PMC free article] [PubMed] [Google Scholar]
- Agmon A, Yang LT, Jones EG, O’Dowd DK. Topological precision in the thalamic projection to neonatal mouse barrel cortex. J Neurosci. 1995;15:549–561. doi: 10.1523/JNEUROSCI.15-01-00549.1995. [DOI] [PMC free article] [PubMed] [Google Scholar]
- Bishop KM, Goudreau G, O’Leary DD. Regulation of area identity in the mammalian neocortex by Emx2 and Pax6. Science. 2000;288:344–349. doi: 10.1126/science.288.5464.344. [DOI] [PubMed] [Google Scholar]
- Bishop KM, Rubenstein JL, O’Leary DD. Distinct actions of Emx1, Emx2, and Pax6 in regulating the specification of areas in the developing neocortex. J Neurosci. 2002;22:7627–7638. doi: 10.1523/JNEUROSCI.22-17-07627.2002. [DOI] [PMC free article] [PubMed] [Google Scholar]
- Bolz J, Uziel D, Muhlfriedel S, Gullmar A, Peuckert C, Zarbalis K, Wurst W, Torii M, Levitt P. Multiple roles of ephrins during the formation of thalamocortical projections: maps and more. J Neurobiol. 2004;59:82–94. doi: 10.1002/neu.10346. [DOI] [PubMed] [Google Scholar]
- Brown A, Yates PA, Burrola P, Ortuno D, Vaidya A, Jessell TM, Pfaff SL, O’Leary DDM, Lemke G. Topographic mapping from the retina to the midbrain is controlled by relative but not absolute levels of EphA receptor signaling. Cell. 2000;102:77–88. doi: 10.1016/s0092-8674(00)00012-x. [DOI] [PubMed] [Google Scholar]
- Cutforth T, Moring L, Mendelsohn M, Nemes A, Shah NM, Kim MM, Frisen J, Axel R. Axonal ephrin-As and odorant receptors: coordinate determination of the olfactory sensory map. Cell. 2003;114:311–322. doi: 10.1016/s0092-8674(03)00568-3. [DOI] [PubMed] [Google Scholar]
- Donoghue MJ, Rakic P. Molecular evidence for the early specification of presumptive functional domains in the embryonic primate cerebral cortex. J Neurosci. 1999a;19:5967–5979. doi: 10.1523/JNEUROSCI.19-14-05967.1999. [DOI] [PMC free article] [PubMed] [Google Scholar]
- Donoghue MJ, Rakic P. Molecular gradients and compartments in the embryonic primate cerebral cortex. Cereb Cortex. 1999b;9:586–600. doi: 10.1093/cercor/9.6.586. [DOI] [PubMed] [Google Scholar]
- Dufour A, Seibt J, Passante L, Depaepe V, Ciossek T, Frisen J, Kullander K, Flanagan JG, Polleux F, Vanderhaeghen P. Area specificity and topography of thalamocortical projections are controlled by ephrin/Eph genes. Neuron. 2003;39:453–465. doi: 10.1016/s0896-6273(03)00440-9. [DOI] [PubMed] [Google Scholar]
- Feldheim DA, Vanderhaeghen P, Hansen MJ, Frisen J, Lu Q, Barbacid M, Flanagan JG. Topographic guidance labels in a sensory projection to the forebrain. Neuron. 1998;21:1303–1313. doi: 10.1016/s0896-6273(00)80650-9. [DOI] [PubMed] [Google Scholar]
- Feldheim DA, Kim YI, Bergemann AD, Frisen J, Barbacid M, Flanagan JG. Genetic analysis of ephrin-A2 and ephrin-A5 shows their requirement in multiple aspects of retinocollicular mapping. Neuron. 2000;25:563–574. doi: 10.1016/s0896-6273(00)81060-0. [DOI] [PubMed] [Google Scholar]
- Feldheim DA, Nakamoto M, Osterfield M, Gale NW, DeChiara TM, Rohatgi R, Yancopoulos GD, Flanagan JG. Loss-of-function analysis of EphA receptors in retinotectal mapping. J Neurosci. 2004;24:2542–2550. doi: 10.1523/JNEUROSCI.0239-03.2004. [DOI] [PMC free article] [PubMed] [Google Scholar]
- Flanagan JG, Vanderhaeghen P. The ephrins and Eph receptors in neural development. Annu Rev Neurosci. 1998;21:309–345. doi: 10.1146/annurev.neuro.21.1.309. [DOI] [PubMed] [Google Scholar]
- Flanagan JG, Cheng HJ, Feldheim DA, Lu Q, Hattori M, Vanderhaeghen P. Alkaline phosphatase fusions of ligands or receptors as in situ probes for staining of cells, tissues, and embryos. Methods Enzymol. 2000;327:19–35. doi: 10.1016/s0076-6879(00)27264-9. [DOI] [PubMed] [Google Scholar]
- Frisén J, Yates PA, McLaughlin T, Friedman GC, O’Leary DDM, Barbacid M. Ephrin-A5 (AL-1/RAGS) is essential for proper retinal axon guidance and topographic mapping in the mammalian visual system. Neuron. 1998;20:235–243. doi: 10.1016/s0896-6273(00)80452-3. [DOI] [PubMed] [Google Scholar]
- Fukuchi-Shimogori T, Grove EA. Neocortex patterning by the secreted signaling molecule FGF8. Science. 2001;294:1071–1074. doi: 10.1126/science.1064252. [DOI] [PubMed] [Google Scholar]
- Fukuchi-Shimogori T, Grove EA. Emx2 patterns the neocortex by regulating FGF positional signaling. Nat Neurosci. 2003;6:825–831. doi: 10.1038/nn1093. [DOI] [PubMed] [Google Scholar]
- Gao PP, Yue Y, Zhang JH, Cerretti DP, Levitt P, Zhou R. Regulation of thalamic neurite outgrowth by the Eph ligand ephrin-A5: implications in the development of thalamocortical projections. Proc Natl Acad Sci USA. 1998;95:5329–5334. doi: 10.1073/pnas.95.9.5329. [DOI] [PMC free article] [PubMed] [Google Scholar]
- Garel S, Rubenstein JL. Intermediate targets in formation of topographic projections: inputs from the thalamocortical system. Trends Neurosci. 2004;27:533–539. doi: 10.1016/j.tins.2004.06.014. [DOI] [PubMed] [Google Scholar]
- Garel S, Huffman KJ, Rubenstein JL. Molecular regionalization of the neocortex is disrupted in Fgf8 hypomorphic mutants. Development. 2003;130:1903–1914. doi: 10.1242/dev.00416. [DOI] [PubMed] [Google Scholar]
- Grove EA, Fukuchi-Shimogori T. Generating the cerebral cortical area map. Annu Rev Neurosci. 2003;26:355–380. doi: 10.1146/annurev.neuro.26.041002.131137. [DOI] [PubMed] [Google Scholar]
- Hamasaki T, Leingartner A, Ringstedt T, O’Leary DD. EMX2 regulates sizes and positioning of the primary sensory and motor areas in neocortex by direct specification of cortical progenitors. Neuron. 2004;43:359–372. doi: 10.1016/j.neuron.2004.07.016. [DOI] [PubMed] [Google Scholar]
- Hansen MJ, Dallal GE, Flanagan JG. Retinal axon response to ephrin-as shows a graded, concentration-dependent transition from growth promotion to inhibition. Neuron. 2004;42:717–730. doi: 10.1016/j.neuron.2004.05.009. [DOI] [PubMed] [Google Scholar]
- Hashimoto M, Mikoshiba K. Neuronal birthdate-specific gene transfer with adenoviral vectors. J Neurosci. 2004;24:286–296. doi: 10.1523/JNEUROSCI.2529-03.2004. [DOI] [PMC free article] [PubMed] [Google Scholar]
- Kalatsky VA, Stryker MP. New paradigm for optical imaging: temporally encoded maps of intrinsic signal. Neuron. 2003;38:529–545. doi: 10.1016/s0896-6273(03)00286-1. [DOI] [PubMed] [Google Scholar]
- Lopez-Bendito G, Molnar Z. Thalamocortical development: how are we going to get there? Nat Rev Neurosci. 2003;4:276–289. doi: 10.1038/nrn1075. [DOI] [PubMed] [Google Scholar]
- Mackarehtschian K, Lau CK, Caras I, McConnell SK. Regional differences in the developing cerebral cortex revealed by ephrin-A5 expression. Cereb Cortex. 1999;9:601–610. doi: 10.1093/cercor/9.6.601. [DOI] [PubMed] [Google Scholar]
- McLaughlin T, Hindges R, O’Leary DD. Regulation of axial patterning of the retina and its topographic mapping in the brain. Curr Opin Neurobiol. 2003;13:57–69. doi: 10.1016/s0959-4388(03)00014-x. [DOI] [PubMed] [Google Scholar]
- Molnar Z, Adams R, Blakemore C. Mechanisms underlying the early establishment of thalamocortical connections in the rat. J Neurosci. 1998;18:5723–5745. doi: 10.1523/JNEUROSCI.18-15-05723.1998. [DOI] [PMC free article] [PubMed] [Google Scholar]
- O’Leary DD. Do cortical areas emerge from a protocortex? Trends Neurosci. 1989;12:400–406. doi: 10.1016/0166-2236(89)90080-5. [DOI] [PubMed] [Google Scholar]
- O’Leary DD, McLaughlin T. Mechanisms of retinotopic map development: Ephs, ephrins, and spontaneous correlated retinal activity. Prog Brain Res. 2005;147:43–65. doi: 10.1016/S0079-6123(04)47005-8. [DOI] [PubMed] [Google Scholar]
- Pfeiffenberger C, Cutforth T, Woods G, Yamada J, Renteria RC, Copenhagen DR, Flanagan JG, Feldheim DA. Ephrin-As and neural activity are required for eye-specific patterning during retinogeniculate mapping. Nat Neurosci. 2005;8:1022–1027. doi: 10.1038/nn1508. [DOI] [PMC free article] [PubMed] [Google Scholar]
- Prakash N, Vanderhaeghen P, Cohen-Cory S, Frisen J, Flanagan JG, Frostig RD. Malformation of the functional organization of somatosensory cortex in adult ephrin-A5 knockout mice revealed by in vivo functional imaging. J Neurosci. 2000;20:5841–5847. doi: 10.1523/JNEUROSCI.20-15-05841.2000. [DOI] [PMC free article] [PubMed] [Google Scholar]
- Rakic P. Specification of cerebral cortical areas. Science. 1988;241:170–176. doi: 10.1126/science.3291116. [DOI] [PubMed] [Google Scholar]
- Rashid T, Upton AL, Blentic A, Ciossek T, Knoll B, Thompson ID, Drescher U. Opposing gradients of Ephrin-As and EphA7 in the superior colliculus are essential for topographic mapping in the mammalian visual system. Neuron. 2005;47:57–69. doi: 10.1016/j.neuron.2005.05.030. [DOI] [PubMed] [Google Scholar]
- Saito T, Nakatsuji N. Efficient gene transfer into the embryonic mouse brain using in vivo electroporation. Dev Biol. 2001;240:237–246. doi: 10.1006/dbio.2001.0439. [DOI] [PubMed] [Google Scholar]
- Sestan N, Rakic P, Donoghue MJ. Independent parcellation of the embryonic visual cortex and thalamus revealed by combinatorial Eph/ephrin gene expression. Curr Biol. 2001;11:39–43. doi: 10.1016/s0960-9822(00)00043-9. [DOI] [PubMed] [Google Scholar]
- Shimogori T, Grove EA. Fibroblast growth factor 8 regulates neocortical guidance of area-specific thalamic innervation. J Neurosci. 2005;25:6550–6560. doi: 10.1523/JNEUROSCI.0453-05.2005. [DOI] [PMC free article] [PubMed] [Google Scholar]
- Sur M, Leamey CA. Development and plasticity of cortical areas and networks. Nat Rev Neurosci. 2001;2:251–262. doi: 10.1038/35067562. [DOI] [PubMed] [Google Scholar]
- Suzuki SC, Inoue T, Kimura Y, Tanaka T, Takeichi M. Neuronal circuits are subdivided by differential expression of type-II classic cadherins in postnatal mouse brains. Mol Cell Neurosci. 1997;9:433–447. doi: 10.1006/mcne.1997.0626. [DOI] [PubMed] [Google Scholar]
- Tabata H, Nakajima K. Efficient in utero gene transfer system to the developing mouse brain using electroporation: visualization of neuronal migration in the developing cortex. Neuroscience. 2001;103:865–872. doi: 10.1016/s0306-4522(01)00016-1. [DOI] [PubMed] [Google Scholar]
- Uziel D, Muhlfriedel S, Zarbalis K, Wurst W, Levitt P, Bolz J. Miswiring of limbic thalamocortical projections in the absence of ephrin-A5. J Neurosci. 2002;22:9352–9357. doi: 10.1523/JNEUROSCI.22-21-09352.2002. [DOI] [PMC free article] [PubMed] [Google Scholar]
- Vanderhaeghen P, Polleux F. Developmental mechanisms patterning thalamocortical projections: intrinsic, extrinsic and in between. Trends Neurosci. 2004;27:384–391. doi: 10.1016/j.tins.2004.05.009. [DOI] [PubMed] [Google Scholar]
- Vanderhaeghen P, Lu Q, Prakash N, Frisen J, Walsh CA, Frostig RD, Flanagan JG. A mapping label required for normal scale of body representation in the cortex. Nat Neurosci. 2000;3:358–365. doi: 10.1038/73929. [DOI] [PubMed] [Google Scholar]
- Wilkinson DG. Multiple roles of EPH receptors and ephrins in neural development. Nat Rev Neurosci. 2001;2:155–164. doi: 10.1038/35058515. [DOI] [PubMed] [Google Scholar]
- Wong RO. Retinal waves and visual system development. Annu Rev Neurosci. 1999;22:29–47. doi: 10.1146/annurev.neuro.22.1.29. [DOI] [PubMed] [Google Scholar]
- Yun ME, Johnson RR, Antic A, Donoghue MJ. EphA family gene expression in the developing mouse neocortex: regional patterns reveal intrinsic programs and extrinsic influence. J Comp Neurol. 2003;456:203–216. doi: 10.1002/cne.10498. [DOI] [PubMed] [Google Scholar]
- Zhou C, Tsai SY, Tsai MJ. COUP-TFI: an intrinsic factor for early regionalization of the neocortex. Genes Dev. 2001;15:2054–2059. doi: 10.1101/gad.913601. [DOI] [PMC free article] [PubMed] [Google Scholar]
Associated Data
This section collects any data citations, data availability statements, or supplementary materials included in this article.
Supplementary Materials
Supplemental Data include three figures and Supplemental Experimental Procedures and are available with this article online at http://www.neuron.org/cgi/content/full/48/4/577/DC1/.