Abstract
Budding and vesiculation of erythrocyte membranes occurs by a process involving an uncoupling of the membrane skeleton from the lipid bilayer. Vesicle formation provides an important means whereby protein sorting and trafficking can occur. To understand the mechanism of sorting at the molecular level, we have developed a micropipette technique to quantify the redistribution of fluorescently labeled erythrocyte membrane components during mechanically induced membrane deformation and vesiculation. Our previous studies indicated that the spectrin-based membrane skeleton deforms elastically, producing a constant density gradient during deformation. Our current studies showed that during vesiculation the skeleton did not fragment but rather retracted to the cell body, resulting in a vesicle completely depleted of skeleton. These local changes in skeletal density regulated the sorting of nonskeletal membrane components. Highly mobile membrane components, phosphatidylethanolamine- and glycosylphosphatidylinositol-linked CD59 with no specific skeletal association were enriched in the vesicle. In contrast, two components with known specific skeletal association, band 3 and glycophorin A, were differentially depleted in vesicles. Increasing the skeletal association of glycophorin A by liganding its extrafacial domain reduced the fraction partitioning to the vesicle. We conclude that this technique of bilayer/skeleton uncoupling provides a means with which to study protein sorting driven by changes in local skeletal density. Moreover, it is the interaction of particular membrane components with the spectrin-based skeleton that determines molecular partitioning during protein sorting.
Budding and vesiculation of erythrocyte membranes occurs by a process involving an uncoupling of the membrane skeleton from the lipid bilayer. Vesicle formation provides an important means whereby protein sorting can occur, allowing for the selective retention of certain proteins in the plasma membrane and the removal of others. This process serves a critical biologic function at a number of stages in the life span of an erythroid cell. During differentiation, iron is transported into the erythroblast for hemoglobin synthesis by receptor-mediated endocytosis of vesicles containing complexed transferrin receptor, transferrin, and iron (1). At a later point in erythroid terminal differentiation, vesiculation plays a crucial role in remodeling of the reticulocyte membrane. During this period of reticulocyte maturation, a number of integral membrane proteins including transferrin receptor (2), CD36 (3), α4β1, and α5β1 (4) are lost from the cell surface. Although the mechanism for depletion of many of these molecules from the membrane is unknown, it has been clearly shown that transferrin receptor is removed by exocytosis (5–7).
Vesiculation of the mature erythrocyte plasma membrane occurs in certain diseases and during blood storage. In sickle cell anemia, membranes of circulating erythrocytes actively undergo both exocytosis and endocytosis (8, 9). Peripheral blood collected from individuals with sickle cell disease contains vesicles enriched in red cell membrane glycosylphosphatidylinositol (GPI)-anchored proteins, including acetylcholinesterase and decay-accelerating factor (10). Cytoplasmic vesicles present in sickle cells express on their surface plasma membrane Ca2+-ATPase, suggesting that they arise by endocytosis from the plasma membrane (11). During blood storage, red cells shed vesicles that, like those observed in sickle cell anemia, contain GPI-anchored proteins (12) as well as A, B, and Rh blood group antigens (13).
Vesicle formation is not limited to the plasma membrane; indeed, it is critical to protein sorting and trafficking in a variety of subcellular compartments of nucleated cells. Protein components of secretory vesicles, lysosomes, and plasma membranes are all sorted and directed to their distinct destinations via vesiculation of the Golgi complex (14, 15). This elaborate process necessitates the retention of resident Golgi membrane proteins and the selective removal of others (16). However, despite the immense biologic importance of vesiculation, the molecular mechanism underlying this lateral segregation of membrane components is not well understood. To study this process, we have developed a method of membrane protein sorting in human erythrocytes driven by mechanically altering skeletal network density. In the first stage of this technique, we used fluorescence-imaged microdeformation in which a single red cell, with a fluorescently labeled membrane component, is aspirated into a glass micropipette creating a gradient in skeletal density along the aspirated membrane projection (17, 18). Local skeletal density is highest at the pipette entrance, lowest at the cap of the membrane projection and relatively unchanged in the nonaspirated spherical portion of the cell. In the second stage, application of increased aspiration pressure increased fluid flow between the pipette and the membrane projection that caused a hydrodynamic instability and resulted in separation of the cap region from the remainder of the cell and produced a membrane vesicle.
With this technique, we observed striking differences in protein sorting among membrane components. We report that although highly mobile lipid and GPI-linked proteins were driven toward the cap and enriched in the vesicle, skeletal-associated proteins such as band 3 and glycophorin A were depleted in the vesicle. Moreover, the degree of association of integral proteins with the membrane skeleton dramatically affected their compartmentalization.
MATERIALS AND METHODS
Cells.
After obtaining informed consent, blood from normal volunteers and an individual with Mi V blood type, in which the hybrid glycophorin lacks the cytoplasmic tail (19, 20), was collected in acid citrate–dextrose. Mi V samples were stored at 77 K and fast-thawed when needed.
Antibodies.
Murine mAb R10 is specific for the exoplasmic domain of glycophorin A (21) and was a gift from David Anstee (International Blood Group Reference Laboratory, Bristol, England). Anti-CD59 was purchased from Serotec.
Fluorescein Phosphatidylethanolamine Incorporation.
To intercalate phosphatidylethanolamine into the lipid bilayer of erythrocytes, 1.5 μl of N-(fluorescein-5-thiocarbamoyl)-1,2-dihexadecanoyl-sn-glycero-3-phosphoethanolamine (DHPE; Molecular Probes) dissolved in methanol at 0.25 mM was incubated with 150 μl of PBS and 30 μl of packed erythrocytes for 15 min at room temperature.
Fluorescent Labeling.
For fluorescence-imaged microdeformation studies, band 3 was labeled in situ with eosin-5-maleimide (EMA; Molecular Probes) by using techniques modified from Nigg and Cherry (22) and Golan (23). Ten microliters of whole blood was suspended and washed three times at 4°C in 1 ml of PBS with 0.05 g % BSA to prevent echinocyte formation. The cells were then incubated at room temperature for 30 min in EMA (50 μg/ml) dissolved in PBS/BSA and then washed three times in PBS/BSA buffer. To label actin, 4 μM rhodamine phalloidin (Molecular Probes) was dissolved in a lysis buffer containing 7.5 mM phosphate (20 milliosmolar) with 5.5 mg of MgATP per 10 ml to a final volume of 20 μl. Five microliters of red cells were then added and the suspension was incubated on ice for 4 min. To reseal the cells, 2.5 μl of 10× PBS was added and the cells were incubated at 37°C for 30 min and then resuspended in 290 milliosmolar PBS/BSA. To label glycophorin A, its extrafacial sialic acid was mildly oxidized with NaIO4 at a final concentration of 0.5 mM for 12 min, washed three times in PBS/BSA and then incubated with fluorescein thiosemicarbazide (FTSC; Molecular Probes) at 50 μg/ml in PBS/BSA for 30 min at 25°C. The red cells were then washed three times in 290 milliosmolar PBS/BSA before use.
Analysis of Membrane Component Sorting.
The redistribution of membrane components in response to mechanical deformation was analyzed by the technique of fluorescence-imaged microdeformation (17, 18). For these studies, the membrane component of interest was fluorescently labeled in situ and then individual cells were aspirated into a glass micropipette (diameter, 1.0–1.2 μm). Upon aspiration, membrane was drawn into the pipette resulting in the production of a cylindrical membrane projection with a hemispherical cap at the end of the projection. Osmotic control of the cell’s surface area to volume ratio determined the maximum aspiration length (L). Increased aspiration pressure produced a hydrodynamic instability that caused the membrane cap portion to vesiculate.
Relative material density profiles for the aspirated cell and released vesicle were calculated from the fluorescence intensities of the image, which vary because of spatial distribution of labeled molecules and object geometry. Intensity variations because of known object geometry were removed by using the fact that the surface integral around the symmetry axis (azimuthal direction) from a cylinder or sphere of constant surface density, normalized by the radius, is a constant along the radial direction, in conjunction with the following assumptions: (i) there is a linear relation between density of fluorescently labeled molecules and fluorescence intensity and (ii) the integral of the point spread function of the optical system is a constant for all points on the object being imaged. The relative material density was then normalized with the mean density in the minimally deformed spherical portion of the aspirated cell.
The mean and standard deviation of the normalized density of various membrane components in the released vesicles were derived from aspirations of a series of labeled cells. All micromanipulations and fluorescence imaging experiments were performed at room temperature.
RESULTS
The Membrane Skeleton Does Not Fragment During Vesiculation.
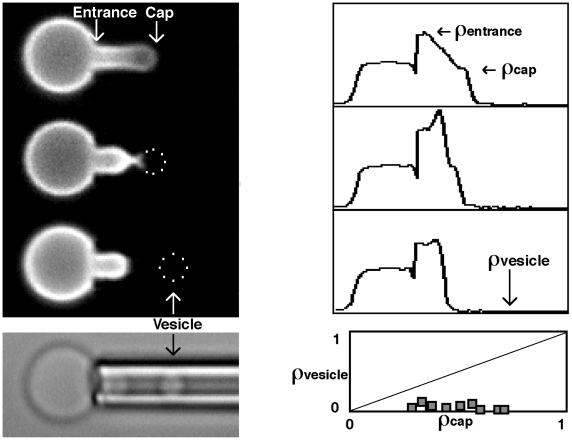
To quantify the changes produced in the local skeletal density during microdeformation and vesiculation, skeletal actin was labeled with rhodamine phalloidin. Microdeformation resulted in an actin density that was highest at the pipette entrance (ρentrance) and lowest at the aspirated membrane cap (ρcap) (Fig. 1). As observed (17), the actin gradient persisted in equilibrium after deformation. During vesiculation, the membrane cap region was observed to form a neck and then completely separate from the cell body. During this process, the skeleton retracted toward the cell body leaving the vesicle depleted of actin. In an analysis of a series of labeled cells, the mean and standard deviation of the normalized density of actin in the vesicle were 0.07 ± 0.03 (10 cells). The vesicle density (ρvesicle) was independent of the cap density (ρcap) before vesiculation (Fig. 1). These data clearly indicate that the skeleton does not fragment during vesiculation because skeletal fragmentation would result in vesicle density equal to prevesiculation cap density (ρvesicle = ρcap).
Figure 1.
Fluorescence micrographs and corresponding intensity profiles of rhodamine phalloidin-labeled actin in erythrocytes. Intensity profiles were plotted as relative fluorescence intensity (ordinate) vs. distance along the deformation axis (abscissa). Microaspiration deformed the skeleton resulting in an actin density that was highest at the pipette entrance (ρentrance) and decreased toward the cap (ρcap) (top fluorescence image). During vesiculation the skeleton retracted to the cell body leaving the vesicle (dotted outline) depleted of actin (two middle fluorescence images and bottom bright-field image). The bottom right plot shows that the relative density of rhodamine phalloidin-labeled actin in the vesicle was independent of the normalized density of the prevesiculation cap (0.07 ± 0.03). Each data point (squares) represents a single vesiculation event. This is clearly different from a membrane fragmentation process in which ρvesicle would equal ρcap (dashed line). Fluorescence intensity of an image varies because of (i) spatial distribution of labeled molecules and (ii) object geometry. In the intensity profiles, variations because of geometry have been removed with appropriate integration and intensities were normalized with the mean intensity of the spherical portion of the cell.
Mechanical Sorting Enriches the Vesicle with Highly Mobile Species.
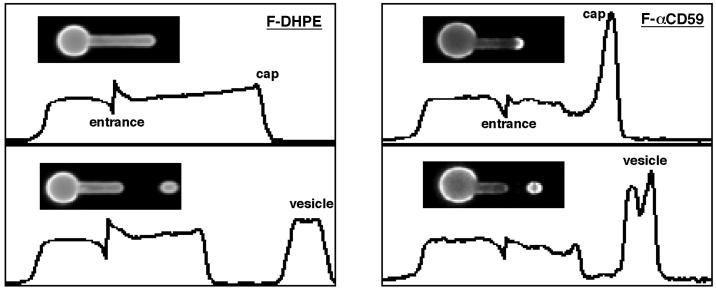
To study the behavior of membrane lipid during vesiculation, we incorporated fluorescein-DHPE into the membrane bilayer. In contrast to rhodamine phalloidin-labeled actin, we observed a small density gradient along the pipette that was lowest at the pipette entrance and increased toward the cap (Fig. 2). Because lipid is a relatively incompressible two-dimensional fluid, there is no change in intrinsic lipid concentration during microdeformation. Therefore, the observed lipid gradient reflects the protein enrichment within the bilayer at the pipette entrance and the protein depletion within the bilayer at the cap. Upon vesiculation we observed the normalized mean vesicle density of fluorescein-DHPE was 1.27 ± 0.10 (14 cells). As with actin, the fluorescein-DHPE gradient was in equilibrium after deformation.
Figure 2.
Fluorescence micrographs and corresponding intensity profiles of fluorescein-DHPE and fluorescein-anti-CD59. Intensity profiles were plotted as relative fluorescence intensity (ordinate) vs. distance along the deformation axis (abscissa). Fluorescein-DHPE sorting resulted in a small density gradient along the aspirated membrane portion, during microdeformation (Upper Left) and a slight increase in the vesicle density after vesiculation (Lower Left). In contrast, sorting of fluorescein-anti-GPI-linked CD59 resulted in an accumulation at the cap (Upper Right) and an enriched vesicle density after vesiculation (Lower Right).
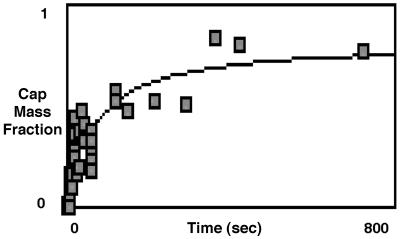
Another important class of membrane components is GPI-linked proteins. To study their behavior during the sorting process, we mapped the redistribution of fluorescently labeled anti-CD59. These molecules collected at the aspirated cap portion of the deformed cell, resulting in vesicles that were highly enriched with antibody-bound CD59 (Fig. 2). In marked contrast to both actin and phosphatidylethanolamine, labeled CD59 was not in equilibrium after deformation and the density at the cap increased with time. To quantify this temporal behavior, we plotted the amount of labeled CD59 that migrated toward the cap, expressed as a fraction of the total amount in the aspirated membrane projection (cap mass fraction), vs. time (Fig. 3). These data showed that close to 100% of the aspirated labeled CD59 was able to migrate toward the cap, after membrane deformation. An additional and surprising observation was that at short times (∼1 sec) after deformation, there was no accumulation of labeled CD59 at the cap, indicating that accumulation of labeled CD59 was a post-deformation event. Thus, for molecular components with a distribution not in equilibrium after deformation, the density of the membrane component in the vesicle was dependent on the elapsed time between membrane deformation and vesiculation.
Figure 3.
Temporal behavior of fluorescein-anti-CD59 after microdeformation. The amount of labeled CD59 that migrated toward the cap as a fraction of the total amount in the aspirated membrane projection (cap mass fraction) is plotted as a function of time. The cap mass fraction was calculated from integrals of the density profiles for the migratory portion and total amount of aspirated labeled CD59. Note that in short times (∼1 sec after deformation), there was no collection of CD59 at the cap. At longer times (>400 sec) almost 100% of the aspirated labeled CD59 migrated toward the cap.
Sorting of Integral Membrane Proteins Reflects Their Skeletal Attachment.
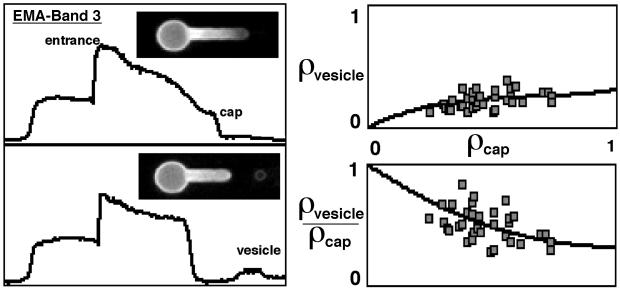
To analyze the manner in which integral membrane proteins are sorted, we studied two major red cell membrane proteins, band 3 and glycophorin A. Both integral proteins have interactions with skeletal membrane components that are reflected by the presence of mobile and immobile fractions, as measured by lateral mobility studies (23–25). We first examined the behavior of band 3 labeled with EMA. During microdeformation, EMA-labeled band 3 (Fig. 4) exhibited a density gradient along the pipette that was less steep than that observed for actin. However, like actin and fluorescein-DHPE but unlike labeled CD59, the EMA density gradient did not change with time after deformation. After vesiculation, in contrast to actin, vesicles clearly showed membrane-associated EMA-labeled band 3 (Fig. 4) with a mean normalized density of 0.27 ± 0.07 (37 cells). In further contrast to actin, the vesicle density (ρvesicle) showed a nonlinear dependence on ρcap (Fig. 4). Although a linear dependence of ρvesicle on ρcap would have indicated that a constant fraction of the prevesiculated cap partitioned into the vesicle, the observed nonlinear dependence implied that as ρcap decreased, an increasing fraction of band 3 in the prevesiculated cap, partitioned into the vesicle (vesicle enrichment). Vesicle enrichment was explicitly shown in a plot of the ratio of vesicle density to prevesiculation cap density (ρvesicle/ρcap) that decreased as a function of ρcap (Fig. 4). Thus, our EMA-labeled band 3 data suggest that it is the interaction of an integral membrane protein with the spectrin-based skeleton that mediates protein sorting during vesiculation.
Figure 4.
Fluorescence micrographs and corresponding intensity profiles of EMA-labeled band 3. Intensity profiles were plotted as relative fluorescence intensity (ordinate) vs. distance along the deformation axis (abscissa). After microdeformation labeled band 3 exhibited a density gradient similar but less steep than that of labeled actin (Upper Left). After vesiculation, and in contrast to actin, the resulting vesicle clearly showed membrane-associated labeled band 3 (Lower Left). The band 3 vesicle density (ρvesicle) showed a nonlinear dependence on the cap density prior to vesiculation (ρcap) (Upper Right). This dependence suggested that as ρcap decreased, a greater fraction of band 3 in the prevesiculated cap was partitioning into the vesicle (enrichment) (Lower Right).
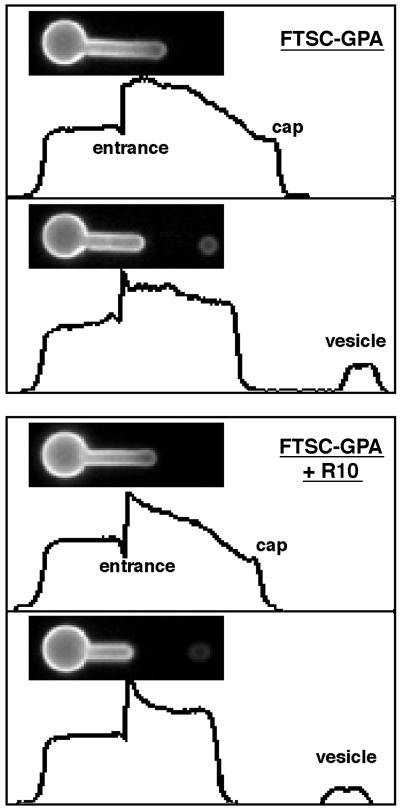
To further confirm the importance of skeletal interactions in determining integral membrane protein sorting, we used our previously developed model system involving glycophorin A. With this model system, we have the ability to either increase or decrease the degree of interaction of glycophorin A with the spectrin-based skeleton using monoclonal R10 antibody binding to normal cells and cells expressing the Mi V glycophorin A variant, respectively (25, 26). For our current studies, we first determined the behavior of FTSC-labeled normal glycophorin A. Like band 3, FTSC-labeled glycophorin A exhibited a density gradient along the pipette that, although less steep than that observed for band 3, did not change as a function of time after membrane deformation. FTSC-labeled glycophorin A clearly partitioned into the vesicle (Fig. 5) with a mean normalized density of 0.35 ± 0.07 (35 cells). We next studied if an increased association of glycophorin A with the membrane skeleton would influence the amount of glycophorin A sorted into the vesicle. Binding of monoclonal R10 antibody to glycophorin A, which increases its interaction with the membrane skeleton, decreased the mean normalized vesicle density of FTSC-labeled glycophorin A to 0.22 ± 0.02 (15 cells), compared with 0.35 ± 0.07 (35 cells) for nonliganded cells.
Figure 5.
Fluorescence micrographs and corresponding intensity profiles of FTSC-labeled glycophorin A in the absence and presence of mAb R10. Intensity profiles were plotted as relative fluorescence intensity (ordinate) vs. distance along the deformation axis (abscissa). The two upper images show vesiculation of glycophorin A in the absence of R10 binding. After microdeformation, labeled glycophorin A exhibited a density gradient that was less steep than that of either labeled actin or band 3. Vesicles clearly showed membrane associated labeled glycophorin A, which was at a higher density than band 3. The two lower images show vesiculation of glycophorin A in the presence of R10 binding. R10 binding decreased the partitioning of FTSC-labeled glycophorin A into the vesicle.
Finally, we examined the impact of decreased skeletal interaction on protein sorting during vesiculation by studying the partitioning of Mi V glycophorin A variant (19, 20). In previous studies we have established that these variant glycophorin A molecules, with severely truncated cytoplasmic domains, demonstrated no increased interaction with the skeletal network after R10 antibody binding (25, 26). We therefore examined the redistribution of FTSC-labeled variant glycophorin in the presence and absence of R10 binding. In contrast to our observations with normal glycophorin A, the vesicle density of FTSC-glycophorin in Mi V cells was not decreased after binding of R10. These data clearly show that sorting of integral membrane proteins reflects their skeletal attachment.
DISCUSSION
We have developed an experimental approach to study membrane protein sorting in erythrocyte plasma membranes driven by mechanically altering membrane skeletal density. By using actin to characterize the behavior of the membrane skeleton during this process, we showed a retraction of actin molecules along the aspirated membrane projection resulting in the release of a vesicle completely depleted of actin. These observations clearly indicated that bilayer/skeletal uncoupling, rather than membrane skeleton fragmentation, occurred during vesiculation. This technique has thus allowed us to map the dynamics of the partitioning pattern of individual molecular components in a single cell during membrane vesiculation.
A major finding of the current study is that protein sorting during membrane vesiculation is regulated by interactions between integral proteins and the spectrin-based membrane skeleton. In support of this conclusion are our observations of the molecular behavior of band 3, an integral protein with known skeletal association, and CD59, a lipid-anchored protein with no linkage to the membrane skeleton. Although GPI-linked CD59 molecules were enriched in released vesicles, as compared with their native density, band 3 molecules were depleted. An additional interesting finding was the nonlinear dependence of ρvesicle on ρcap observed for EMA-labeled band 3. We suggest that the nonlinear dependence is because of mechanically induced alterations in skeletal density that result in accumulation of immobile band 3 at the pipette entrance. As a consequence, a higher than normal fraction of mobile band 3 accumulates at the prevesiculation cap and partitions into the vesicle during the vesiculation process.
Further support of the importance of skeletal interactions in determining integral membrane protein sorting comes from studies on glycophorin A. Because we had previously shown that association of glycophorin A with the membrane skeleton could be augmented by antibody binding (25, 26), we were able to use this model system to test whether the degree of interaction of an integral protein with the skeleton would influence its lateral segregation. Indeed, the extent of association of glycophorin A with the membrane skeleton determined the amount of glycophorin A partitioning into the vesicle; by increasing the extent of association, the sorting of glycophorin A into the vesicle was decreased. Thus, these observations clearly show that the molecular process of protein sorting of membrane components is regulated, in large part, by their interaction with the skeleton.
Sickle erythrocytes (10), stored red cells (12), and calcium-loaded erythrocytes (27) shed vesicles selectively enriched in proteins linked to the membrane via a GPI anchor. In the current studies, lipid-anchored protein was also found to be highly enriched in the released vesicle. We suggest that as the membrane skeleton retracts, lipid-linked proteins move via steric interactions down the skeletal density gradient into the skeleton-free region of the nascent vesicle. We speculate that this preferential exclusion of GPI-anchored proteins from skeleton-rich regions of the membrane may point to a general mechanism for sorting this class of membrane components.
In nucleated cells, sorting of particular membrane components to distinct subcellular destinations is orchestrated by the Golgi complex (14, 15). Golgi membranes express a defined set of skeletal proteins including homologues of β-spectrin (28) and ankyrin (29), two important structural components of the erythrocyte skeleton. From our data, we speculate that during protein trafficking through the Golgi, dynamic interactions with Golgi-associated skeletal proteins may promote the retention of Golgi-resident proteins and facilitate the selective trafficking of noninteracting components. Indeed, the innovative technique of protein sorting driven by changes in local skeletal density reported herein may be applicable to a number of organelles. It should also enable us to study receptor-mediated endocytosis and to characterize the vesiculation process in pathologic erythrocytes, such as hereditary spherocytes with decreased spectrin density (for review, see ref. 30). Our observations lend strong support to the thesis that the spectrin-based skeleton can act as a protein-sorting machine (31).
Acknowledgments
We thank Ms. Alicia Sheppard for her expertise in preparation of this manuscript, Dr. Morris Blajchman for providing the Mi V erythrocytes, and Ms. Phyllis Walker for storage of these cells. This work was supported by National Institutes of Health Grants DK26263, HL31579, and DK32094 and by the Director, Office of Health and Environment Research Division, U.S. Department of Energy, under Contract DE-AC03-76SF00098.
ABBREVIATIONS
- GPI
glycosylphosphatidylinositol
- DHPE
N-(fluorescein-5-thiocarbamoyl)-1,2-dihexadecanoyl-sn-glycero-3-phosphoethanolamine
- EMA
eosin-5-maleimide
- FTSC
fluorescein thiosemicarbazide
References
- 1.Ciechanover A, Schwartz A L, Dautry-Varsat A, Lodish H F. J Biol Chem. 1983;258:9681–9689. [PubMed] [Google Scholar]
- 2.Horton M A. Exp Cell Res. 1983;144:361–366. doi: 10.1016/0014-4827(83)90415-9. [DOI] [PubMed] [Google Scholar]
- 3.Okumura N, Tsuji K, Nakahata T. Blood. 1992;80:642–650. [PubMed] [Google Scholar]
- 4.Vuillett-Gaugler M, Breton-Gorius J, Vainchenker W, Guichard J, Leroy C, Tchernia G, Coulombel L. Blood. 1990;75:865–873. [PubMed] [Google Scholar]
- 5.Frazier J L, Caskey H J, Yoffe M, Seligman P A. J Clin Invest. 1982;69:853–865. doi: 10.1172/JCI110525. [DOI] [PMC free article] [PubMed] [Google Scholar]
- 6.Pan B T, Blostein R, Johnstone R M. Biochem J. 1983;210:37–47. doi: 10.1042/bj2100037. [DOI] [PMC free article] [PubMed] [Google Scholar]
- 7.Van Bockxmeer F M, Morgan E H. Biochim Biophys Acta. 1979;584:76–83. doi: 10.1016/0304-4165(79)90237-x. [DOI] [PubMed] [Google Scholar]
- 8.Allan D, Raval P J. Biomed Biochim Acta. 1983;42:11–12. [PubMed] [Google Scholar]
- 9.Westerman M P, Diloy P M, Streczyn M. Biochim Biophys Acta. 1979;557:149–155. doi: 10.1016/0005-2736(79)90097-x. [DOI] [PubMed] [Google Scholar]
- 10.Bütikofer P, Kuypers F A, Xu C M, Chiu D T Y, Lubin B H. Blood. 1989;74:1481–1485. [PubMed] [Google Scholar]
- 11.Williamson P, Puchula E, Penniston J T, Westerman M P, Schlegel R A. J Cell Physiol. 1992;152:1–9. doi: 10.1002/jcp.1041520102. [DOI] [PubMed] [Google Scholar]
- 12.Long K E, Yomtovian R, Kida M, Knez J J, Medof M E. Transfusion. 1993;33:294–300. doi: 10.1046/j.1537-2995.1993.33493242635.x. [DOI] [PubMed] [Google Scholar]
- 13.Oreskovic R T, Dumaswala U J, Greenwalt T J. Transfusion. 1992;32:848–849. doi: 10.1046/j.1537-2995.1992.32993110758.x. [DOI] [PubMed] [Google Scholar]
- 14.Pfeffer S R, Rothman J E. Annu Rev Biochem. 1987;56:829–852. doi: 10.1146/annurev.bi.56.070187.004145. [DOI] [PubMed] [Google Scholar]
- 15.Rothman J E, Orci L. Nature (London) 1992;355:409–415. doi: 10.1038/355409a0. [DOI] [PubMed] [Google Scholar]
- 16.Machamer C. Trends Cell Biol. 1991;1:141–144. doi: 10.1016/0962-8924(91)90001-P. [DOI] [PMC free article] [PubMed] [Google Scholar]
- 17.Discher D E, Mohandas N, Evans E A. Science. 1994;266:1032–1035. doi: 10.1126/science.7973655. [DOI] [PubMed] [Google Scholar]
- 18.Discher D E, Mohandas N. Biophys J. 1996;71:1680–1694. doi: 10.1016/S0006-3495(96)79424-9. [DOI] [PMC free article] [PubMed] [Google Scholar]
- 19.Mawby W J, Anstee D J, Tanner M J A. Nature (London) 1981;291:161–162. doi: 10.1038/291161a0. [DOI] [PubMed] [Google Scholar]
- 20.Vignal A, Rahuel C, El Maliki B, LeVan Kim C, London J, Blanchard D, d’Auriol L, Galibert F, Blajchman M A, Cartron J P. Eur J Biochem. 1989;184:337–344. doi: 10.1111/j.1432-1033.1989.tb15024.x. [DOI] [PubMed] [Google Scholar]
- 21.Anstee D J, Edwards P A W. Eur J Immunol. 1982;12:228–232. doi: 10.1002/eji.1830120311. [DOI] [PubMed] [Google Scholar]
- 22.Nigg E A, Cherry R J. Biochemistry. 1979;18:3457–3465. doi: 10.1021/bi00583a004. [DOI] [PubMed] [Google Scholar]
- 23.Golan D E, Brown C S, Cianci C M L, Furlong S T. J Cell Biol. 1986;103:819–828. doi: 10.1083/jcb.103.3.819. [DOI] [PMC free article] [PubMed] [Google Scholar]
- 24.Golan D E. In: Red Blood Cell Membrane and Lipid Diffusion. Agre P, Parker J C, editors. New York: Dekker; 1989. pp. 367–400. [Google Scholar]
- 25.Knowles D W, Chasis J A, Evans E A, Mohandas N. Biophys J. 1994;66:1726–1732. doi: 10.1016/S0006-3495(94)80965-8. [DOI] [PMC free article] [PubMed] [Google Scholar]
- 26.Chasis J A, Reid M E, Jensen R H, Mohandas N. J Cell Biol. 1988;107:1351–1357. doi: 10.1083/jcb.107.4.1351. [DOI] [PMC free article] [PubMed] [Google Scholar]
- 27.Test S T, Bütikofer P, Yee M C, Kuypers F A, Lubin B. Blood. 1991;78:3056–3065. [PubMed] [Google Scholar]
- 28.Beck K A, Malhotra V, Nelson W J. J Cell Biol. 1994;127:707–723. doi: 10.1083/jcb.127.3.707. [DOI] [PMC free article] [PubMed] [Google Scholar]
- 29.Devarajan P, Stabach P R, Mann A S, Ardito T, Kashgarian M, Morrow J S. J Cell Biol. 1996;133:819–830. doi: 10.1083/jcb.133.4.819. [DOI] [PMC free article] [PubMed] [Google Scholar]
- 30.Hassoun H, Palek J. Blood Rev. 1996;10:129–147. doi: 10.1016/s0268-960x(96)90021-1. [DOI] [PubMed] [Google Scholar]
- 31.Beck K, Nelson W. Am J Physiol. 1996;270:C1263–C1270. doi: 10.1152/ajpcell.1996.270.5.C1263. [DOI] [PubMed] [Google Scholar]


