

Abstract
The development of small molecules to control gene expression could be the spearhead of future-targeted therapeutic approaches in multiple pathologies. Among heterocyclic dications developed with this aim, a phenyl-furan-benzimidazole dication DB293 binds AT-rich sites as a monomer and 5′-ATGA sequence as a stacked dimer, both in the minor groove. Here, we used a protein/DNA array approach to evaluate the ability of DB293 to specifically inhibit transcription factors DNA-binding in a single-step, competitive mode. DB293 inhibits two POU-domain transcription factors Pit-1 and Brn-3 but not IRF-1, despite the presence of an ATGA and AT-rich sites within all three consensus sequences. EMSA, DNase I footprinting and surface-plasmon-resonance experiments determined the precise binding site, affinity and stoichiometry of DB293 interaction to the consensus targets. Binding of DB293 occurred as a cooperative dimer on the ATGA part of Brn-3 site but as two monomers on AT-rich sites of IRF-1 sequence. For Pit-1 site, ATGA or AT-rich mutated sequences identified the contribution of both sites for DB293 recognition. In conclusion, DB293 is a strong inhibitor of two POU-domain transcription factors through a cooperative binding to ATGA. These findings are the first to show that heterocyclic dications can inhibit major groove transcription factors and they open the door to the control of transcription factors activity by those compounds.
INTRODUCTION
The aim of exerting precise control over the expression level of specified genes using a small molecule drug is an objective with major consequences for many therapeutic applications including cancer, chronic inflammatory disorders, neuro-degenerative or cardiovascular diseases (1–4). This control requires the specific targeting of DNA at defined sequences that are essential for a gene directly implicated in the origin of the pathology. With this view a number of natural or synthetic compounds designed to specifically target fixed DNA sequences were analyzed for sequence selectivity and affinity for DNA recognition sites and specific DNA-interacting protein displacement. For example, binding of distamycin A to its minor groove DNA target suppresses the DNA interaction of various proteins such as OTF-1, NFE-1, AntpHD, TBP or the EBV nuclear antigen 1. Derived from distamycin, the pyrrole-imidazole polyamides series (5–9) were designed to specifically target some well-known transcription factors such as Ets, TBP, GCN-4 or NF-κB (5) and more recently the estrogen or androgen receptors (10), NF-Y (11), AP-1 (12) or HIF-1 (13,14). Other classes of compounds also inhibited transcription factors DNA binding: mithramycin A and its relative chromomycin A3 against Sp1 (15,16), cryptolepine against NF-kB (17) or echinomycin against HIF-1 (18,19).
In the present study, we evaluate the ability of a small compound to precisely modulate well-known transcription factors in a global and competitive approach in order to rapidly identify the best targets for a designed molecule. We focused on the phenyl-furan-benzimidazole diamidine derivative DB293 (Figure 1A) as an interesting molecule for transcription factor modulation. This compound derives from the diphenyl-furan diamidine DB75 that binds to DNA at AT-rich sequences in the minor groove and has promising activity against a variety of microorganisms, including Pneumocystis carinii and others infectious diseases (20,21). The biological effects of DB75 result from its interactions with DNA and subsequent inhibition of DNA-dependent enzymes (22). Replacement of amidine groups by imidazolines shifts the mode of binding to DNA and confers intercalative properties in GC-rich sequences (23), whereas the replacement of a phenyl ring by a benzimidazole moiety leads to the additional specific recognition in the minor groove of the 5′-ATGA sequence. Binding to G·C-containing specific sequences involves hydrogen bond contacts within a wider and more shallow minor groove in comparison with the minor groove of A·T base pairs and is a challenge for sequence-specific targeting using small compounds. Stoichiometric studies of the DB293 binding to DNA revealed its interaction as a monomer on AT-rich tracks but as dimers stacked head-to-tail on 5′-ATGA site (24), both within the minor groove (25). In most cases, mutation within the 5′-ATGA reduces the strength of DB293 binding to the DNA target, such as substitution of the central dinucleotide, shows a profound impact on drug binding (26). Although the DNA sequence specifically targeted by this compound is well established, there has been no investigation of its activity on transcription factors. In this article, we present the first evidence to show that DB293 is a potent inhibitor of some transcription factors that have an ATGA sequence in their recognition sites.
Figure 1.

Screening for the modulation of transcription factor DNA binding using TranSignal protein/DNA array I. (A) Structure of DB293 compound. (B–D) Membrane of protein DNA/array I. The mixture of TranSignal biotinylated oligonucleotides was incubated with HT-29 nuclear extracts in the absence (B, control) or presence of 1 µM (C) or 5 µM (D) of DB293. (E) Inhibition ratio for the transcription factor/DNA-binding activities induced by DB293. The DNA-binding activity of these transcription factors is specified: ‘ATGA’ corresponds to a consensus-binding sequence containing an ATGA site and ‘other’ to a consensus-binding site that contains neither an ATGA nor an AT-rich site. The values correspond to the ratio between the analyses performed in the presence or absence of the drug, after normalization of the points relative to the internal controls (right and bottom lanes in Figure 1B–D).
MATERIAL AND METHODS
Plasmid constructions
To obtain DNA fragments containing the various transcription factor binding sites, pUC19 plasmid was digested at a unique BamHI restriction site and then ligated using T4 DNA ligase (BioLabs, Ipswich, Massachussetts, USA) in the presence of double-stranded oligonucleotides containing the Brn-3 (5′-GATCAGCTCGTCTGCGCGTTAATGAGCTGTGCGAGTCGCC), IRF-1 (5′-GATCAGCTCGTGGAAGCGAAAATGAAATTGACTAGTCGCC) and Pit-1 (5′-GATCAGTGTCTTCCTGAATATGAATAAGAAATAAGTCGCC) consensus-binding sites (underlined) with the sequence context identical to that used in TranSignal DNA arrays. To get a clearer view of the sequence-specific binding of DB293 compound on Pit-1-binding site, the Pit-1 DNA-binding sequence defined in the sequence context used for SPR analysis was sub-cloned as described above in pUC19 as a wild-type form (Pit-1-WT: 5′-GATCAGTGTCTTCCTGAATATGAATAAGAAGTCAGTCGCC) or mutated binding sites (bold) at the ATGA site (Pit-1-M1: 5′- GATCAGTGTCTTCCTGAATACGAATAAGAAGTCAGTCGCC), the AT-rich site (Pit-1-M2: 5′-GATCAGTGTCTTCCTGAATATGAACGAGAAGTCAGTCGCC) or both (Pit-1-M3: 5′-GATCAGTGTCTTCCTGAATACGAACGAGAAGTCAGTCGCC) or lacking the two AT-rich sites 5′- and 3′- to the ATGA (Pit1-M4: 5′- GATCAGTGTCTTCCTGAGTATGAACGAGAAGTCAGTCGCC). The attempted constructs were verified by sequencing and further amplified and purified using Qiagen maxi preps.
The pCMV-IRF-1, pCMV-Pit-1 and pcDNA3-HNF-4 expression vectors were generous gifts from Dr Angela Battistini (Rome, Italy) (27), Dr Clara V. Álvarez (Santiago de Compostela, Spain) (28) and Dr Bernard Laine (Inserm U837, Lille, France) (29), respectively. The pRK5-Brn-3 expression vectors were generously provided by Dr Mengqing Xiang (Piscataway, USA) (30).
TranSignal protein/DNA array I
The binding process was performed as described by the manufacturer (Panomics, Fremont, California, USA) with small changes (31). Briefly, the biotinylated TranSignal probes ™ mixture was incubated in the absence (control) or presence of 1 or 5 µM of DB293. HT-29 nuclear extracts (15 µg), prepared using the Panomics nuclear extraction kit as recommended by the manufacturer, were then added and incubated for 1 h to allow the formation of transcription factor/DNA complexes. Such complexes were then isolated after electrophoresis on a 2% agarose gel in 0.5X TBE using 8-mm wide combs for 20 min at 120 V and the portion of gel containing the transcription factors/DNA complexes was recovered by cutting the gel area as recommended. The DNA probes were denatured and hybridized on TranSignal™ membranes at 42°C overnight in the appropriate buffer. After three washings, chemoluminescent revelation was carried out and the spot intensities quantified using ImageQuant™. Results are expressed as the ratio of the intensities obtained in the presence of DB293 versus in the absence (control membrane). The data points showing at least a 1.5-fold change are considered as significant.
Electrophoretic mobility shift assay (EMSA)
The oligonucleotides 5′-GCGCGTTAATGAGCTGTG for Brn-3 (32), 5′-GTCTTCCTGAATATGAATAAGAAATAA for Pit-1 (33), 5′-GGAAGCGAAAATGAAATTGACT for IRF-1 (34) and 5′-TCAGCTTGTACTTTGGTACAACTA for HNF-4 (35) binding sites were 5′-end-labeled by T4 polynucleotide kinase prior to hybridization to their complementary sequence and purified on polyacrylamide gels as reported (61). Pit-1-WT, -M1 to -M4 sequences are described above. The additional Pit1-M5 (5′-GATCAGTGTCTTCCTGAGTATGAATAAGAAGTCAGTCGCC) and Pit1-M6 (5′-GATCAGTGTCTTCCTGAGTACGAATAAGAAGTCAGTCGCC) sequences were specifically designed to provide further insight in Pit-1 protein binding to the specified sequence by completing the single and double mutant series. Both double-stranded oligonucleotides were 3′-end-labeled using [α-32P]dGTP (GE Healthcare, Vélizy, France, 3000 Ci/mmol) as described (36). The binding experiment was derived from (37) with the following modifications. The drug/DNA interaction was performed in the presence of the indicated compound at the specified concentration with 0.66 µg of poly(dG·dC)2 as a nonspecific competitor [poly(dI·dC)2 must be avoided due to a minor groove structure that is similar to that of the DB293 target sequence poly(dA·dT)2] in binding buffer (15 mM Tris–HCl, pH 7.5, 50 mM KCl, 1.5 mM EDTA, 10% glycerol, 1.5 mM DTT, 10 µg BSA) for 20 min at room temperature. Nuclear extract (5 µg) or reticulocyte lysate (1 µl) (Promega, Madison, Wisconsin, USA) was then added for an additional 30 min incubation at 4°C and the protein/DNA complexes separated on 6% nondenaturing polyacrylamide gels for 3 h at 300 V in 0.5× TBE buffer (89 mM Tris–borate pH 8.3, 1 mM EDTA).
DNase I footprinting
The pUC19-Brn-3, pUC19-IRF-1 and pUC19-Pit-1 plasmids containing the sequences established from Panomics, as well as the pUC19-Pit-1-WT, pUC19-Pit-1-M1, pUC19-Pit-1-M2, pUC19-Pit-1-M3 and pUC19-Pit-1-M4 were digested using EcoRI and PstI restriction enzymes, 3′-32P-end labeled using [α-32P]dATP (GE Healthcare, Vélizy, France, 3000 Ci/mmol) and experiments were conducted as recently described (38). A Molecular Dynamics STORM 860 was used to collect data, which were then analyzed using ImageQuant 3.3 software. Each resolved band was assigned to a particular bond within the DNA fragments by comparison of its position relative to the guanine ladder obtained from Maxam and Gilbert sequencing standard method.
SPR-biosensor binding determinations
The sequence of the 5′-Biotin labeled hairpin DNA oligomers are presented in the appropriate figures. SPR measurements were performed in MES buffer at 25°C with a BIAcore 2000 optical biosensor system (BIAcore Inc., Piscataway, New Jersey, USA) as recently described (38,39). In all cases, two strong binding sites were observed and the equilibrium constants were obtained from fitting plots of r (RU/RUmax) versus Cfree with a two site interaction model: r = (K1 × Cfree + 2 × K1 × K2 × Cfree2)/(1 + K1 × Cfree + K1 × K2 × Cfree2) (r, moles of bound compound per mole of DNA hairpin duplex; K1 and K2 macroscopic binding constants; Cfree, free compound concentration in equilibrium with the complex).
RESULTS
Selective inhibition of transcription factor DNA binding by DB293 using TranSignal™ protein/DNA array I
This microarray approach was used as a rapid and convenient method to simultaneously profile the modulation of the DNA-binding propensities of 54 transcription factors by DB293, in a single manipulation (31). DB293 (Figure 1A) binds AT-rich sequences as monomer and 5′-ATGA sites as dimers, both in the minor groove of the DNA. A number of transcription factor binding sites contain either an ATGA or an AT-rich sequence. Comparison of the experiments performed using probes pretreated or not with DB293 provides an insight into the specific modulation of the DNA binding of transcription factors by this ligand (Figure 1). The 54 different transcription factor targets are spotted on a membrane as presented in Figure S1. Each sequence is recognized by a specific transcription factor or by a family of closely related transcription factors. Incubation with two concentrations of DB293 (1 and 5 µM, Figure 1C and D, respectively) and comparison to the control results (Figure 1B) reveals the inhibitory effects of the compound on DNA-binding activity (Figure 1E). Interestingly, both Pit-1 and Brn-3 contain an ATGA site within their respective binding sequence (32,33) and both are inhibited by DB293. By contrast, the IRF-1 protein, whose DNA-binding sequence also contains an ATGA site (34), failed to be affected by the presence of DB293. A table representing the ratio obtained using the ATGA and/or AT-rich containing DNA targets as well as all inhibited transcription factors is presented in Figure S1B. In this study, we choose to focus on ATGA-containing binding sites such as Pit-1 and Brn-3 (both of them belonging to the POU transcription factor family) and compared the results with those for IRF-1.
Validation of the targets using EMSA
To validate the macroarray results, we carried out EMSA using Pit-1, Brn-3, IRF-1 and HNF-4 transcription factors from HT-29 nuclear extract (Figure 2A and B) or proteins expressed from reticulocyte lysate (Figures 2C and S2). The formation of both protein/DNA complexes specific to Pit-1 or Brn-3 sequences (arrows) is efficiently inhibited by increasing concentrations of DB293. The identity of transcription factor was determined using super-shift experiments (data not shown). The Brn-3 family of proteins is expressed from three distinct genes encoding the closely related factors Brn-3a, Brn-3b and Brn-3c (40,41). In our experiments, Brn-3b failed to interact with our target sequence (data not shown) whereas both Brn-3a and -3c proteins recognize this sequence and are inhibited by DB293 (Figure S2). The transcription factor HNF-4 was used as a negative control since its consensus-binding site (35) neither contains an ATGA nor an AT-rich sequence and its DNA-binding ability is not affected even by high amounts of DB293 (Figure S2).
Figure 2.

EMSAs for the inhibition of transcription factors/DNA complex formation by DB293. Radiolabeled Pit-1 (A), Brn-3 (B) or IRF-1 (C) oligonucleotides were incubated alone (lanes ‘probe’), with HT-29 nuclear extracts (A and B) or IRF-1 protein expressed in reticulocyte lysate (C), in the absence (lanes ‘0’) or presence of increasing concentrations of DB293 as specified on the top of the lane (µM). Full arrows and open arrows correspond to the free radiolabeled-DNA probe and the specific protein/DNA complex, respectively. A 50-fold concentration of specific or nonspecific (NS) nonlabeled probe relative to the radiolabeled specific DNA probe were used to illustrate the specificity of the protein/DNA complexes. The positions of NS protein/DNA complexes observed in the presence of nuclear extracts are shown using an asterisk (*).
The same validation was performed using Pit-1 protein expressed from reticulocyte lysate. We used Pit-1 c-DNA from Rattus norvegicus whose POU-specific and homeobox domains present a high degree of identity with human Pit-1 (Figure S3). The Pit-1 protein/DNA complex observed from nuclear extracts is certainly a homo- or hetero-dimer based on the level of migration of the complex from comparison with that obtained using Pit-1 protein expressed alone in reticulocyte lysate (Figures 2A and S2C, respectively). In all cases, competition for Pit-1 and Brn-3 protein/DNA complex formation confirms the inhibitory effect of DB293 (Figure 2A and B). The quantification of the inhibitory effect indicates an IC50 of 1.5 µM for both Pit-1 and Brn-3 protein/DNA complex formation (Figures 2A and –B, and S4). In contrast, the IRF-1/DNA complex is only slightly inhibited by DB293 (IC50 > 50 µM) (Figure 2C and S4). The same results were obtained using Pit-1 and Brn-3a and Brn-3c expressed in reticulocyte lysate (Figure S2). As in TranSignal DNA arrays I screening, no displacement of the HNF-4/DNA complex was observed, even using the highest amount of DB293 (Figure S2). These gel shift experiments clearly validate the use of TranSignal protein/DNA arrays as a useful and convenient tool to efficiently and rapidly screen the modulation of the DNA interaction of transcription factors by small sequence-specific DNA ligands.
Location of the DB293 binding to the various consensus-binding sites
To understand why DB293 inhibits Pit-1 and Brn-3 but not IRF-1 protein/DNA complexes despite the presence of both ATGA and AT-rich target sequences in all three consensus-binding sites, we explored more precisely the DNA-binding profile of DB293 on Pit-1, Brn-3 and IRF-1 consensus-binding sites. An 80-bp radiolabeled DNA fragment containing the cloned consensus-binding sites (dotted lines on Figure 3) of Pit-1, Brn-3 and IRF-1 transcription factors, in the same context as that used in TranSignal protein/DNA array, was used for footprinting experiments. For Pit-1 DNA-binding site (Figure 3A and D), the differential cleavage analysis shows footprints centered on nucleotide positions 43 to 34 (ATGA site) and is further displaced on the surrounding AT-rich sequences (5′-TTATTCATATT). Nevertheless, it was difficult to discriminate between ATGA and AT-rich exact DNA recognition by DB293. For the Brn-3-binding site (Figure 3B and E), gel autoradiography and densitometric analysis reveal an interaction on ATGA and the juxtaposed 3′-AT-rich sequence (TTAATGA). Therefore, with both Pit-1 and Brn-3, the presence of an AT-rich site in 3′- or in 5′- of the ATGA sequence does not modify the interaction of DB293 to ATGA. In contrast, for the IRF-1 fragment (Figure 3C and F), the differential cleavage analysis shows the binding of DB293 on two independent AT-rich sites but not on the centered ATGA sequence as underlined: 5′-AAAATGAAATTGAC. This evidences that DB293 clearly prefers the AT-rich tracks rather than the central ATGA sequence of the IRF-1 consensus-binding site, in contrast to the results obtained using Pit-1 and Brn-3. Those experiments also show that DB293 efficiently binds Pit-1, Brn-3 and IRF-1 consensus-binding sites even if it failed to displace all three protein/DNA complexes, suggesting that the ATGA dimer recognition could be a determinant for the transcription factor DNA-binding inhibition.
Figure 3.

DNaseI footprinting of DB293 on Pit-1, Brn-3 and IRF-1 consensus-binding sites. The concentration (µM) of the drug is shown at the top of the appropriate lanes. Control tracks labeled ‘DNA’ contained no drug. Tracks labeled ‘G’ represent dimethyl sulfate-piperidine-treated DNA sample exemplifying guanines location. The cloned sequences containing the various consensus-binding sites in the context of that used in the TranSignal DNA array approach are located between two arrows ( ). Pit-1 cloned site is inverted in comparison with that for Brn-3 and IRF-1 consensus-binding sites. The localization of the footprints is specified using black boxes on the gels (A–C) and on the respective densitometric analysis (D–F). The plots are expressed as the ln (0.5, 1, 1.5 or 2 µM) of DB293/control DNA alone.
Stoichiometry of the interaction
Biosensor-surface plasmon resonance (SPR) analyses were performed to obtain quantitative insight into the precise organization of DB293 binding to the Pit-1-, Brn-3- and IRF-1-binding sites. The results were evaluated to determine the stoichiometry of the interaction as well as the binding affinity and cooperativity. SPR sensorgrams (Figure 4A) were obtained for increasing concentrations of DB293 in solutions injected over the 5′-biotinylated hairpin oligonucleotides containing the DNA-binding sites for Pit-1, Brn-3 or IRF-1 transcription factors (sequence in red, Figure 4) and blank surfaces. The sensorgrams (RU for a DNA surface–RU for the blank) were globally fitted with a two sites model (Figure 4B, see also Material and methods section) to obtain the equilibrium constants for the interactions (Figure 4C). The maximum RU for all of these DNAs is twice the RUmax value for a compound binding to one site and this clearly shows that two DB293 bind to each DNA. The relative values of the macroscopic equilibrium constants, K1 and K2, reflect the cooperativity of the interaction. For a noncooperative interaction K1 = 4 × K2, while for positive cooperativity K1 < 4 × K2 and for negative cooperativity it is >4. A cooperativity factor to assess the degree of cooperativity is defined as, CF = (K2/K1) × 4. For interaction with no cooperativity, CF = 1, and CF is >1 for positive cooperativity and <1 for negative cooperativity. The results clearly show that DB293 binds Brn-3-binding site with strong positive cooperativity. There is no significant cooperativity of DB293 binding to IRF-binding site and an intermediate cooperativity for Pit-1 recognition site. This quantified cooperative mode of binding, and previous results for DB293 binding to ATGA sequences (24,26), suggests that DB293 interacts cooperatively as a dimer stacked in the minor groove of the ATGA sequence in Brn-3 and to a lesser extent at the Pit-1 ATGA-binding site. In contrast, the lack of cooperativity in the binding of DB293 to the IRF-1-binding site confirms the previous footprinting data (Figure 3C and F) and the conclusion that DB293 interacts as monomers at the two independent AT-rich sites but not at the central ATGA sequence. This conclusion is strongly supported by SPR-binding studies with DB75, a related diamidine that does not form stacked dimers but only interacts with the AT-rich site. DB75 binds strongly and noncooperatively in a 2:1 complex to the IRF sequence but very weakly to Brn-3 (Figure S5). The Pit-1 results for DB75 are intermediate and this suggests that the Pit-1 AT sites and the ATGA compete for binding of DB293 while DB75 selects only the AT sequences.
Figure 4.

SPR analysis of the DB293 interaction to the various transcription factors binding sites. (A) SPR sensorgrams for binding of increasing concentrations of DB293 (from 1 nM to 0.4 µM, bottom to top of the curves) to the minimal Pit-1, Brn-3 and IRF-1 consensus-binding sites within biotinylated hairpin oligonucleotides. (B) Binding plots derived from SPR sensorgrams used to calculate the affinity constants for DB293 bound to the various sequences (see Material and methods section). The sequence and structure of the DNA sequences used are presented at the bottom of the figures. The specific consensus-binding sites are specified in red. (C) Equilibrium constants for DB293 binding to Pit-1, Brn-3 and IRF-1 minimal consensus-binding sites. The deduced cooperativity factor is used to identify the potential cooperativity of DB293 molecules for DNA binding. A weak nonspecific binding that was a factor of 10–50-fold less than the strong consensus binding was also obtained but could not be accurately determined.
Precise localization of DB293 on Pit-1 consensus-binding site
To more clearly define the precise mechanism of interaction of DB293 with Pit-1-binding site, DNaseI footprinting experiments were performed in a series of Pit-1 mutated sequences (Figure 5) with various point mutations derived from wild-type (WT) Pit-1 (see Material and methods section for point mutations). The M1 mutation, which affects only the 5′-TCAT site, modifies the DNA-binding profile of DB293 relative to that obtained with the Pit-1-WT site. Indeed, such a mutation point that changes the specific 5′-TCAT site to a nonspecific 5′-TCGT sequence abolishes the cleavage observed using the WT sequence and yields a maximum of cleavage inhibition centered on the C residue at position 41. Moreover, such removal of the ATGA/TCAT target site induces a shift of the DNaseI footprint toward the AT-rich site, TTATT, localized 5′ to the mutation point (position 42–46). The M2 fragment has base modifications in positions 44 and 45 that break the AT-rich site, and DNaseI cleavage carried out using this fragment shows roughly the same differential cleavage as obtained using the WT Pit-1 sequence (WT, top panel) with strong binding on the ATGA/TCAT site and the AT-rich site at the 3′ position. The mutations of either the ATGA/TCAT sequence and the AT-rich site of Pit-1 sequence on the M3 fragment totally abolish the DB293 interaction to Pit-1-binding site. Only a small binding to the TATT site at position 36–39 was observed. Finally, the removal of the AT-rich site located 3′ of the TCAT sequence results in an enhancement of the DB293 binding to the ATGA sequence (Figure 5, panel M4), the differential cleavage observed being even stronger than that obtained with the wild-type Pit-1 fragment (Figure 5B, panel WT). These results show that the binding of DB293 to the DNA sequence containing the Pit-1 consensus-binding site, used previously for TranSignal protein/DNA arrays and EMSA, requires the interaction with the ATGA site but also the surrounding AT-rich tracks.
Figure 5.

DNaseI footprinting of DB293 derivatives on wild-type or mutated Pit-1 minimal consensus-binding site. (A) The WT or various mutated radiolabeled DNA fragments were incubated with the amount of drug specified (µM) prior to digestion by DNaseI. Lanes ‘DNA’ and ‘G’, arrows and blacks boxes are as described in Figure 3. Differential cleavage plots derived from the gels are presented in (B). White boxes localize the ATGA site on the gels. The mutated bases are underlined. Negative values correspond to a ligand-protected site and positive values represent enhanced cleavage.
To more quantitatively define the interaction of DB293 with Pit-1, biotin-labeled wild-type, M1 and M2 Pit-1 sequences were captured in three different channels of a four-channel streptavidin-surface sensorchip (Figure 6). The sensorgrams for DB293 binding to all three DNAs again have RU maximum values that are twice the value per site and, as above, this indicates two DB293-binding sites per DNA (Figure 7B). Both the wild-type and M2 sequences have cooperativity factors between 5 and 6 (Figure 6C), in good agreement with the Pit-1 results from the sensorchip described above (Figure 4C). The results with the M1 sequence are strikingly different with a cooperativity factor of only 1.3. This is similar to the value for IRF sequence and is indicative of noncooperative binding when the ATGA site is removed by mutation. The DNaseI footprinting and SPR results are thus in good agreement for all three DNA sequences.
Figure 6.

SPR analysis of the DB293 interaction with wild-type or various mutated Pit-1 transcription factor binding sites. (A) SPR sensorgrams for binding of increasing concentrations of DB293 (1 nM to 0.4 µM) to the wild-type (WT) Pit-1 consensus-binding sites (red) or mutated sequences Pit-1-M1 (blue) or Pit-1-M2 (purple) sequences within biotinylated hairpin oligonucleotides in MES buffer, 25°C. The minimal consensus-binding sites are visualized in red. (B) Binding plots derived from SPR sensorgrams used to calculate the affinity constants for DB293 bound to the various sequences. Written in red are the specific consensus-binding sites with mutation points in blue (M1, removing the ATGA) or purple (M2, removing the AT-rich sequence 3′ to the ATGA). (C) Equilibrium constants for DB293 binding to Pit-1-WT, Pit-1-M1 and Pit-1-M2 sequences. The deduced cooperativity factor identifies the potential cooperativity of DB293 molecules for DNA binding. A weak nonspecific binding (factor of 10- to 50-fold less than the strong consensus binding) was also obtained but could not be accurately determined.
Figure 7.
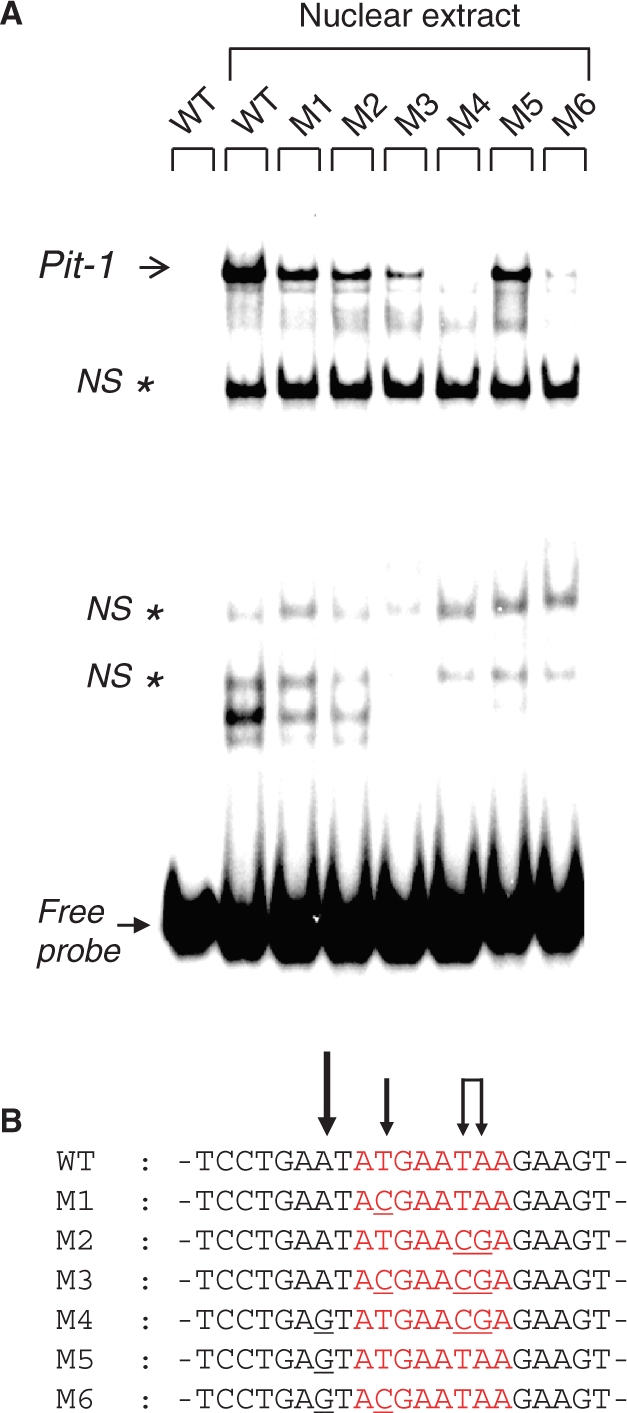
Electrophoretic mobility shift assays for the binding of Pit-1 transcription factor on wild-type or mutated consensus-binding sequence. (A) Radiolabeled WT or M1 to M6 Pit-1 oligonucleotides specified on the top of the lanes were incubated alone or with HT-29 nuclear extracts. Full and open arrows are as specified in Figure 2. Nonspecific (NS) protein/DNA complexes, localized using an asterisk (*), are observed using those oligonucleotides which are longer than that used for Figure 2 and were identified using a 50-fold concentration of specific or NS nonlabeled probes relatively to the radiolabeled specific DNA probe (data not shown). (B) The central part of the various sequences is presented with arrows exemplifying the importance of the relative mutation points.
Identification of the DB293-binding sequences essentials for Pit-1 protein/DNA binding
To define the base requirements for Pit-1 protein/DNA binding in our precise Pit-1-binding sequence, we evaluated the ability of Pit-1 protein, from nuclear extracts (Figure 7) or expressed in reticulocyte lysates (Figure S7), to interact with the WT or any of the M1 to M6 mutated sites (Material and methods section). Single mutation at either the ATGA sequence (M1), the 3′-AT-rich (M2) or 5′-AT-rich sites (M5) reduces the DNA-binding propensity of Pit-1 transcription factor. Concomitant mutations at the 5′-AT-rich site with either the ATGA (M4) or the 3′-AT site (M6) totally abolish the Pit-1/DNA complex formation whereas double mutant on both the ATGA and the 3′-AT site (M3) does not totally prevent Pit-1/DNA complex formation. Those data suggest that the AT-rich site positioned 5′- to ATGA is the main determinant for DNA interaction by Pit-1 (Figure 7B, larger arrow) but that either the ATGA or the 3′-AT-rich are also implicated to increase the DNA-binding affinity of Pit-1 protein. Such data also support the high flexibility for DNA-binding mode of the POU transcription factors as described by Jacobson et al. (42). The mutation of only one site weakens the DNA binding efficiency of POU domains whereas mutation at two of the three potential binding sites (either AT-rich or ATGA) strongly affects this potency, comforting the reality of a flexible DNA-binding mode for POUH and POUS subdomains.
DISCUSSION
In the present work, we identified DB293 as a potent inhibitor of DNA binding for Pit-1 and Brn-3, but not IRF-1, both transcription factors targeting an ATGA-containing consensus site. EMSA, DNaseI footprinting and SPR reveal that protein/DNA-binding inhibition correlates with cooperative dimer binding of DB293 to the ATGA site within the consensus sequence (Brn-3, Pit-1). The monomeric recognition of DB293 to both AT-rich sites surrounding the ATGA sequence does not affect the DNA-binding potency of IRF-1 (Figure 8A). There is therefore a strict correlation between binding mode and location of DB293 with the biological consequences of binding.
Figure 8.

Diagrams for hypothesized positioning of the protein and identified binding of DB293 on the various consensus-binding sites. The position of DB293 over IRF-1 (A), Brn-3 (B) and Pit-1 (C) consensus-binding sites (in red) are presented as black boxes stacking as monomers or dimers in the minor groove of the DNA. The points of interaction between the amino acids implicated in the DNA recognition and the specific target sequences are presented as dashed lanes. The water molecules implicated in the interaction are presented as full circles. In blue or pink are the DNA bases implicated in the protein direct interaction. Blue and pink dashed lanes correspond to interaction bonds within the major groove of the DNA whereas purple dashed lanes correspond to interaction bonds within the minor groove.
These observations with Brn-3, Pit-1 and IRF-1 binding by DB293 agree quite well with our knowledge about selective binding of dications at AT-sites. The compounds bind quite strongly to sequences with A-tracts (An) and AT steps (AnTn), but not TA steps (43). The two AT sequences in IRF (A5T and A3T2) are thus strong AT-binding sites and binding at those sites prevents interaction with the ATGA dimer site. With Brn-3, the TTAAT site is quite weak and DB293 binds to ATGA as a cooperative dimer. The Pit consensus is more complex. Both AT sequences contain a TA step that weakens AT sequence binding, but there is still some competition between the AT monomer and ATGA dimer binding.
Structurally, the IRF-1 DNA-binding domain is composed of a succession of α-helices, β-sheets and linker domains (α1–β2–L1–α2–L2–α3–β3–L3–β4) organized to present the α3-helix in the major groove of the DNA resulting in a bending of the DNA axis toward the major groove (44). The sequence-selective DNA binding is due to amino acids contacts with GA (top strand) and TT (bottom strand) (Figure 8A). Other contacts between amino acids from α1 and α2-helices, L1, L2 and L3 linkers and the DNA phosphate backbone stabilized the protein/DNA complex. Such interaction is not affected by the interaction of DB293 on the opposite side (minor groove) of the AT-rich sites.
The POU domain is composed of two structurally independent domains: the POU homeodomain (POUH) and the POU-specific domain (POUS) functionally cooperating as a DNA-binding unit and endowing an intrinsic conformational flexibility (42,45). To our knowledge, no X-ray crystallography of Brn-3 DNA-binding domain was performed but it was assumed that the binding mode of Brn-3 could be similar to that of the POU-domain transcription factors Oct-1 (45) and Pit-1 (Figure S6). From crystallographic structure of the Oct-1 protein bound to the octamer sequence ATGCAAAT (46), we suggest that POUH of Brn-3 interacts with the AT-rich part and POUS with ATGA on the other strand of the DNA (Figure 8B). Both sub-domains could be displaced upon binding of DB293 (black boxes) on the ATGA and AT-rich parts of Brn-3 binding site (localized in figures 3B–E). Since DB293 increases the size of the minor groove upon dimeric binding on ATGA, we assume that the subsequent reduction in the size of the major groove on the opposite side inhibits the correct positioning of the POUS α3-helix in the major groove of the ATGA sequence.
For Pit-1 DNA-binding domain, the X-ray crystallographic structure was established in complex with DNA-binding sites from the growth hormone GH1 and the prolactine promoters (42,47). From those data and our results, we propose that the binding of POUH domain implies interactions between Arg46, Val47, Cys50, Asn51 and Gln54 residues of α3-helix and the major groove of the 5′-ATGA sequence with contacts in the minor groove through binding of Arg5 (amino-terminal tail of POUH) on the 3′-A of ATGA (top strand) and the T of the 3′-AT-rich site (bottom strand). In the same manner, we suggest that POUS makes contacts within the major groove of the AT-rich part through residues Ser43, Gln44, Thr45 and Arg49 of its α3-helix (Figure 8C). According to DNaseI footprinting (Figures 3A–D and 5) and SPR experiments (Figures 4 and 6), DB293 can interact with Pit-1 site on each AT-rich sites as monomers and two other DB293 molecules as dimer in the minor groove of ATGA sequence (black boxes, Figure 8C). This correlates with the sequence determinants implicated in the Pit-1 protein/DNA complex formation evidenced from gel shift analysis (Figure 7). Therefore, we hypothesized that the interaction of DB293 with both the AT-rich sites and the ATGA sequence in the minor groove can block the interaction of POUS with the 5′-AT-rich sequence as well as that of POUH with the ATGA sequence (Figure 8C).
POU transcription factors play an important role in cellular differentiation but Brn-3 and Pit-1 are also implicated in tumorigenesis. Indeed, Brn-3a regulates the growth of cervical cancer cells in vivo with a level of Brn-3a being overexpressed of 300-fold in cervical intraepithelial neoplasia type 3 (48). Brn-3b was shown to be a key element in cellular growth and proliferation in human breast cancer cells (49), can repress expression of the BRCA-1 antioncogene in breast cancer cells (50) or overexpress CDK4 implicated in the regulation of cell growth (51). Pit-1 is responsible for the development of three from five of the endocrine cells types and the trans-activation of genes including prolactin and growth hormone genes (33,52). Pit-1 expression was implicated in pituitary tumor proliferation (53) and pituitary adenomas (54) but its role was subjected to controversy (55). Pit-1 was also associated with proliferation and tumorigenesis in breast cancers (56).
In conclusion, as a first point, we have validated the TranSignal protein/DNA array as a useful tool to screen for the modulation of the DNA binding of multiple transcription factors by small sequence-selective compounds. As a second point, we have shown that the presence of a target sequence is a prerequisite but is not sufficient to induce an effect on the transcription factor activity. The inhibition by a compound depends more specifically on the precise positioning on the target DNA sequence and the orientation toward the DNA helix of the amino acids that make DNA contacts. The inhibition of Pit-1 and Brn-3 binding to DNA by DB293 occurs also probably as a consequence of DB293 binding as a dimer in the ATGA. This binding enlarges the minor groove thus reducing the size of the major groove on the opposite side and subsequently prevents the correct positioning of the α3-helix of the POU-domains on their consensus-binding sites.
Specific transcription factors are key regulators of oncogenesis and often play a major role in the development of severe human diseases. As yet, it has been difficult to selectively modulate their activity through the control of their DNA-binding capacity. This study, and others, suggest that this goal can be envisaged. DB-type molecules built on the model of DB293 and analogs (21) can be fine-tuned to recognize distinct DNA sequences and this may lead to the guided modulation of transcription factors activity. Novel therapeutic approaches based on transcription factor control can become a reality as we develop a broader understanding of the molecular recognition of DNA by small molecules.
SUPPLEMENTARY DATA
Supplementary Data are available at NAR Online.
ACKNOWLEDGEMENTS
We thank Dr Mengqing Xiang (Piscataway, USA) for providing us with the pRK5-Brn-3 expression vectors, Dr Clara Álvarez Villamarín (Santiago de Compostela, Spain) for the pCMV-Pit-1 plasmid, Dr Angela Battistini (Rome, Italy) for the pCMV-IRF-1 expression plasmids and Dr Bernard Laine (Inserm U837, Lille, France) for the pcDNA3-HNF-4 vector. We are grateful to the IRCL for technical help during this project (M.P.H.) and the IFR114-IMPRT for providing the access to the STORM equipment. This work was supported by grants to M.-H.D.-C. from the Association pour la Recherche contre le Cancer (ARC) and to W.D.W. and D.W.B. from the National Institutes of Health, USA (GM61587). We thank the Institut de Recherches sur le Cancer de Lille (IRCL), the Conseil Régional Nord-Pas-de-Calais and the ARC for a PhD fellowship to P.P. Funding to pay the Open Access publication charges for this article was provided by the ARC.
Conflict of interest statement. None declared.
Footnotes
Present address: Christian Bailly, Pierre Fabre Research Institute, Toulouse, France
REFERENCES
- 1.Uil TG, Haisma HJ, Rots MG. Therapeutic modulation of endogenous gene function by gents with designed DNA-sequence specificities. Nucleic Acids Res. 2003;31:6064–6078. doi: 10.1093/nar/gkg815. [DOI] [PMC free article] [PubMed] [Google Scholar]
- 2.Gniazdowski M, Denny WA, Nelson SM, Czyz M. Transcription factors as targets for DNA-interacting drugs. Curr. Med. Chem. 2003;10:909–924. doi: 10.2174/0929867033457683. [DOI] [PubMed] [Google Scholar]
- 3.Gniazdowski M, Denny WA, Nelson SM, Czyz M. Effects of anticancer drugs on transcription factor-DNA interactions. Expert Opin. Ther. Targets. 2005;9:471–489. doi: 10.1517/14728222.9.3.471. [DOI] [PubMed] [Google Scholar]
- 4.D’Incalci M, Brunelli D, Marangon E, Simone M, Tavecchio M, Gescher A, Mantovani R. Modulation of gene transcription by natural products—a viable anticancer strategy. Curr. Pharm. Des. 2007;13:2744–2750. doi: 10.2174/138161207781757097. [DOI] [PubMed] [Google Scholar]
- 5.Wemmer DE, Dervan PB. Targeting the minor groove of DNA. Curr. Opin. Struct. Biol. 1997;7:355–361. doi: 10.1016/s0959-440x(97)80051-6. [DOI] [PubMed] [Google Scholar]
- 6.Dervan PB, Edelson BS. Recognition of the DNA minor groove by pyrrole-imidazole polyamides. Curr. Opin. Struct. Biol. 2003;13:284–299. doi: 10.1016/s0959-440x(03)00081-2. [DOI] [PubMed] [Google Scholar]
- 7.Melander C, Burnett R, Gottesfeld JM. Regulation of gene expression with pyrrole-imidazole polyamides. J. Biotechnol. 2004;112:195–220. doi: 10.1016/j.jbiotec.2004.03.018. [DOI] [PubMed] [Google Scholar]
- 8.Dickinson LA, Burnett R, Melander C, Edelson BS, Arora PS, Dervan PB, Gottesfeld JM. Arresting cancer proliferation by small-molecule gene regulation. Chem. Biol. 2004;11:1583–1594. doi: 10.1016/j.chembiol.2004.09.004. [DOI] [PubMed] [Google Scholar]
- 9.Arndt HD, Schoof S. Polyamide- and RNA-based activators in living cells: a major step towards controlling gene expression. Chembiochem. 2007;8:1095–1098. doi: 10.1002/cbic.200700156. [DOI] [PubMed] [Google Scholar]
- 10.Nickols NG, Dervan PB. Suppression of androgen receptor-mediated gene expression by a sequence-specific DNA-binding polyamide. Proc. Natl Acad. Sci. USA. 2007;104:10418–10423. doi: 10.1073/pnas.0704217104. [DOI] [PMC free article] [PubMed] [Google Scholar]
- 11.Le NM, Sielaff AM, Cooper A, Mackay H, Brown T, Kotecha M, O’Hare C, Hochhauser D, Lee M, Hartley JA. Binding of f-PIP, a pyrrole- and imidazole-containing triamide, to the inverted CCAAT box-2 of the topoisomerase IIalpha promoter and modulation of gene expression in cells. Bioorg. Med. Chem. Lett. 2006;16:6161–6164. doi: 10.1016/j.bmcl.2006.09.043. [DOI] [PubMed] [Google Scholar]
- 12.Matsuda H, Fukuda N, Ueno T, Tahira Y, Ayame H, Zhang W, Bando T, Sugiyama H, Saito S, Matsumoto K, et al. Development of gene silencing pyrrole-imidazole polyamide targeting the TGF-beta1 promoter for treatment of progressive renal diseases. J. Am. Soc. Nephrol. 2006;17:422–432. doi: 10.1681/ASN.2005060650. [DOI] [PubMed] [Google Scholar]
- 13.Olenyuk BZ, Zhang GJ, Klco JM, Nickols NG, Kaelin W.G., Jr., Dervan PB. Inhibition of vascular endothelial growth factor with a sequence-specific hypoxia response element antagonist. Proc. Natl Acad. Sci. USA. 2004;101:16768–16773. doi: 10.1073/pnas.0407617101. [DOI] [PMC free article] [PubMed] [Google Scholar]
- 14.Nickols NG, Jacobs CS, Farkas ME, Dervan PB. Improved nuclear localization of DNA-binding polyamides. Nucleic Acids Res. 2007;35:363–370. doi: 10.1093/nar/gkl1042. [DOI] [PMC free article] [PubMed] [Google Scholar]
- 15.Blume SW, Snyder RC, Ray R, Thomas S, Koller CA, Miller DM. Mithramycin inhibits SP1 binding and selectively inhibits transcriptional activity of the dihydrofolate reductase gene in vitro and in vivo. J. Clin. Invest. 1991;88:1613–1621. doi: 10.1172/JCI115474. [DOI] [PMC free article] [PubMed] [Google Scholar]
- 16.Lee TJ, Jung EM, Lee JT, Kim S, Park JW, Choi KS, Kwon TK. Mithramycin A sensitizes cancer cells to TRAIL-mediated apoptosis by down-regulation of XIAP gene promoter through Sp1 sites. Mol. Cancer Ther. 2006;5:2737–2746. doi: 10.1158/1535-7163.MCT-06-0426. [DOI] [PubMed] [Google Scholar]
- 17.Olajide OA, Heiss EH, Schachner D, Wright CW, Vollmar AM, Dirsch VM. Synthetic cryptolepine inhibits DNA binding of NF-kappaB. Bioorg. Med. Chem. 2007;15:43–49. doi: 10.1016/j.bmc.2006.10.018. [DOI] [PubMed] [Google Scholar]
- 18.Kong D, Park EJ, Stephen AG, Calvani M, Cardellina JH, Monks A, Fisher RJ, Shoemaker RH, Melillo G. Echinomycin, a small-molecule inhibitor of hypoxia-inducible factor-1 DNA-binding activity. Cancer Res. 2005;65:9047–9055. doi: 10.1158/0008-5472.CAN-05-1235. [DOI] [PubMed] [Google Scholar]
- 19.Nickols NG, Jacobs CS, Farkas ME, Dervan PB. Modulating hypoxia-inducible transcription by disrupting the HIF-1-DNA interface. ACS Chem. Biol. 2007;2:561–571. doi: 10.1021/cb700110z. [DOI] [PMC free article] [PubMed] [Google Scholar]
- 20.Blagburn BL, Drain KL, Land TM, Moore PH, Kinard RG, Lindsay DS, Kumar A, Shi J, Boykin DW, Tidwell RR. Dicationic furans inhibit development of Cryptosporidium parvum in HSD/ICR suckling Swiss mice. J. Parasitol. 1998;84:851–856. [PubMed] [Google Scholar]
- 21.Wilson WD, Nguyen B, Tanious FA, Mathis A, Hall JE, Stephens CE, Boykin DW. Dications that target the DNA minor groove: compound design and preparation, DNA interactions, cellular distribution and biological activity. Curr. Med. Chem. Anticancer Agents. 2005;5:389–408. doi: 10.2174/1568011054222319. [DOI] [PubMed] [Google Scholar]
- 22.Bailly C, Dassonneville L, Carrasco C, Lucas D, Kumar A, Boykin DW, Wilson WD. Relationships between topoisomerase II inhibition, sequence-specificity and DNA binding mode of dicationic diphenylfuran derivatives. Anticancer Drug Des. 1999;14:47–60. [PubMed] [Google Scholar]
- 23.Wilson WD, Tanious F, Ding D, Kumar A, Boykin DW, Colson P, Houssier C, Bailly C. Nucleic acid interactions of unfused aromatic cations: evaluation of proposed minor-groove, major-groove, and intercalation binding modes. J. Am. Chem. Soc. 1998;120:10310–10321. [Google Scholar]
- 24.Bailly C, Tardy C, Wang L, Armitage B, Hopkins K, Kumar A, Schuster GB, Boykin DW, Wilson WD. Recognition of ATGA sequences by the unfused aromatic dication DB293 forming stacked dimers in the DNA minor groove. Biochemistry. 2001;40:9770–9779. doi: 10.1021/bi0108453. [DOI] [PubMed] [Google Scholar]
- 25.Wang L, Bailly C, Kumar A, Ding D, Bajic M, Boykin DW, Wilson WD. Specific molecular recognition of mixed nucleic acid sequences: An aromatic dication that binds in the DNA minor groove as a dimer. Proc. Natl Acad. Sci. USA. 2000;97:12–16. doi: 10.1073/pnas.97.1.12. [DOI] [PMC free article] [PubMed] [Google Scholar]
- 26.Tanious FA, Wilson WD, Wang L, Kumar A, Boykin DW, Marty C, Baldeyrou B, Bailly C. Cooperative dimerization of a heterocyclic diamidine determines sequence-specific DNA recognition. Biochemistry. 2003;42:13576–13586. doi: 10.1021/bi034852y. [DOI] [PubMed] [Google Scholar]
- 27.Coccia EM, Del Russo N, Stellacci E, Orsatti R, Benedetti E, Marziali G, Hiscott J, Battistini A. Activation and repression of the 2-5A synthetase and p21 gene promoters by IRF-1 and IRF-2. Oncogene. 1999;18:2129–2137. doi: 10.1038/sj.onc.1202536. [DOI] [PubMed] [Google Scholar]
- 28.Garcia A, Alvarez CV, Smith R, Dieguez C. Regulation of Pit-1 expression by ghrelin and GHRP-6 through the GH secretagogue receptor. Mol. Endocrinol. 2001;15:1484–1495. doi: 10.1210/mend.15.9.0694. [DOI] [PubMed] [Google Scholar]
- 29.Suaud L, Formstecher P, Laine B. The activity of the activation function 2 of the human hepatocyte nuclear factor 4 (HNF-4alpha) is differently modulated by F domains from various origins. Biochem. J. 1999;340:161–169. [PMC free article] [PubMed] [Google Scholar]
- 30.Liu W, Khare SL, Liang X, Peters MA, Liu X, Cepko CL, Xiang M. All Brn3 genes can promote retinal ganglion cell differentiation in the chick. Development. 2000;127:3237–3247. doi: 10.1242/dev.127.15.3237. [DOI] [PubMed] [Google Scholar]
- 31.Lam R, Li X. An array-based method for specifically profiling multiple transcription factor activity. Am. Biotechnol. Lab. 2002;8:22–26. [Google Scholar]
- 32.Xiang M, Zhou L, Macke JP, Yoshioka T, Hendry SH, Eddy RL, Shows TB, Nathans J. The Brn-3 family of POU-domain factors: primary structure, binding specificity, and expression in subsets of retinal ganglion cells and somatosensory neurons. J. Neurosci. 1995;15:4762–4785. doi: 10.1523/JNEUROSCI.15-07-04762.1995. [DOI] [PMC free article] [PubMed] [Google Scholar]
- 33.Mangalam HJ, Albert VR, Ingraham HA, Kapiloff M, Wilson L, Nelson Ch, Elsholtz H, Rosenfeld MG. A pituitary POU domain protein, Pit-1, activates both growth hormone and prolactin promoters transcriptionally. Genes Dev. 1989;3:946–958. doi: 10.1101/gad.3.7.946. [DOI] [PubMed] [Google Scholar]
- 34.Tanaka N, Kawakami T, Taniguchi T. Recognition DNA sequences of interferon regulatory factor 1 (IRF-1) and IRF-2, regulators of cell growth and the interferon system. Mol. Cell. Biol. 1993;13:4531–4538. doi: 10.1128/mcb.13.8.4531. [DOI] [PMC free article] [PubMed] [Google Scholar]
- 35.Fraser JD, Martinez V, Straney R, Briggs MR. DNA binding and transcription activation specificity of hepatocyte nuclear factor 4. Nucleic Acids Res. 1998;26:2702–2707. doi: 10.1093/nar/26.11.2702. [DOI] [PMC free article] [PubMed] [Google Scholar]
- 36.David-Cordonnier MH, Laine W, Lansiaux A, Rosu F, Colson P, de Pauw E, Michel S, Tillequin F, Koch M, Hickman JA, et al. Covalent binding of antitumor benzoacronycines to double-stranded DNA induces helix opening and the formation of single-stranded DNA: unique consequences of a novel DNA-bonding mechanism. Mol Cancer Ther. 2005;4:71–80. [PubMed] [Google Scholar]
- 37.David-Cordonnier M-H, Hamdane M, Bailly C, D’Halluin J.-C. The DNA binding domain of the human c-Abl tyrosine kinase preferentially binds to DNA sequences containing an AAC-motif and to distorted DNA structures. Biochemistry. 1998;37:6065–6076. doi: 10.1021/bi973030w. [DOI] [PubMed] [Google Scholar]
- 38.Munde M, Ismail MA, Arafa R, Peixoto P, Collar CJ, Liu Y, Hu L, David-Cordonnier M-H, Lansiaux A, et al. Design of DNA minor groove binding diamidines that recognize GC base pair sequences: a novel dimeric-hinge motif. JACS. 2007:129. doi: 10.1021/ja074560a. 13732–13743. [DOI] [PMC free article] [PubMed] [Google Scholar]
- 39.Tanious FA, Nguyen B, Wilson WD. Biosensor-surface plasmon resonance methods for quantitative analysis of biomolecular interactions. Methods Cell Biol. 2008;84:53–77. doi: 10.1016/S0091-679X(07)84003-9. [DOI] [PubMed] [Google Scholar]
- 40.Lillycrop KA, Budrahan VS, Lakin ND, Terrenghi G, Wood JN, Polak JM, Latchman DS. A novel POU family transcription factor is closely related to Brn-3 but has a distinct expression pattern in neuronal cells. Nucleic Acids Res. 1992;20:5093–5096. doi: 10.1093/nar/20.19.5093. [DOI] [PMC free article] [PubMed] [Google Scholar]
- 41.Ninkina NN, Stevens GE, Wood JN, Richardson WD. A novel Brn3-like POU transcription factor expressed in subsets of rat sensory and spinal cord neurons. Nucleic Acids Res. 1993;21:3175–3182. doi: 10.1093/nar/21.14.3175. [DOI] [PMC free article] [PubMed] [Google Scholar]
- 42.Jacobson EM, Li P, Leon-del-Rio A, Rosenfeld MG, Aggarwal AK. Structure of Pit-1 POU domain bound to DNA as a dimer: unexpected arrangement and flexibility. Genes Dev. 1997;11:198–212. doi: 10.1101/gad.11.2.198. [DOI] [PubMed] [Google Scholar]
- 43.Tanious FA, Hamelberg D, Bailly C, Czarny A, Boykin DW, Wilson WD. DNA sequence dependent monomer-dimer binding modulation of asymmetric benzimidazole derivatives. J. Am. Chem. Soc. 2004;126:143–153. doi: 10.1021/ja030403+. [DOI] [PubMed] [Google Scholar]
- 44.Escalante CR, Yie J, Thanos D, Aggarwal AK. Structure of IRF-1 with bound DNA reveals determinants of interferon regulation. Nature. 1998;391:103–106. doi: 10.1038/34224. [DOI] [PubMed] [Google Scholar]
- 45.Herr W, Cleary MA. The POU domain: versatility in transcriptional regulation by a flexible two-in-one DNA-binding domain. Genes Dev. 1995;9:1679–1693. doi: 10.1101/gad.9.14.1679. [DOI] [PubMed] [Google Scholar]
- 46.Klemm JD, Rould MA, Aurora R, Herr W, Pabo CO. Crystal structure of the Oct-1 POU domain bound to an octamer site: DNA recognition with tethered DNA-binding modules. Cell. 1994;77:21–32. doi: 10.1016/0092-8674(94)90231-3. [DOI] [PubMed] [Google Scholar]
- 47.Scully KM, Jacobson EM, Jepsen K, Lunyak V, Viadiu H, Carrière C, Rose DW, Hooshmand F, Aggarwal AK, Rosenfeld MG. Allosteric effects of Pit-1 DNA sites on long-term repression in cell type specification. Science. 2000;290:1127–1131. doi: 10.1126/science.290.5494.1127. [DOI] [PubMed] [Google Scholar]
- 48.Ndisdang D, Morris PJ, Chapman C, Ho L, Singer A, Latchman DS. The HPV-activating cellular transcription factor Brn-3a is overexpressed in CIN3 cervical lesions. J. Clin. Invest. 1998;101:1687–1692. doi: 10.1172/JCI1089. [DOI] [PMC free article] [PubMed] [Google Scholar]
- 49.Dennis JH, Budhram-Mahadeo V, Latchman DS. The Brn-3b POU family transcription factor regulates the cellular growth, proliferation, and anchorage dependence of MCF7 human breast cancer cells. Oncogene. 2001;20:4961–4971. doi: 10.1038/sj.onc.1204491. [DOI] [PubMed] [Google Scholar]
- 50.Budhram-Mahadeo V, Ndisang D, Ward T, Weber BL, Latchman DS. The Brn-3b POU family transcription factor represses expression of the BRCA-1 anti-oncogene in breast cancer cells. Oncogene. 1999;18:6684–6691. doi: 10.1038/sj.onc.1203072. [DOI] [PubMed] [Google Scholar]
- 51.Samady L, Dennis J, Budhram-Mahadeo V, Latchman DS. Activation of CDK4 gene expression in human breast cancer cells by the Brn-3b POU family transcription factor. Cancer Biol. Ther. 2004;3:317–323. [PubMed] [Google Scholar]
- 52.Li S, Crenshaw E.B. 3rd, Rawson EJ, Simmons DM, Swanson LW, Rosenfeld MG. Dwarf locus mutants lacking three pituitary cell types result from mutations in the POU-domain gene pit-1. Nature. 1990;347:528–533. doi: 10.1038/347528a0. [DOI] [PubMed] [Google Scholar]
- 53.Castrillo JL, Theill LE, Karin M. Function of the homeodomain protein GHF1 in pituitary cell proliferation. Science. 1991;253:197–199. doi: 10.1126/science.1677216. [DOI] [PubMed] [Google Scholar]
- 54.Asa SL, Puy LA, Lew AM, Sundmark VC, Elsholtz HP. Cell type-specific expression of the pituitary transcription activator pit-1 in the human pituitary and pituitary adenomas. J. Clin. Endocrinol. Metab. 1993;77:1275–1280. doi: 10.1210/jcem.77.5.8077321. [DOI] [PubMed] [Google Scholar]
- 55.Pellegrini I, Barlier A, Gunz G, Figarella-Branger D, Enjalbert A, Grisoli F, Jaquet P. Pit-1 gene expression in the human pituitary and pituitary adenomas. J. Clin. Endocrinol. Metab. 79:189–196. doi: 10.1210/jcem.79.1.8027225. [DOI] [PubMed] [Google Scholar]
- 56.Gil-Puig C, Seoane S, Blanco M, Macia M, Garcia-Caballero T, Segura C, Perez-Fernandez R. Pit-1 is expressed in normal and tumorous human breast and regulates GH secretion and cell proliferation. Eur. J. Endocrinol. 2005;153:335–344. doi: 10.1530/eje.1.01962. [DOI] [PubMed] [Google Scholar]
Associated Data
This section collects any data citations, data availability statements, or supplementary materials included in this article.