


Abstract
Genomic DNA methylation profiles exhibit substantial variation within the human population, with important functional implications for gene regulation. So far little is known about the characteristics and determinants of DNA methylation variation among healthy individuals. We performed bioinformatic analysis of high-resolution methylation profiles from multiple individuals, uncovering complex patterns of inter-individual variation that are strongly correlated with the local DNA sequence. CpG-rich regions exhibit low and relatively similar levels of DNA methylation in all individuals, but the sequential order of the (few) methylated among the (many) unmethylated CpGs differs randomly across individuals. In contrast, CpG-poor regions exhibit substantially elevated levels of inter-individual variation, but also significant conservation of specific DNA methylation patterns between unrelated individuals. This observation has important implications for experimental analysis of DNA methylation, e.g. in the context of epigenome projects. First, DNA methylation mapping at single-CpG resolution is expected to uncover informative DNA methylation patterns for the CpG-poor bulk of the human genome. Second, for CpG-rich regions it will be sufficient to measure average methylation levels rather than assaying every single CpG. We substantiate these conclusions by an in silico benchmarking study of six widely used methods for DNA methylation mapping. Based on our findings, we propose a cost-optimized two-track strategy for mammalian methylome projects.
INTRODUCTION
DNA methylation is the only epigenetic modification that directly targets the DNA, and it is an important component of epigenetic regulation (1, 2). In mammalian genomes, DNA methylation is largely restricted to cytosines in a CpG context, and the genomic regions that harbor the highest density of CpG dinucleotides—known as CpG islands (3, 4)—exhibit the lowest levels of DNA methylation. Through its ability to induce locally condensed chromatin structure, DNA methylation contributes to gene regulation. Promoter hypermethylation is known to cause stable silencing of associated genes and plays an important role for both normal development (5) and disease (6).
Because of its general relevance for gene regulation and chromatin structure, experimental mapping of DNA methylation patterns continues to be of high biological and medical relevance, despite recent progress in predicting DNA methylation computationally (7–9). Initial DNA methylation mapping projects (see Bernstein et al. (10) and Bock and Lengauer (11) for recent reviews) not only illuminate the complex distribution of DNA methylation in the human genome, but also highlight the importance of inter-individual variation among DNA methylation profiles from different individuals. As the impact of epigenetic polymorphisms on gene expression and phenotypic traits is well-established (12, 13), DNA methylation variation is potentially a major contributor to phenotypic variation in humans.
Better understanding of inter-individual variation of DNA methylation is desirable also from a practical point of view. First, it is critical to know the range of DNA methylation variation in healthy individuals in order to confidently detect aberrant methylation in diseased patients. This point is exemplified by the optimization of cancer biomarkers for robustness and precision, during which it is critical to select CpG dinucleotides that exhibit small amounts of inter-individual variation within the groups of cancer patients and controls, respectively, but strong variation between the two groups (14). Second, large-scale DNA methylation mapping initiatives profit from robust estimates of DNA methylation variation, because such estimates provide a basis for rational choice of required sample sizes, selection of appropriate experimental methods and identification of genomic regions that require particular depth of analysis.
In this study, we quantitatively analyze the characteristics and determinants of DNA methylation variation among healthy individuals, based on a large-scale and high-resolution dataset originating from the Human Epigenome Project (HEP) of the Sanger Institute and Epigenomics AG (15). Furthermore, we use a combination of computational modeling and simulation in order to benchmark current experimental methods for DNA methylation mapping and to guide the strategy for establishing mammalian reference methylomes. In particular, we ask whether the use of high-resolution mapping methods is required and informative for all parts of the human genome or whether cheaper medium-resolution methods may be sufficient at least for certain parts of the genome.
MATERIALS AND METHODS
A dataset of high-resolution DNA methylation profiles from multiple individuals
As the basis for this study, we selected the HEP dataset reported by Eckhardt et al. (15), because it is the largest high-resolution, multi-individual dataset of DNA methylation profiles that has been published to date. Briefly, Eckhardt et al. (15) combined direct Sanger sequencing of bisulfite-converted DNA with a bioinformatic method for deriving quantitative and high-resolution DNA methylation profiles from chromatograms. With this strategy, they analyzed 2524 amplicons on human chromosomes 6, 20 and 22 in 12 different tissues and 43 different samples. Ten samples belonging to three tissues (CD4+ T lymphocytes, CD8+ T lymphocytes and melanocytes) originate from single donors and were selected for our analysis, while the remaining samples are pooled DNA from several individuals, which makes them less suitable for analyzing inter-individual variation. For clarity, all results presented in this article are based on CD4+ T lymphocyte data. Comparable results were obtained for the other two tissues as well as for the cross-tissue comparison of all 10 samples (data not shown).
The raw data were downloaded from http://www.sanger.ac.uk/PostGenomics/epigenome/. To prepare for further analysis, the different record types (‘analysis’, ‘trace’ and ‘variation’) were merged by their identifiers, and records corresponding to technical controls were discarded. The analysis described here is based on the second technical replicate, which contains more valid data than the first technical replicate. Averaging of the two replicates was not an option because of incomplete overlap, but the analyses described in this article were repeated on the first replicate and comparable results were obtained. Amplicons with insufficient data were removed, giving rise to a dataset of 1705 amplicons. These amplicons are on average 287 bp long (first to last assessed CpG) with an SD of 85 bp, and they comprise 16 CpGs, on average. The majority (58%) of the amplicons overlap with CpG islands according to the Gardiner–Garden criteria (3) with repeat-masking and a quarter (25%) overlap with more stringent bona fide CpG islands (4).
Statistical analysis of DNA methylation variation among healthy individuals
Three complementary measures of inter-individual variation between DNA methylation profiles are used in this study (defined below): (i) pairwise deviation between high-resolution profiles, (ii) deviation between mean and high-resolution profile and (iii) pairwise deviation between means. These measures are calculated from pairwise comparisons between DNA methylation profiles of non-identical individuals, which are averaged separately for each amplicon in the dataset. In the pairwise comparisons, the root mean square deviation (RMSD) is used to assess deviations between DNA methylation profiles of different individuals. The RMSD is more appropriate for this purpose than the Pearson correlation coefficient (which is the other popular measure of similarity/deviation) because DNA methylation levels are frequently constant within an amplicon, in which case their SD becomes zero and the correlation coefficient is undefined.
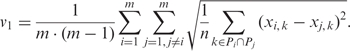
The pairwise deviation between high-resolution profiles (v1) compares DNA methylation levels at every single CpG, thereby assessing how similar or different DNA methylation profiles from unrelated individuals are at a given amplicon. This measure is defined by the following formula (calculated separately for each amplicon), in which m is the number of samples from different individuals, Pi and Pj are sets of CpG positions with valid measurements for samples i and j, respectively, xi, k and xj, k are the methylation levels measured at position k in samples i and j, respectively, and n is the number of positions in common between Pi and Pj:
 |
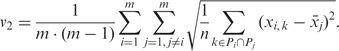
The deviation between mean and high-resolution profile (v2) compares the mean methylation level of one individual to the high-resolution DNA methylation profile of other individuals, thereby assessing how predictive the mean amplicon methylation of one individual is for the DNA methylation profile of unrelated individuals. This measure is defined by the following formula, in which one DNA methylation profile is replaced by its mean 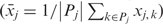 :
:
 |
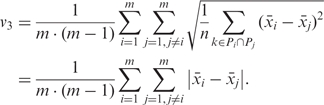
The pairwise deviation between means (v3) compares the mean amplicon methylation levels between a set of individuals, ignoring the sequential order of methylated and unmethylated CpGs. It is defined by replacing the remaining DNA methylation profile in formula v2 by its mean 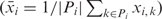 , giving rise to a formula that can be simplified to the mean absolute differences between unrelated individuals:
 |
These three measures of inter-individual variation were calculated for each valid amplicon in the HEP dataset. Based on these data, we sought to derive a threshold on DNA methylation that separates two distinct groups of amplicons (high versus low methylation) such that the between-group differences in terms of the three measures of inter-individual variation are high. To that end, 99 potential thresholds were assessed (splitting the dataset after each integer percentile) and the suitability of each was tested using Multivariate ANalysis of VAriance (MANOVA). Briefly, MANOVA (16) finds the linear combination of the three measures that is most discriminative between the two amplicon groups (i.e. between those amplicons exceeding the DNA methylation threshold and those falling below the threshold), and it assesses the significance of this difference. Supplementary Figure 1A shows a plot of the corresponding F-statistic and Supplementary Figure 1B shows the DNA methylation histogram. Based on these two diagrams, it seems plausible to split the groups at the 25th percentile, corresponding to an 11.5% threshold on the amplicon's DNA methylation average. In terms of their characteristics of inter-individual variation, the amplicons below this threshold (first quartile or top-25% of most unmethylated amplicons) are strikingly distinct from the remaining amplicons (P ≪ 10−10).
In silico benchmarking of experimental methods for DNA methylation mapping
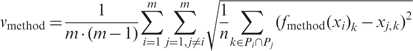
To benchmark experimental methods for DNA methylation mapping in silico, we introduce the following modification of the v1 measure of inter-individual variation. The first DNA methylation profile is pre-processed by a function that simulates experimental analysis, and this pre-processed profile is compared with the second profile (all simulation functions are defined and explained in Table 1, and an illustrative example is given in Supplementary Figure 2). This way, we can assess how well the simulated measurement for a particular experimental method predicts the high-resolution DNA methylation profile of other individuals. Formally, these new criteria vmethod (one per simulation function) are defined by the following formula, in which xi is the vector of methylation levels of sample i at positions Pi, fmethod is the simulation function and method is any of the identifiers in Table 1, rightmost column (i.e. A1–G7):
 |
While this formula is a straightforward extension of the described measures of inter-individual variation, the choice of simulation functions in Table 1 may warrant further discussion. Each simulation function computes the expected DNA methylation measurement for a specific experimental method on an amplicon with known methylation profile. The simulation functions are modeled after the known mechanisms and experimental constraints of the underlying experimental methods. Different variants of the same method are included in order to assess the sensitivity to different experimental conditions. When constructing these simulation functions, we relied not only on our own practical experiences and on literature research, but also consulted with domain experts within the EU Network of Excellence ‘The Epigenome’, in order to verify that the design of the rules and the choice of parameters were appropriately modeling the experiment under optimal conditions. In addition, we validated that the sensitivity of our results to the choice of parameters was generally low (see Results section). Therefore, while a comprehensive empirical evaluation is not feasible in the absence of a large-scale experimental benchmarking dataset, we conclude that the rules in Table 1 are sufficiently accurate and reliable for the purposes of this study.
Table 1.
Functions for simulating experimental methods of DNA methylation mapping in silico
| Method name | References | Method type | Comment | Simulation function |
|---|---|---|---|---|
| Differential methylation hybridization (DMH) | Huang et al. (28) Khulan et al. (29) Pfister et al. (30) | Methylation-specific fodigestion, qualitative | Quantification is difficult due to different oligomer affinities and DNA melting temperatures |
|
| Sequencing of methylation- specific digestion products | Rollins et al. (31) | Methylation-specific digestion, quantitative | Quantification is possible if sequencing depth is high |
|
| Methyl-DNA immunoprecipitation plus tiling microarrays (MeDIP-chip) | Weber et al. (32) Weber et al. (23) Zhang et al. (33) Zilberman et al. (34) | Immunoprecipitation, qualitative | Quantification is difficult due to different oligomer affinities and DNA melting temperatures |
|
| Sequencing of MeDIP-generated DNA libraries (MeDIP-seq) | Established at several labs, e.g. at the Max Planck Institute for Molecular Genetics (H. Lehrach, personal communication) | Immunoprecipitation, quantitative | Quantification is possible if the enrichment is statistically corrected for local differences in CpG density |
|
| Microarray hybridization of bisulfite-converted DNA | Adorjan et al. (35) Gitan et al. (36) Kimura et al. (37) Yan et al. (38) | Bisulfite conversion, qualitative | Quantification has been attempted but is often unreliable |
|
| Direct sequencing of bisulfite-converted DNA | Eckhardt et al. (15) Lewin et al. (19) Rakyan et al. (39) | Bisulfite conversion, quantitative | Quantitative and applicable to either all CpGs of an amplicon (by Sanger sequencing) or to a subset (by primer extension or pyrosequencing) |
|
| Rule-based guess (for comparison as a negative control) | None | No DNA methylation data is taken into account | Worst-case baseline that any method should compare favorably with |
|
This table summarizes the experimental methods for DNA methylation mapping that are covered in this study, and it describes the functions that were constructed to simulate them in silico (rightmost column). The simulation functions are written in an abbreviated notation, as if-clauses, as profile statements or as value assignments. (i) For if-clause rules, a methylation constant named HiMeth is assigned to all CpGs in amplicons identified as high-methylation and a constant named LowMeth is assigned to all CpGs in low-methylation amplicons. We set HiMeth = 80.39% and LowMeth = 13.13%, which are the mean methylation levels of all amplicon that exceed or fall below 50% methylation, respectively, in the HEP dataset. (ii) For profile statements, a subset of CpGs that fulfill the condition in brackets are selected and the methylation values of all unselected CpGs are determined by interpolation or extrapolation. (iii) Value assignments are a special case of profile statements, in which no CpGs are selected and the methylation values of all CpGs are set to a constant value (MeanMeth = 56.91% for the HEP dataset). #CpGcondition stands for the number of CpGs in the amplicon that fulfill the condition. The source code implementing each of these rules is available on request (written in the Python programming language).
Bioinformatic analysis and prediction of DNA methylation variation among healthy individuals
For quantitative analysis and prediction of the improvement in accuracy achievable by high-resolution methylation mapping of a specific amplicon, we defined the high-resolution improvement h as the difference between the inter-individual deviation calculated for medium-resolution MeDIP (vD1) and high-resolution bisulfite sequencing (vF1), i.e.  . Amplicons with high values exhibit inter-individually similar DNA methylation patterns while amplicons with low values do not (but may still exhibit similar average methylation levels across individuals).
The EpiGRAPH web service (http://epigraph.mpi-inf.mpg.de/WebGRAPH/) was used to test a large number of genomic attributes for their ability to distinguish between amplicons with high versus low high-resolution improvement. To that end, two lists of amplicons (the top and the bottom quartile in terms of the high-resolution improvement) were uploaded into EpiGRAPH, and EpiGRAPH was used to test 845 genomic attributes for significant differences between the two lists. Significance was assessed by pairwise Wilcoxon tests, a global significance threshold of 5% was chosen and the highly conservative Bonferroni method was applied to correct for multiple testing. A more detailed description of the EpiGRAPH prediction pipeline is given elsewhere [(4, 7), and Bock et al., in preparation].
Linear regression models were constructed to predict the dependent variable h (high-resolution improvement) from different subsets of independent variables. Both forward selection and backward selection were used to identify the most appropriate combination of independent variables. The following independent variables were included in the analysis: mean and SD of amplicon methylation; GC content and CpG observed versus expected ratio, calculated as in the definition of CpG islands (3); the relative frequency of three DNA sequence patterns (CG, CA and GC); the percent overlap with traditional and bona fide CpG islands, based on a recent study that derived an improved annotation of CpG islands for the human genome (4); the degree of promoter activity derived from large-scale experimental data on transcription initiation events (17); and the degree of transcriptional activity derived from the frequency of overlap with human ESTs from GenBank. The first four of these attributes were calculated directly from the HEP dataset and all other attributes were calculated by the EpiGRAPH web service. All statistical analyses were performed using the R-statistics software (www.r-project.org/).
RESULTS
DNA methylation profiles show complex patterns of variation among healthy individuals
Toward a better understanding of DNA methylation variation in healthy individuals, we defined three measures of inter-individual variation and applied them to the HEP dataset (see Materials and Methods section for details). Each measure captures a different aspect of inter-individual variation. The pairwise deviation between high-resolution profiles assesses the deviation between DNA methylation profiles from different individuals by summing over methylation differences of individual CpGs. Its value is low when all profiles for an amplicon are similar in terms of both their overall DNA methylation levels and their DNA methylation patterns. The pairwise deviation between means measures inter-individual differences of the average amplicon methylation. Its value is low when all DNA profiles share a similar mean, irrespective of the exact distribution and sequential order of methylated and unmethylated CpGs. The deviation between mean and high-resolution profile is a hybrid of the other two measures. Its value is low when DNA methylation profiles show little deviation from the mean of other profiles. Figure 1 illustrates the different behavior of these measures for two amplicons with artificially designed DNA methylation profiles.
Figure 1.

DNA methylation variation among healthy individuals (schematic figure). This figure displays artificial DNA methylation data for two amplicons with two unrelated samples/profiles each, which were designed to illustrate the effect of the three measures of inter-individual variation used in this study. The typical amplicon with high overall methylation (blue profiles, top) has a relatively high pairwise deviation between means (v3) and a pairwise deviation between high-resolution profiles (v1) that is substantially lower than the deviation between mean and high-resolution profile (v2), which is reflected in a substantial correlation between the rising and falling of the DNA methylation profile curves over the length of the amplicon. In contrast, the typical amplicon with low overall methylation (red profiles, bottom) has a low pairwise deviation between means (v3) and similar values for pairwise deviation between high-resolution profiles (v1) and deviation between mean and high-resolution profile (v2), indicating that the fluctuations in the profiles are not inter-individually conserved and presumably random.
Using these three measures we analyzed whether the characteristics of inter-individual variation differ between amplicons with low versus high DNA methylation levels (Figure 2, left). The results show that—by all three measures—the inter-individual variation of DNA methylation is lower for unmethylated amplicons than for methylated amplicons. This effect is strongest for the pairwise deviation between means (61% reduction), but also highly significant for the other measures (P < 10−20 in all cases). This observation was not unexpected and could be explained by overlap with CpG islands, which are well-known to be stably unmethylated in a wide range of tissues. To test the role that CpG islands may play for this effect, we grouped amplicons by their overlap with bona fide CpG islands (4) and repeated the analysis (Figure 2, right). The results were similar, although the reduction of variance was less pronounced in the amplicons overlapping with bona fide CpG islands than in the experimentally unmethylated CpG islands. We also repeated this analysis using the Gardiner–Garden definition of CpG islands (3) and observe further dilution of the effect (Supplementary Figure 3), consistent with previous reports suggesting that traditional CpG island criteria give rise to a large number of false positives (4, 18).
Figure 2.

Effect of average amplicon methylation (left) and overlap with bona fide CpG islands (right) on inter-individual variation of DNA methylation. This figure shows the means of the three measures of DNA methylation variation as bar plots. In the left panel, values are reported separately for the top-25% most unmethylated amplicons with an average amplicon methylation of <11.5% (this threshold is motivated in the Materials and Methods section) and for the remaining 75% of amplicons. In the right panel, distinction is made between amplicons that overlap with a bona fide CpG island (4) and those that do not. In both cases, error bars represent 95% confidence intervals under the assumption of normal distribution and the P-values in the legends are based on two-sample, two-sided, t-tests between the group means for each measure.
Beyond these results, which confirm and quantify previous observations, we found a second major difference between methylated and unmethylated amplicons. For methylated amplicons (and also for amplicons outside CpG islands), the pairwise deviation between high-resolution profiles is substantially lower than the deviation between mean and high-resolution profile. In contrast, differences are small for unmethylated amplicons and for amplicons overlapping with bona fide CpG islands (Figure 2). Importantly, this is not a side effect of the smaller scope for variation available to amplicons that were selected by their low DNA methylation averages, which is shown by plotting the top-25% most highly unmethylated amplicons versus the top-25% most highly methylated amplicons (to which similar constraints apply) or the amplicons with an average methylation below 25% versus the amplicons with an average methylation above 75% (Supplementary Figure 4). In both cases, the difference of deviation between mean and high-resolution profile minus pairwise deviation between high-resolution profiles is consistently higher in methylated amplicons than in unmethylated amplicons.
These results indicate a qualitative difference in the characteristics of inter-individual variation of DNA methylation depending on the average level of DNA methylation and the CpG density (see Figure 1 for illustration). Methylated amplicons and amplicons outside CpG islands exhibit a high degree of inter-individual variation, but they also exhibit significant conservation of specific DNA methylation patterns between individuals, which is evident from the fact that the predictiveness across individuals increases when high-resolution profiles are compared. In contrast, in unmethylated amplicons and CpG islands the overall degree of inter-individual variation is substantially lower, but the high-resolution profile of one individual is not more predictive of other individuals’ DNA methylation than its mean methylation level. Hence, we can regard the DNA methylation patterns of methylated and CpG-poor amplicons as informative at high resolution, while the average methylation level may suffice to characterize DNA methylation at unmethylated amplicons and CpG islands.
In silico benchmarking shows that high-resolution methylation mapping is most informative outside CpG islands
The different characteristics of inter-individual variation have important implications for rational choice of experimental methods for DNA methylation mapping: High-resolution mapping (e.g. by bisulfite sequencing) would be required outside CpG islands, while methods that assess average methylation levels (e.g. MeDIP) were sufficient for CpG islands. To substantiate this conclusion, we conducted a comprehensive in silico benchmarking study of six widely used experimental methods for DNA methylation mapping. This benchmarking is based on the assumption that DNA methylation profiles are only informative to the degree to which they are conserved between individuals (see Discussion section for critical assessment), and it adheres to a straightforward protocol: For each amplicon in the HEP dataset and all pairs of (non-identical) DNA methylation profiles derived from different individuals, we compared how well a simulated measurement—calculated from the first profile—predicts the second DNA methylation profile. The key point is that the measurement derived from the first profile is calculated in a way that models the experimental characteristics of different methods for DNA methylation mapping (Table 1). For example, for method C2 (qualitative immunoprecipitation), an amplicon is considered methylated if more than three CpGs per 200 bp exhibit DNA methylation levels above 50%. For method B3 (quantitative analysis of HpaII methylation-sensitive restriction libraries), the simulated measurement is calculated by assigning the known methylation levels to all CpGs that overlap with the enzyme's recognition sites (CCGG), while the methylation levels of all remaining CpG dinucleotides are determined by interpolation or extrapolation. This way, the benchmarking assesses how accurately different experimental methods map inter-individually stable DNA methylation.
The results calculated over all amplicons (Figure 3) show that high-resolution mapping by bisulfite sequencing (method F1) gives rise to the lowest inter-individual deviation (vF1 = 0.164). Therefore, a substantial number of CpGs in the genome must exhibit inter-individually stable DNA methylation patterns, which can be detected only by high-resolution bisulfite sequencing. However, quantitative immunoprecipitation (method D1) follows relatively closely behind, with an average deviation that is 16% higher than that of bisulfite sequencing. Qualitative methods—which test whether the DNA methylation in a genomic region exceeds a specific threshold rather than measuring its exact value—tend to perform worse than quantitative methods. The best one (method E3) results in an average deviation that is 36% worse than that of bisulfite sequencing. This, however, is still substantially better than random guessing (method G7), which would lead to average deviations that are more than three times worse than for bisulfite sequencing. Two additional observations are worth highlighting. First, alternative rules for the same experimental method (listed in the same rows in Table 1) perform similarly. This is particularly evident for the method groups A1–A3, C1–C3, D1–D2 and E1–E3, indicating that our results are robust regarding the choice of parameters for these rules. Second, for those methods that interrogate several individual CpGs to assess an amplicon's methylation status, careful selection of representative CpGs can increase performance. For example, selecting the first and last CpG of an amplicon (method F7) or randomly selecting two CpGs (method F3) performs worse than the more representative selection of the two CpGs that are located most closely to positions one-third and two-thirds relative to the amplicon length (method F8).
Figure 3.

Benchmarking results for experimental mapping of DNA methylation. This figure displays the results of in silico benchmarking of different DNA methylation mapping methods for all amplicons. The y-axis shows vmethod values for all experimental methods included in this study (A1–F9, described in Table 1) and for seven negative controls, which are based on guessing rules rather than on experimental data (G1–G7, described in Table 1). The standard boxplot format is used (boxes show center quartiles, whiskers extend to the most extreme data point which is no more than 1.5 times the interquartile range from the box) and outliers are hidden.
Having established this in silico prediction setup, we could test our initial hypothesis that bisulfite sequencing (method F1) performs better than, for example, MeDIP (method D1), but does so only for amplicons that exhibit substantial methylation and do not overlap with CpG islands. The results strongly support our hypothesis (Supplementary Figures 5 and 6). For amplicons with substantial methylation (the same threshold is used as in Figure 2), as well as for amplicons that do not overlap with a bona fide CpG island, MeDIP performs almost 20% worse than bisulfite sequencing. In contrast, for amplicons overlapping with a bona fide CpG island the difference is less than 3%, and for the most unmethylated amplicons MeDIP performs even better than bisulfite sequencing (by 11%)—arguably because it averages out uninformative fluctuations.
The accuracy improvement of high-resolution methylation mapping can be predicted from the DNA sequence
Up to this point, we have used the overlap with bona fide CpG islands as a sequence-based criterion to discriminate amplicons for which measuring average methylation levels is sufficient from those requiring high-resolution mapping. However, a priori it is not clear that this criterion provides the most accurate discrimination. To put the identification of regions that benefit from high-resolution mapping onto a more systematic basis, we applied the following two-step process. First, we used the publicly available EpiGRAPH web service (http://epigraph.mpi-inf.mpg.de/WebGRAPH/) to obtain a broad basis of potentially predictive attributes. Second, for a selection of highly significant attributes from the EpiGRAPH analysis, we constructed linear regression models that quantitatively predict the high-resolution improvement, which we define as the difference between the inter-individual deviation for simulated medium-resolution MeDIP and simulated high-resolution bisulfite sequencing.
A total of 845 genomic attributes were included in the EpiGRAPH analysis, each belonging to one of the following attribute groups: DNA sequence, DNA structure, repetitive DNA, chromosome organization, evolutionary history, population variation, genes, regulatory regions, transcriptome, epigenome and chromatin structure. Of these attributes, 96 were found to be significantly different between amplicons with high versus low high-resolution improvement (Supplementary Table 1). We selected seven highly significant attributes for in-depth analysis, namely the relative frequency of the DNA sequence patterns CG, CA and GC, the percent overlap with traditional and bona fide CpG islands, a quantitative measure of promoter activity (CAGE tag frequency) and a quantitative measure of transcriptional activity (EST overlap frequency). Together with the mean and SD of amplicon methylation as well as the GC content and CpG observed versus expected ratio, this gave rise to a list of 11 independent variables, which we assessed for their potential as predictors of high-resolution improvement (the dependent variable). Initially, we calculated pairwise Pearson correlation coefficients between the independent and dependent variables (Table 2), highlighting substantial correlation not only between the independent and dependent variables, but also among the independent variables.
Table 2.
Correlation between high-resolution improvement and its potential predictors
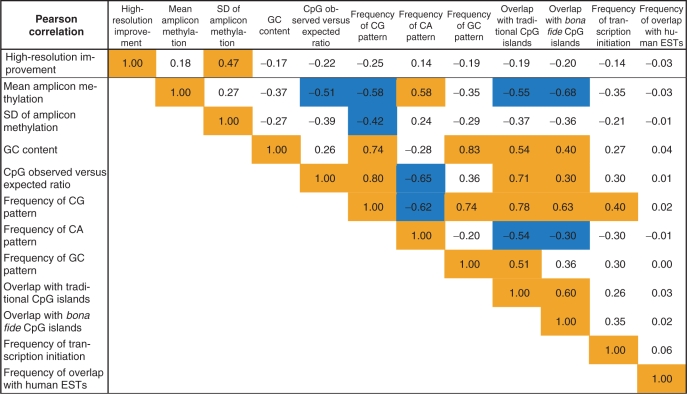 |
This table displays pairwise Pearson correlation coefficients for the accuracy improvement of high-resolution methylation mapping (first row) and several potential factors of influence. Orange (light) boxes mark strong positive correlation and blue (dark) boxes mark strong negative correlation.
We therefore used the statistical framework of linear regression to control for correlations among the independent variables and to derive a prediction model for the high-resolution improvement. Using feature selection (both forward and backward selection gave the same results), we determined the optimal combination of independent variables, and the following regression model was calculated as an optimal linear predictor of high resolution improvement:
In this formula, hi stands for the high-resolution improvement of amplicon i, ai is the SD of amplicon methylation, bi the GC content, ci the CpG observed versus expected ratio and di the percent overlap with traditional CpG islands (calculated on the repeat-masked genome). This regression model gives rise to a residual standard error of SE = 0.0611 and an adjusted correlation coefficient of r = 0.48, and is highly significant (P < 10−10). Supplementary Figure 7 shows a scatter plot comparing the model's prediction with the observed high-resolution improvement, indicating that the prediction accuracy is high for low values of hi and decreases substantially for high values of hi, due to high variance among the observed values.
Prediction of high-resolution improvement facilitates cost-efficient DNA methylation mapping
Finally, we asked whether prediction models could be used prospectively, to help decide which amplicons require high-resolution analysis (e.g. by bisulfite sequencing) and for which amplicons it would be sufficient to measure their average methylation level (e.g. by cost-efficient MeDIP analysis). We stipulated that the second alternative would be acceptable and sufficient only if the risk is less than 5% that a substantial loss of accuracy is incurred for a specific amplicon. Based on Lewin et al. (19), who report a mean absolute error of 14 percentage points for CpG methylation levels determined by bisulfite sequencing, we speak of a substantial loss of accuracy if the high-resolution improvement exceeds 0.14.
The goal then was to predictively identify as many amplicons as possible that exhibit a low high-resolution improvement, while not exceeding a false positive rate of 5%. To that end, we derived a new linear regression model that does not include the SD of amplicon methylation (this value is typically unknown when planning experimental mapping of DNA methylation). After feature selection, the following regression model was obtained:  , in which ei stands for the relative frequency of sequence pattern CA, fi for the percent overlap with bona fide CpG islands and the other variables are as above. The accuracy of this model is lower than the previous one (SE = 0.0671 and r = 0.26), but it is still highly significant (P < 10−10). Next, the threshold on the predicted high-resolution improvement was chosen such that no more than 5% of amplicons below this threshold exhibit an observed high-resolution improvement of 0.14. This calculation resulted in a threshold value of 0.0358, selecting 1118 out of 1705 amplicons (65.6%) for which high-resolution analysis is highly unlikely to provide substantially improved accuracy over (cheaper) analysis of average methylation levels.
DISCUSSION
This study analyzes inter-individual stability and variation of DNA methylation profiles among healthy individuals. Using statistical methods we could show that the DNA methylation state of CpG-rich regions is exhaustively characterized by their average methylation levels, while high-resolution DNA methylation patterns are informative only in regions with low CpG density (high-resolution patterns are considered informative if they improve prediction accuracy when comparing DNA methylation across individuals). A plausible biological explanation would be that above a critical CpG density, neighboring CpGs influence each other's DNA methylation states so strongly that individual CpGs cannot stably maintain DNA methylation states deviating from those of their neighbors. Biochemically, this could be achieved by methylation-specific enhancement or repression of DNA methyltransferase activity, a mechanism that has been proposed to contribute to spreading of DNA methylation (20). In contrast, individual CpGs in CpG-poor regions lack this pressure from neighboring CpGs, and other effects—such as the local DNA sequence environment (21) or transcription factor binding (22)—are likely to determine their DNA methylation states. From a systems point of view, we suggest that CpG islands may act as emergent and bistable epigenetic switches, in which multiple CpGs collectively maintain a CpG-island-wide ‘on’ or ‘off’ state. This concept is consistent with experimental data, including the bimodal distribution of promoter methylation observed in normal cells (23) and the fact that entire CpG islands, rather than single CpGs, become aberrantly methylated in cancer (24). It is also supported by two recent in silico studies, which showed that co-operativity among neighboring CpGs (25) or spatially close nucleosomes (26) is required for a genomic region to function as a bistable epigenetic switch.
Based on our statistical results, we also considered the practical implications for experimental analysis of DNA methylation. Through the combination of computational simulation and benchmarking across unrelated individuals, we could show that in CpG-poor genomic regions, high-resolution methods such as bisulfite sequencing perform substantially better than medium-resolution methods such as MeDIP. In contrast, both methods perform similarly for CpG-rich genomic regions and CpG islands, owing to high fluctuation of the sequential order of methylated and unmethylated CpGs in these regions. We derived a linear classifier for predicting which genomic regions benefit from bisulfite sequencing and for which regions MeDIP is sufficient. To highlight the potential cost savings arising from these results, we briefly sketch how the classifier could influence a HEP-like project planned today: Assume that half of the total project costs are variable and proportional to the number of amplicons analyzed. Furthermore, assume that it is four times as expensive to assess all CpGs in an amplicon (by Sanger sequencing of bisulfite-converted DNA) than to assess an amplicon's average methylation level (e.g. by MeDIP). Our predictions would enable us to apply cheap methods to roughly two-thirds (65.6%) of all HEP amplicons (see Results section), such that only 5% of these would have benefited significantly from costly high-resolution analysis (i.e. the high-resolution improvement would be <0.14 for 95% of all amplicons). This would give rise to savings of 25% in terms of overall project costs, compared with the indiscriminate high-resolution strategy used in the HEP. Alternatively, these savings would permit the analysis of 50% more samples at the same overall project costs (assuming that non-proportional costs are unaffected by the increased throughput).
It is, however, important to keep several limitations of our analysis in mind. First, all results are currently based on a single, albeit large, dataset and should be further validated on data obtained in different labs, potentially with different methods and for a larger number of samples. Second, because the HEP dataset was generated using direct sequencing rather than sequencing of clones, we were unable to assess the degree of variation within a single sample. Third, because the HEP dataset uses only a single sample per individual, we cannot exclude that a substantial percentage of the observed inter-individual differences may also be present between different samples of the same individual, e.g. as a result of tissue heterogeneity. Fourth, our simulation rules compute the expected DNA methylation measurement under optimal conditions, ignoring aspects such as robustness with respect to varying DNA quality or minor variation in the experimental protocol. Hence, the benchmarking results should be regarded as principal limitations rather than concrete technical limitations for a particular protocol and lab. Fifth, our assumption that those high-resolution DNA methylation patterns fluctuating randomly between unrelated individuals are uninformative and can be replaced by their mean holds true only when the goal is to make generalizable claims about DNA methylation patterns in a particular genomic region. This is obviously the case in large-scale epigenome projects aimed at the establishment of references maps of DNA methylation, and also for most cancer epigenetics and biomarker discovery projects. However, this assumption is less appropriate when analyzing epigenetic regulation in a single cell: a single methylated CpG may well be functional, e.g. preventing a transcription factor from binding to the DNA, even if it is not inter-individually conserved.
These limitations notwithstanding, our results provide a first quantitative basis for strategic decision making in large-scale DNA methylation mapping. Combining all of our observations, we propose the following cost-optimized two-track strategy for mammalian methylome projects: On the one hand, DNA methylation at all CpG islands (or more accurately: at all CpG-rich regions predicted by the classifier that is described in the Results section) should be analyzed in a large number of individuals, in order to quantify the degree of epigenetic variation within human populations. For these experiments, a cost-efficient medium-resolution method such as MeDIP is sufficient, since our results show that the methylation state of CpG islands is exhaustively characterized by their average methylation levels. On the other hand, in a smaller number of individuals the entire genome—consisting mostly of CpG-poor regions—should be analyzed by high-throughput bisulfite sequencing (27), in order to provide a basis for assessing which of these CpGs play a functional role in gene regulation or chromatin structure formation. This two-track strategy contrasts with the naïve approach of mapping DNA methylation at high resolution where CpG density is high and at low resolution where their density is low, which underlines the relevance of computational analysis for informed planning of epigenome projects.
SUPPLEMENTARY DATA
Supplementary Data are available at NAR Online.
ACKNOWLEDGEMENTS
We would like to thank Jörn Lewin for help with the data format used by the Human Epigenome Project, Florian Eckhardt, Vardhman Rakyan and Jörg Rahnenführer for interesting discussions and Joachim Büch as well as Konstantin Halachev for technical support. Furthermore, we acknowledge the advice from multiple researchers involved in the EU Network of Excellence ‘The Epigenome’, which proved very helpful when devising realistic rules for simulating experimental DNA methylation mapping in silico. This work was conducted within the context of the EU Network of Excellence ‘Biosapiens’ (LSHG-CT-2003-503265) and the EU Network of Excellence ‘The Epigenome’ (LSHG-CT-2004-503433). Funding to pay the Open Access publication charges for this article was provided by the Max Planck Society.
Conflict of interest statement. None declared.
REFERENCES
- 1.Bird A. DNA methylation patterns and epigenetic memory. Genes Dev. 2002;16:6–21. doi: 10.1101/gad.947102. [DOI] [PubMed] [Google Scholar]
- 2.Weber M, Schübeler D. Genomic patterns of DNA methylation: targets and function of an epigenetic mark. Curr. Opin. Cell Biol. 2007;19:273–280. doi: 10.1016/j.ceb.2007.04.011. [DOI] [PubMed] [Google Scholar]
- 3.Gardiner-Garden M, Frommer M. CpG islands in vertebrate genomes. J. Mol. Biol. 1987;196:261–282. doi: 10.1016/0022-2836(87)90689-9. [DOI] [PubMed] [Google Scholar]
- 4.Bock C, Walter J, Paulsen M, Lengauer T. CpG island mapping by epigenome prediction. PLoS Comput. Biol. 2007;3:e110. doi: 10.1371/journal.pcbi.0030110. [DOI] [PMC free article] [PubMed] [Google Scholar]
- 5.Reik W. Stability and flexibility of epigenetic gene regulation in mammalian development. Nature. 2007;447:425–432. doi: 10.1038/nature05918. [DOI] [PubMed] [Google Scholar]
- 6.Feinberg AP. Phenotypic plasticity and the epigenetics of human disease. Nature. 2007;447:433–440. doi: 10.1038/nature05919. [DOI] [PubMed] [Google Scholar]
- 7.Bock C, Paulsen M, Tierling S, Mikeska T, Lengauer T, Walter J. CpG island methylation in human lymphocytes is highly correlated with DNA sequence, repeats and predicted DNA structure. PLoS Genet. 2006;2:e26. doi: 10.1371/journal.pgen.0020026. [DOI] [PMC free article] [PubMed] [Google Scholar]
- 8.Das R, Dimitrova N, Xuan Z, Rollins RA, Haghighi F, Edwards JR, Ju J, Bestor TH, Zhang MQ. Computational prediction of methylation status in human genomic sequences. Proc. Natl Acad. Sci. USA. 2006;103:10713–10716. doi: 10.1073/pnas.0602949103. [DOI] [PMC free article] [PubMed] [Google Scholar]
- 9.Fang F, Fan S, Zhang X, Zhang MQ. Predicting methylation status of CpG islands in the human brain. Bioinformatics. 2006;22:2204–2209. doi: 10.1093/bioinformatics/btl377. [DOI] [PubMed] [Google Scholar]
- 10.Bernstein BE, Meissner A, Lander ES. The mammalian epigenome. Cell. 2007;128:669–681. doi: 10.1016/j.cell.2007.01.033. [DOI] [PubMed] [Google Scholar]
- 11.Bock C, Lengauer T. Computational epigenetics. Bioinformatics. 2008;24:1–10. doi: 10.1093/bioinformatics/btm546. [DOI] [PubMed] [Google Scholar]
- 12.Peaston AE, Whitelaw E. Epigenetics and phenotypic variation in mammals. Mamm. Genome. 2006;17:365–374. doi: 10.1007/s00335-005-0180-2. [DOI] [PMC free article] [PubMed] [Google Scholar]
- 13.Wong AH, Gottesman II, Petronis A. Phenotypic differences in genetically identical organisms: the epigenetic perspective. Hum. Mol. Genet. 2005;14:R11–R18. doi: 10.1093/hmg/ddi116. [DOI] [PubMed] [Google Scholar]
- 14.Mikeska T, Bock C, El-Maarri O, Hübner A, Ehrentraut D, Schramm J, Felsberg J, Kahl P, Büttner R, et al. Optimization of quantitative MGMT promoter methylation analysis using pyrosequencing and combined bisulfite restriction analysis. J. Mol. Diagn. 2007;9:368–381. doi: 10.2353/jmoldx.2007.060167. [DOI] [PMC free article] [PubMed] [Google Scholar]
- 15.Eckhardt F, Lewin J, Cortese R, Rakyan VK, Attwood J, Burger M, Burton J, Cox TV, Davies R, et al. DNA methylation profiling of human chromosomes 6, 20 and 22. Nat. Genet. 2006;38:1378–1385. doi: 10.1038/ng1909. [DOI] [PMC free article] [PubMed] [Google Scholar]
- 16.Tabachnick BG, Fidell LS. Using Multivariate Statistics. 5th. Boston: Pearson/Allyn & Bacon; 2007. [Google Scholar]
- 17.Carninci P, Sandelin A, Lenhard B, Katayama S, Shimokawa K, Ponjavic J, Semple CA, Taylor MS, Engström PG, et al. Genome-wide analysis of mammalian promoter architecture and evolution. Nat. Genet. 2006;38:626–635. doi: 10.1038/ng1789. [DOI] [PubMed] [Google Scholar]
- 18.Shen L, Kondo Y, Guo Y, Zhang J, Zhang L, Ahmed S, Shu J, Chen X, Waterland RA, et al. Genome-wide profiling of DNA methylation reveals a class of normally methylated CpG island promoters. PLoS Genet. 2007;3:2023–2036. doi: 10.1371/journal.pgen.0030181. [DOI] [PMC free article] [PubMed] [Google Scholar]
- 19.Lewin J, Schmitt AO, Adorjan P, Hildmann T, Piepenbrock C. Quantitative DNA methylation analysis based on four-dye trace data from direct sequencing of PCR amplificates. Bioinformatics. 2004;20:3005–3012. doi: 10.1093/bioinformatics/bth346. [DOI] [PubMed] [Google Scholar]
- 20.Turker MS. Gene silencing in mammalian cells and the spread of DNA methylation. Oncogene. 2002;21:5388–5393. doi: 10.1038/sj.onc.1205599. [DOI] [PubMed] [Google Scholar]
- 21.Handa V, Jeltsch A. Profound flanking sequence preference of Dnmt3a and Dnmt3b mammalian DNA methyltransferases shape the human epigenome. J. Mol. Biol. 2005;348:1103–1112. doi: 10.1016/j.jmb.2005.02.044. [DOI] [PubMed] [Google Scholar]
- 22.Xu J, Pope SD, Jazirehi AR, Attema JL, Papathanasiou P, Watts JA, Zaret KS, Weissman IL, Smale ST. Pioneer factor interactions and unmethylated CpG dinucleotides mark silent tissue-specific enhancers in embryonic stem cells. Proc. Natl Acad. Sci. USA. 2007;104:12377–12382. doi: 10.1073/pnas.0704579104. [DOI] [PMC free article] [PubMed] [Google Scholar]
- 23.Weber M, Hellmann I, Stadler MB, Ramos L, Pääbo S, Rebhan M, Schübeler D. Distribution, silencing potential and evolutionary impact of promoter DNA methylation in the human genome. Nat. Genet. 2007;39:457–466. doi: 10.1038/ng1990. [DOI] [PubMed] [Google Scholar]
- 24.Laird PW. Cancer epigenetics. Hum. Mol. Genet. 2005;14:R65–R76. doi: 10.1093/hmg/ddi113. [DOI] [PubMed] [Google Scholar]
- 25.Sontag LB, Lorincz MC, Luebeck EG. Dynamics, stability and inheritance of somatic DNA methylation imprints. J. Theor. Biol. 2006;242:890–899. doi: 10.1016/j.jtbi.2006.05.012. [DOI] [PubMed] [Google Scholar]
- 26.Dodd IB, Micheelsen MA, Sneppen K, Thon G. Theoretical analysis of epigenetic cell memory by nucleosome modification. Cell. 2007;129:813–822. doi: 10.1016/j.cell.2007.02.053. [DOI] [PubMed] [Google Scholar]
- 27.Meissner A, Gnirke A, Bell GW, Ramsahoye B, Lander ES, Jaenisch R. Reduced representation bisulfite sequencing for comparative high-resolution DNA methylation analysis. Nucleic Acids Res. 2005;33:5868–5877. doi: 10.1093/nar/gki901. [DOI] [PMC free article] [PubMed] [Google Scholar]
- 28.Huang TH, Perry MR, Laux DE. Methylation profiling of CpG islands in human breast cancer cells. Hum. Mol. Genet. 1999;8:459–470. doi: 10.1093/hmg/8.3.459. [DOI] [PubMed] [Google Scholar]
- 29.Khulan B, Thompson RF, Ye K, Fazzari MJ, Suzuki M, Stasiek E, Figueroa ME, Glass JL, Chen Q, et al. Comparative isoschizomer profiling of cytosine methylation: the HELP assay. Genome Res. 2006;16:1046–1055. doi: 10.1101/gr.5273806. [DOI] [PMC free article] [PubMed] [Google Scholar]
- 30.Pfister S, Schlaeger C, Mendrzyk F, Wittmann A, Benner A, Kulozik A, Scheurlen W, Radlwimmer B, Lichter P. Array-based profiling of reference-independent methylation status (aPRIMES) identifies frequent promoter methylation and consecutive downregulation of ZIC2 in pediatric medulloblastoma. Nucleic Acids Res. 2007;35:e51. doi: 10.1093/nar/gkm094. [DOI] [PMC free article] [PubMed] [Google Scholar]
- 31.Rollins RA, Haghighi F, Edwards JR, Das R, Zhang MQ, Ju J, Bestor TH. Large-scale structure of genomic methylation patterns. Genome Res. 2006;16:157–163. doi: 10.1101/gr.4362006. [DOI] [PMC free article] [PubMed] [Google Scholar]
- 32.Weber M, Davies JJ, Wittig D, Oakeley EJ, Haase M, Lam WL, Schübeler D. Chromosome-wide and promoter-specific analyses identify sites of differential DNA methylation in normal and transformed human cells. Nat. Genet. 2005;37:853–862. doi: 10.1038/ng1598. [DOI] [PubMed] [Google Scholar]
- 33.Zhang X, Yazaki J, Sundaresan A, Cokus S, Chan SW, Chen H, Henderson IR, Shinn P, Pellegrini M, et al. Genome-wide high-resolution mapping and functional analysis of DNA methylation in arabidopsis. Cell. 2006;126:1189–1201. doi: 10.1016/j.cell.2006.08.003. [DOI] [PubMed] [Google Scholar]
- 34.Zilberman D, Gehring M, Tran RK, Ballinger T, Henikoff S. Genome-wide analysis of Arabidopsis thaliana DNA methylation uncovers an interdependence between methylation and transcription. Nat. Genet. 2007;39:61–69. doi: 10.1038/ng1929. [DOI] [PubMed] [Google Scholar]
- 35.Adorjan P, Distler J, Lipscher E, Model F, Müller J, Pelet C, Braun A, Florl AR, Gutig D, et al. Tumour class prediction and discovery by microarray-based DNA methylation analysis. Nucleic Acids Res. 2002;30:e21. doi: 10.1093/nar/30.5.e21. [DOI] [PMC free article] [PubMed] [Google Scholar]
- 36.Gitan RS, Shi H, Chen CM, Yan PS, Huang TH. Methylation-specific oligonucleotide microarray: a new potential for high-throughput methylation analysis. Genome Res. 2002;12:158–164. doi: 10.1101/gr.202801. [DOI] [PMC free article] [PubMed] [Google Scholar]
- 37.Kimura N, Nagasaka T, Murakami J, Sasamoto H, Murakami M, Tanaka N, Matsubara N. Methylation profiles of genes utilizing newly developed CpG island methylation microarray on colorectal cancer patients. Nucleic Acids Res. 2005;33:e46. doi: 10.1093/nar/gni046. [DOI] [PMC free article] [PubMed] [Google Scholar]
- 38.Yan PS, Wei SH, Huang TH. Methylation-specific oligonucleotide microarray. Methods Mol. Biol. 2004;287:251–260. doi: 10.1385/1-59259-828-5:251. [DOI] [PubMed] [Google Scholar]
- 39.Rakyan VK, Hildmann T, Novik KL, Lewin J, Tost J, Cox AV, Andrews TD, Howe KL, Otto T, et al. DNA methylation profiling of the human major histocompatibility complex: a pilot study for the human epigenome project. PLoS Biol. 2004;2:e405. doi: 10.1371/journal.pbio.0020405. [DOI] [PMC free article] [PubMed] [Google Scholar]
Associated Data
This section collects any data citations, data availability statements, or supplementary materials included in this article.