

Abstract
We identified the most frequent, variable-length DNA sequence motifs in the human and mouse genomes and sub-selected those with multiple recurrences in the intergenic and intronic regions and at least one additional exonic instance in the corresponding genome. We discovered that these motifs have virtually no overlap with intronic sequences that are conserved between human and mouse, and thus are genome-specific. Moreover, we found that these motifs span a substantial fraction of previously uncharacterized human and mouse intronic space. Surprisingly, we found that these genome-specific motifs are over-represented in the introns of genes belonging to the same biological processes and molecular functions in both the human and mouse genomes even though the underlying sequences are not conserved between the two genomes. In fact, the processes and functions that are linked to these genome-specific sequence-motifs are distinct from the processes and functions which are associated with intronic regions that are conserved between human and mouse. The findings show that intronic regions from different genomes are linked to the same processes and functions in the absence of underlying sequence conservation. We highlight the ramifications of this observation with a concrete example that involves the microsatellite instability gene MLH1.
INTRODUCTION
Most of the searches for regulatory sequences have operated on the premise that functional motifs ought to be conserved across orthologous sequences (1–7). This cross-species conservation constraint has frequently proven to be a sufficient condition for the identification of regulatory regions. However, there is increasing evidence that such a prerequisite may not be necessary (8–12). Of late, the search for putative regulatory sequences has extended to introns: even though they were predicted to harbor regulatory signals (13,14) some of which were subsequently discovered (2,11,15–25), the true significance of introns remains elusive. The more recent interest in introns has been fueled in part by the discovery in them of microRNA precursors that may not always engage the canonical microRNA pathway (23,26).
Parallel work has begun revealing a complex picture of the organization and functional richness of genomes. Arguably, the ENCODE project provided the latest major discoveries along those lines. In particular, it was found that the human genome is massively transcribed in a complex manner (27–29). Following this and related work, it is now clear that eukaryotic genomes must contain more functional elements than previously estimated.
Human genome regions can be classified into three broad categories with respect to the extent of their evolutionary conservation and their coding potential: (a) sequences that are under strong evolutionary constraints and represent ∼5% of the human genome (18,22); (b) conserved non-exonic sequences that are more frequent than expected (30) but do not necessarily comprise functional elements (31); and (c) non-conserved, non-exonic sequences, a category with an unexpected high number of functional elements (29). Adding to this complex landscape, several repeat element fragments appear to undergo strong purifying selection and to be exapted into functional elements (1,20,32–35). Moreover, conserved non-exonic regions with repetitive origins appear near developmental genes suggesting that mobile elements may play a role in gene regulation (32), whereas a special class of fairly long stretches of DNA, termed ultraconserved elements, have been found to be exceptionally well conserved across several genomes (2).
In this discussion, we present results from our exploration of intronic space in the human and mouse genomes. We analyzed human and mouse intronic sequences using ‘pyknons’ as our tool; pyknons are previously described sets of very frequent genome-specific DNA sequence motifs that were shown to have a number of interesting and functionally meaningful properties (11,36). The analysis that follows shows that pyknons span a substantial fraction of previously uncharacterized intronic space. Additionally, as a set, pyknons are distinct from repeat elements. The notable finding of the analysis presented below is that in both the human and mouse genomes these very frequent motifs are over-represented in the introns of genes belonging to the same set of biological processes and molecular functions, even though the underlying sequences are not conserved. Moreover, the intronic instances of these motifs are linked to processes and functions that do not overlap with the processes and functions which are linked to intronic regions that are conserved between human and mouse. Finally, we show that a subset of the pyknons co-localizes extensively with human and mouse piRNAs (37,38) inside human and mouse intronic sequences respectively. The presentation concludes with a discussion of the potential relevance of these findings in the disease context by analyzing the introns of the microsatellite instability gene MLH1. Our results suggest that extended regions of human and mouse introns are involved in conserved functional links that do not depend on underlying sequence conservation.
METHODS
Data sources
We obtained human and mouse chromosomal sequences and genomic region coordinates for transcripts, exons, 5′UTRs, CDSs and 3′UTRs as well as GO annotations from ENSEMBL release 42. Human/mouse pairwise alignments and repeat regions corresponding to the same genome assembly version (NCBI36) were obtained with the help of the UCSC Genome Browser. The human and mouse piRNA sequences were obtained from the supplementary material of previous work (37,38).
Computing the pyknon sets
Pyknons were recomputed to reflect changes from ENSEMBL Release 39 to Release 42 (39). For this, we used the parallel version of a pattern discovery algorithm that we developed earlier (40). The input comprised the intergenic and intronic sequences of the human and mouse genomes respectively but excluded intergenic and intronic segments that were the reverse complement of the 5′ untranslated, amino acid coding or 3′ untranslated regions of some human gene; more details can be found elsewhere (11). This exclusion ensures that any discovered patterns are not connected to the sequences of known genes, protein motifs or domains, or to the reverse complement of such sequences. The pattern discovery algorithm that we used for this analysis requires the setting of three parameters: L, W and K. The parameter L controls the minimum possible size of the discovered patterns but has no bearing on the patterns’ maximum length; the latter is not constrained in any way. The parameter W satisfies the inequality W ≥ L and controls the ‘degree of conservation’ across the various instances of the reported patterns: smaller (resp. larger) values of W will tolerate fewer (resp. more) mismatches across the instances. Since we are interested in only patterns with identically conserved instances, we set W = L (i.e. the discovered patterns contained no ‘wildcards’). The parameter K controls the minimum required number of appearances before a pattern can be reported by the algorithm. For a given choice of L, W and K the algorithm guarantees the reporting of all patterns that have K or more appearances in the processed input and are such that any L consecutive (but not necessarily contiguous) positions span at most W positions. Human and mouse pyknons were computed using L = 16, W = 16 and K = 30. These values of L and K ensure statistical significance (11).
Computing region overlaps
For any given pair of regions (for example pyknon and repeat regions), we computed their overlap by counting the number of positions in the genome belonging to both sets. All sequences were compared with one another in their 5′ → 3′ direction. As a preprocessing step, we converted each set of regions into a non-redundant set of non-overlapping sequences to avoid double-counting (e.g. different transcripts of the same gene, or genes that overlap). The probability of achieving a given overlap at random given the frequencies of the two sets was computed using the hypergeometric distribution.
Analyzing gene GO terms
For each gene, we computed: (i) its intronic sequence, i.e. the union of the introns of all of its transcripts, (ii) its associated GO term set, i.e. the union of the GO term sets associated with its transcripts and (iii) the concentration of pyknons, conserved elements and repeats in the gene's intronic sequence, i.e. the number of nucleotides of each type of region that lie inside the gene's intronic sequence, divided by the size of the intronic sequence. Concentration is defined as the fraction of the total intronic sequence of a given gene that is covered by a given set of elements, such as conserved regions, repeats, pyknons, or combinations thereof. We tested each GO term x separately for enrichment by comparing two distributions of concentrations: the distribution of concentrations of the genes that have term x on their list versus the distribution of concentrations of the genes that do not have x. First, we compared the distributions with a t-test statistic using Student's t-distribution as an approximation. In addition, we made use of random permutations and found that the generated results are in agreement with those that we obtained from the t-test analysis. This analysis yielded the initial P-values: using global random permutations we subsequently determined the appropriate P-value cutoff to ensure a 5% false discovery rate. Finally, a stability test confirmed that the low P-values were not due to the presence of a few extreme values of the distribution of concentrations.
Locating piRNA instances in introns
To locate piRNA instances or their reverse complements in intronic regions, we slide a window of size equal to each piRNA's length along these regions. For each placement of the window, the sequence of the piRNA (or its reverse complement) is compared to the underlying sequence substring and a similarity computed as the fraction of matching nucleotides. As pointed out earlier—see Supplementary Data 1 of (38), the pyrosequencing-derived piRNA sequences that were kept and reported contained less than or equal to two defects (≤∼5% error or ≥∼95% similarity) along the length of a read. Consequently, in our searches of intronic sequences, we permitted at most two nucleotide mismatches along the length of a piRNA. As control, we generated a shuffled version of the intronic regions and sought piRNA instances therein using the same exact criteria. The number of instances found in the shuffled intronic sequences provided an estimate for the expected number of false positives: at the 95% similarity threshold that we used, the false positive error rate was less than 0.00005 for both human and mouse.
RESULTS
We processed the sequences of the human and mouse genomes using the previously outlined pyknon discovery methodology—see Methods section as well as ref. (11)—and generated the corresponding pyknon sets. By definition, each pyknon is a recurrent motif whose sequence has a minimum length, a minimum number of intact copies in the intergenic and intronic regions of the genome, and at least one additional copy in an exonic region. The choices for minimum length (≥16 nucleotides) and minimum copy number (≥30 intact copies) ensure the pyknons’ statistical significance (11). It should be stressed that pyknons are discovered by processing a genome in isolation: consequently, their sequences are not necessarily conserved in other genomes or present in cross-species aligned sequences (11).
The human and mouse pyknon sets contain 209 432 and 128 064 members, respectively. These pyknons are predominantly short (∼16–17 nucleotides). Moreover, to the extent that it can be deduced using RNA folding programs, pyknons do not exhibit any characteristic secondary structure. With respect to composition, the pyknons’ A–T composition is essentially identical to that of the entire genome (A = 30.4%, C = 20.0%, G = 20.6% and T = 28.8% for the pyknons versus A = ∼29.5%, C = ∼20.5%, G = ∼20.5% and T = ∼29.5% for the human genome). Finally, as reported earlier (11), a large fraction of pyknons (∼75%) have at least 100 exact intergenic and/or intronic copies.
Intronic instances of pyknons are distinct from human-mouse conserved regions and from known repeat elements
In order to simplify the presentation, we introduce and define what we will refer to as the ‘intra-genomic conservation’ model. This genome-centered ‘conservation’ manifests itself in the form of sequence fragments with multiple, intact instances in the genome under consideration. These sequence fragments are assumed to have a minimum length and a minimum number of copies.
Figure 1 juxtaposes this ‘intra-genomic conservation’ model to the classical, ‘inter-genomic’ conservation model captured by cross-species alignments. In the latter model, an evolutionary relationship involving regions from at least two genomes is captured as a statistically significant sequence similarity that can be traced back to a presumed common evolutionary origin—shown as blue rectangles in Figure 1. The intra-genomic model generally involves much shorter regions (shown as green- or red-striped rectangles in Figure 1) that recur multiple times in a given genome but may not involve inter-genomically conserved sequences. Pyknons represent a special case of the intra-genomic model and involve the intergenic, intronic and exonic sequences of the same genome (11).
Figure 1.

We use a graphic involving two genomes (#1 and #2) to juxtapose the classical ‘inter-genomic’ or cross-species model of conservation with the ‘intra-genomic’ one that we introduced and defined in this presentation.
Do intra-genomically conserved pyknons arise in genomic neighborhoods that were not previously characterized? We addressed this by measuring (i) the extent of overlap between pyknon instances and cross-species conserved regions; and, (ii) the extent of overlap between pyknon instances and repeat regions. Since it is generally not the case that the set of pyknons contains both a sequence and its reverse complement, we computed this overlap by comparing all sequences in 5′ → 3′ direction).
Figure 2 shows, in the form of a pie chart, the decomposition of human and mouse introns in terms of conserved regions, repeats and pyknon instances. In order to ensure that the percentages of all regions sum up to 100%, we mark as conserved the regions that are exclusively conserved (i.e. both repeat-free and pyknon-free); we apply the same logic to the rest of the regions. The summarized findings of Figure 2 permit several observations regarding the intra-genomic conservation model. First, pyknons allow us to demarcate a significant fraction (7.4% in human and 4.4% in mouse) of the previously uncharacterized intronic space and to link it to one or more known exons (by virtue of the very definition of pyknons). Second, the pyknon instances have a strikingly low overlap with intronic regions that are conserved between human and mouse. The observed overlap of 0.7% in human and 0.4% in mouse is significantly lower than what would be expected by chance (=5.6% in human and 3.5% in mouse); the associated P-value is practically zero (see Methods section). Finally, Figure 2 shows that, in intronic space, pyknons are distinct from known human and mouse repeats and only partially overlap with them: as a result, a notable 7.4% of previously uncharacterized human and 4.4% of mouse intronic space is covered by pyknons that are non-conserved and do not overlap repeats in their 5′ → 3′ direction.
Figure 2.

Composition of human (A) and mouse (B) introns and the intra-genomic conservation model. Here, we have labeled as ‘conserved’ the regions that are exclusively conserved (i.e. they are repeat-free and pyknon-free), as ‘repeats’ the regions that are exclusively instances of repeats (i.e. they do not overlap conserved regions or pyknons), and as ‘pyknons’ the regions that are exclusively instances of pyknons (i.e. they are repeat-free and do not overlap conserved regions). Similarly, we have labeled as ‘conserved repeats’ the regions that are known repeats and conserved between human and mouse (but pyknon-free), and so on and so forth. It is clear from these two pie charts that the pyknons cover a substantial segment of the previously uncharacterized intronic sequence (shown in dark green in both cases). At the same time, pyknons exhibit very little overlap with sequences that are conserved between the human and mouse genomes (light green) and with sequences that correspond to repeat elements (pink). All sequence comparisons were done in the 5′ → 3′ direction. See also text for a discussion of these findings.
We next extended this decomposition analysis to the intergenic and exonic regions of human and mouse. The results are shown in Figure 3. For the exonic regions, we distinguished among 5′UTRs, CDSs, and 3′UTRs. The intronic decomposition from Figure 2 was included to facilitate comparison. It is evident that pyknons also demarcate a significant fraction of intergenic space that was previously uncharacterized and link it to known exons (as a result of the definition of pyknons). Moreover, in complete analogy with introns, the intergenic instances of pyknons generally do not overlap conserved intergenic regions and intergenic repeat elements. Again, all sequence comparisons are done in 5′→3′ direction. Not surprisingly, Figure 3 also shows that the exonic regions, particularly CDSs and 5′UTRs, behave very differently from the intergenic and intronic regions. Indeed, the CDS regions of exons are almost entirely conserved, and, as a fraction of the total exonic sequence, they are essentially free of repeats; moreover, pyknon instances are present in both conserved and non-conserved sequences. The abundance of non-conserved pyknons decreases from 3′UTRs to 5′UTRs to CDSs.
Figure 3.

Composition of intergenic and exonic regions in terms of conserved regions, repeat elements and pyknons for the human and mouse (bottom) genomes. For both genomes, we included the intronic decomposition of Figure 2 to facilitate comparison.
Figures 2 and 3 show that the intergenic and intronic regions spanned by pyknon instances are effectively different from those genomic sequences that are conserved between human and mouse or belong to known repeats. In fact, the three types of regions considered here (i.e. conserved, repeats and pyknons) are distinct from one another and largely non-overlapping. The pyknons delineate specific intergenic and intronic regions that are neither conserved between human and mouse nor parts of known and characterized repeats. Interestingly, the same holds true for the 3′UTRs of protein-coding genes. On the other end of the spectrum, the coding regions of the exons are almost entirely conserved between human and mouse (even their pyknon sequences lie inside conserved regions) and essentially repeat-free. These observations remain effectively unchanged in the mouse genome as shown in Figure 3B.
Do pyknons merely reflect genomic oddities, or are they linked, somehow, to specific biological processes and molecular functions? We examine this next. In order to ensure that our findings pertain to sequences that are transcribed, the rest of the analysis focuses solely on human and mouse introns.
Intronic instances of pyknons are linked to the same processes and functions in human and mouse even though the underlying sequences are genome-specific and thus not conserved
To determine potential associations with biological processes and molecular functions, we performed an analysis of the GO terms (41) with which human and mouse genes are tagged. We labeled each gene's introns with the GO terms of the corresponding gene products and separately tested whether conserved regions, repeats and pyknon instances show a higher-than-random concentration in the introns of genes associated with certain GO terms (see Methods section). It is important to stress that, had we used actual coverage (i.e. the number of covered nucleotides) instead of concentration, longer introns would have been favored and the GO analysis would have simply rediscovered the well-known fact that genes associated with certain GO terms (e.g. development) tend to have much longer transcripts. Indeed, in all the regions we analyzed for GO term enrichment, coverage values highly correlate with gene length: correlation >0.90 in all cases. On the other hand, concentration values do not correlate with gene length: the absolute value of the correlation was <0.05 in all cases.
First, we explored the possibility of links between human-mouse conserved intronic regions and GO terms. In both human and mouse, we identified more than 500 GO terms (at different levels of the GO hierarchy) that are significantly enriched in intronic regions conserved between human and mouse. For clarity, Table 1A includes only biological processes from the top three levels of the GO hierarchy that are enriched in conserved human and mouse introns (see Supplementary Data for complete table). Comparing the full lists of significantly enriched GO terms from the human and mouse analyses shows that they are 83% similar (Table 2): this result is not surprising since the conserved elements come from aligned orthologous sequences. Here, we define similarity as the percentage of GO terms in the shorter of the two lists that is common to both lists.
Table 1.
Enriched biological processes (representative sample) in human and mouse introns
| P-value (human) | P-value (mouse) | |||
|---|---|---|---|---|
| (A) Biological processes associated with intronic conserved regions between human & mouse | ||||
| Cellular process | 5.41E-07 | 7.30E-14 | ||
| Cell communication | 3.75E-35 | 1.24E-38 | ||
| Regulation of cellular process | 1.17E-05 | 1.17E-14 | ||
| Cell adhesion | 6.32E-17 | 2.95E-17 | ||
| Cell differentiation | 7.38E-39 | 0.00E+00 | ||
| Regulation of biological process | 3.58E-08 | 4.93E-19 | ||
| Negative regulation of biological process | 1.10E-16 | 1.38E-27 | ||
| Regulation of development | 4.87E-10 | 3.34E-12 | ||
| Regulation of physiological process | 2.14E-06 | 4.28E-16 | ||
| Positive regulation of biological process | 1.43E-11 | 1.60E-21 | ||
| Regulation of growth | 1.60E-04 | 1.65E-09 | ||
| Interaction between organisms | 2.32E-03 | 6.24E-03 | ||
| Growth | 1.18E-07 | 8.47E-12 | ||
| Development | 0.00E+00 | 0.00E+00 | ||
| Sex differentiation | 8.75E-04 | 1.18E-04 | ||
| Developmental maturation | 3.48E-06 | 5.90E-09 | ||
| Anatomical structure development | 0.00E+00 | 0.00E+00 | ||
| Embryonic development | 5.97E-18 | 8.76E-21 | ||
| Pattern specification | 8.20E-12 | 1.02E-18 | ||
| Segmentation | 8.48E-04 | 8.91E-05 | ||
| Response to stimulus | 3.02E-07 | 6.72E-06 | ||
| Response to chemical stimulus | 1.49E-04 | 6.38E-03 | ||
| Response to stress | 1.34E-03 | 6.68E-05 | ||
| Response to external stimulus | 2.00E-14 | 3.39E-11 | ||
| Behavior | 1.86E-12 | 2.84E-09 | ||
| (B) Biological processes associated with pyknon elements in the introns of human & mouse | ||||
| Cellular physiological process | 2.76E-13 | |||
| Chromosome segregation | 5.39E-03 | 1.64E-05 | ||
| Cellular metabolism | 2.97E-17 | 3.23E-05 | ||
| Cell division | 4.85E-04 | 1.12E-05 | ||
| Cell cycle (mitotic cell cycle, M phase, meiotic cell cycle) | 6.58E-04 | 5.44E-03 | ||
| Metabolism | 2.52E-18 | 9.94E-07 | ||
| Catabolism | 2.42E-06 | 1.50E-04 | ||
| Macromolecule metabolism | 4.17E-19 | 2.64E-12 | ||
| Primary metabolism | 2.84E-14 | 9.45E-06 | ||
| Protein localization | 3.02E-09 | 7.90E-07 | ||
| establishment of protein localization | 7.26E-10 | 9.79E-08 | ||
| Response to endogenous stimulus | 1.91E-06 | 3.29E-04 | ||
| response to DNA damage stimulus | 2.19E-07 | 1.62E-04 | ||
(A) Enriched biological processes of intronic sequences that are conserved between human and mouse. (B) Enriched biological processes of intronic sequences that correspond to instances of pyknons. For each of the listed processes, the corresponding P-value is shown for the human and mouse genomes. It is important to point out that these enrichment lists hold true for both the human and mouse genomes: this is particularly notable in the case of part B of the Table because pyknons do not reside inside human-mouse conserved regions (Figure 2) See also text for a discussion.
Table 2.
Overlaps of significant GO terms in human and mouse at a false discovery rate of 5%
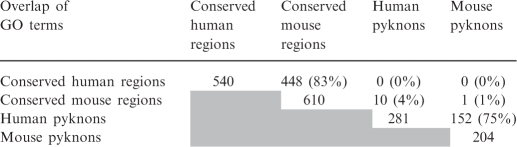 |
Similar results were obtained for the more conservative rate of 1% (see Supplement for details).
Next, we repeated the analysis separately for the intronic instances of the human and mouse pyknons and identified more than 200 significantly enriched GO terms in each of the two genomes. Table 1B includes only the high-level biological processes (see Supplementary Data for complete table). To ensure that the observed pyknon-related GO term enrichment is not due to the conserved elements (42) that co-localize with pyknons (0.7% and 0.4% overlap in human and mouse, respectively—see Figure 2), we repeated the analysis after removing the conserved regions that overlap with pyknons; the results remained unchanged. The GO term enrichment also remained unchanged when we repeated the analysis after simultaneously removing conserved and repeat elements. Finally, we analyzed the repeat elements alone and found only a handful of significantly enriched GO terms (16 for human and 34 for mouse—data not shown). These controls demonstrate that the functional links shown in Table 1B are neither due to the conserved regions nor to the presence of sense instances of repeat elements in introns.
The first notable result of our study stems from the comparison of the two complete lists (see Supplementary Data) of significantly enriched GO terms in human and mouse pyknons: in fact, we find that these lists are 75% similar (Table 2). If we consider only high-level biological processes, the human and mouse lists are identical—these shorter lists were presented in Table 1B. What is particularly surprising here is that the same GO terms are enriched in human and mouse introns despite the fact that pyknons do not lie inside intronic regions that are conserved between human and mouse. Note that this functional connection resulted from the analysis of the intronic regions of gene transcripts that contain instances of pyknon sequences; as such it is orthogonal to analogous exonic findings that we described earlier (11).
Cross-genome-conserved sequences and intra-genome-conserved pyknons respectively are linked to non-overlapping lists of processes and functions
The second notable result of our study arises from the comparison of the enriched GO terms that are associated with intronic ‘conserved’ regions and with intronic ‘pyknon’ instances, respectively: we find that the overlap of the two lists of GO terms is very small and ranges from 0% to 4% (Table 2). This is remarkable because it suggests that distinct intronic sequences are linked to distinct regulatory networks in the human and mouse genomes.
Table 3 summarizes these results in the context of the classical inter-genomic model (intronic sequences conserved between human and mouse) and the intra-genomic conservation (intronic space covered by organism-specific pyknon sequences) that we introduced above.
Table 3.
Summarizing the similarities and differences between the intragenomic conservation model we defined above and cross-genome conserved regions obtained from human-mouse alignments (Figure 1)
| Feature | Intronic regions conserved between human & mouse | Pyknons |
|---|---|---|
| Length | Long | Short |
| Cross-species conservation | Yes | No |
| Organism-specific conservation | No | Yes |
| Functional conservation | Yes | Yes |
A subset of pyknons co-localizes extensively with piRNAs inside human and mouse introns
We note that Table 1B includes ‘meiosis’ as one of the cellular processes associated with the intronic instances of pyknons. Recently, a new class of short RNAs, the piRNAs, was found to accumulate at the onset of meiosis and was reported in three different organisms namely, human, mouse and rat (37,38,43). The distinct association of piRNAs with the meiotic step and the fact that some of the cloned mouse sequences were reported to map to introns (38), led us to investigate the possibility of a pyknon–piRNA connection in intronic sequences. After locating all the piRNA instances in introns, we calculated their overlap with conserved regions, repeats, and pyknons, generating relative enrichment values over what would be expected randomly. We repeated the same analysis for the reverse complement of piRNAs as well as for the intersection of piRNAs and their reverse complements, i.e. the intronic regions that are covered by a piRNA and the reverse complement of a (possibly different) piRNA. The results are summarized in Supplementary Figure 1A. Essentially, we find that piRNA instances as well as the instances of their reverse complements are depleted in conserved intronic regions, somewhat enriched in repeat elements present in introns, and highly enriched in intronic pyknon instances. Again, all sequence comparisons are done in 5′→3′ direction. Supplementary Figure 1B shows the ‘recall’ percentages of piRNAs by conserved, repeat and pyknon elements. The finding is that the computed recall figures indicate that pyknon elements capture (i.e. describe) piRNAs much better than conserved regions and repeat elements: the statistical significance of the overlap of the intronic piRNA instances with intronic pyknons and intronic repeats has P-values of ∼10−10 and ∼10−3, respectively. Even though a large fraction of piRNAs co-localizes with pyknons, the converse is not true. Indeed, only a small fraction of the intronic regions occupied by human and mouse pyknons co-localizes with piRNAs (9% and 12% for human and mouse respectively at ≥95% similarity). In other words, our pyknon collections contain many sequences that do not co-localize with piRNAs.
Does this mean that pyknons merely correspond to piRNAs that have not yet been sequenced? Or, do pyknons capture molecular classes beyond piRNAs? If we only consider pyknons that are not similar to the known piRNAs at the sequence level, most of the previously enriched GO terms survive but ‘meiosis’ now disappears from the list of significant GO terms. The latter result holds true even when we permit a false discovery rate as high as 50%. Given that piRNAs have only been found during meiosis, and therefore play a role during this process, the fact that the subset of pyknons which are not associated with the known piRNAs is not linked to meiosis, suggests that the sequences of the pyknons capture piRNAs but also other currently unidentified categories of molecules.
Case study: pyknons, introns, piRNAs and the MLH1 gene
Arguably, the picture that is emerging from the above analysis is complicated. We highlight this observation with a concrete example that also shows the relevance of these results in the disease context. The complete list of GO terms (see Supplementary Data) that are significantly enriched in pyknon-containing regions of the human and mouse introns includes the terms: ‘GO:0006281/DNA repair’ and ‘GO:0006298/mismatch repair’. We emphasize that these two terms are uniquely associated with pyknons as is shown in the Supplementary Data; thus, the results that we describe next are neither associated with conserved regions nor with known repeat elements. A search of the ENSEMBL database (39) for human genes labeled with these two GO terms identifies a number of entries; among them is MLH1, a gene that has been associated with hereditary non-polyposis colorectal cancer and other types of carcinomas, microsatellite instabilities, etc. (44–47). The human MLH1 transcript has 17 introns whereas its mouse orthologue has 18. Table 4 lists a few examples of human and mouse pyknons that are present in the introns of MLH1: as can be seen, their distribution and copy numbers across MLH1's introns is rather complex. Also shown is the total number of genomic copies of each listed pyknon: we provide this number only as a reference since, as we showed above, the pyknons are already over-represented in the introns of genes belonging to specific GO processes. We further examined whether the 10 human pyknons shown in Table 4 had any instances in the mouse introns of MLH1: we found no such cases even when we allowed as many as 15% of the pyknon positions to be mismatched. Respectively, we examined whether the four mouse pyknons shown in Table 4 had any instances in the human introns of MLH1: again, we found no such cases even when we allowed as many as 15% of the pyknon positions to be mismatched. In addition to their MLH1 instances, each of the shown pyknons has thousands of intact copies in other parts of the corresponding genome. It should also be pointed out that several of the listed pyknons are reverse complement pairs (e.g. GTATTTTTAGTAGAGA and TCTCTACTAAAAATAC), with the members of these pairs having generally different copy numbers that appear in either the same or in different introns of MLH1. Finally, we note that 17 known human piRNAs and 23 known mouse piRNAs can be found intact, in either sense or antisense direction, in nine human introns and six mouse introns of MLH1, respectively. The sequences and the identity of these introns are shown in Table 5.
Table 4.
Examples and related information for human and mouse pyknons that are present in the introns of MLH1, a microsatellite instability gene
| Human pyknon sequence | Total copies in human genome | How many copies are present in which intron of human MLH1 | |||||||||||||||||
|---|---|---|---|---|---|---|---|---|---|---|---|---|---|---|---|---|---|---|---|
| 1 | 2 | 3 | 4 | 5 | 6 | 7 | 8 | 9 | 10 | 11 | 12 | 13 | 14 | 15 | 16 | 17 | |||
| AACTCCTGACCTCAGGTGAT | 92 215 | 2 | 1 | 2 | 2 | ||||||||||||||
| AGTAGCTGGGATTACAG | 205 790 | 1 | 3 | 1 | 2 | ||||||||||||||
| CTGTAATCCCAGCTACT | 205 790 | 1 | 1 | 1 | 1 | 2 | |||||||||||||
| ATTCTCCTGCCTCAGCCTC | 292 883 | 1 | 3 | 1 | 1 | 1 | 2 | ||||||||||||
| GTATTTTTAGTAGAGA | 323 826 | 1 | 1 | 1 | 1 | 1 | 2 | 3 | |||||||||||
| TCTCTACTAAAAATAC | 323 826 | 1 | 1 | 1 | 1 | 1 | 2 | 1 | |||||||||||
| CCCAGGCTGGAGTGCA | 358 005 | 1 | 1 | 2 | 1 | 1 | 4 | ||||||||||||
| TGCACTCCAGCCTGGG | 358 005 | 1 | 1 | 1 | 1 | 3 | 2 | ||||||||||||
| TAATCCCAGCACTTTGGGA | 358 314 | 1 | 1 | 1 | 1 | 2 | 1 | ||||||||||||
| TCCCAAAGTGCTGGGATTA | 358 314 | 2 | 1 | 1 | 1 | 3 | |||||||||||||
| Mouse pyknon sequence | Total copies in mouse genome | How many copies are present in which intron of mouse MLH1 | |||||||||||||||||
| 1 | 2 | 3 | 4 | 5 | 6 | 7 | 8 | 9 | 10 | 11 | 12 | 13 | 14 | 15 | 16 | 17 | 18 | ||
| CTGCCTCTCTGCCTCT | 7 758 | 1 | 7 | ||||||||||||||||
| TGGAAGAGCAGTCAGT | 19 055 | 1 | 1 | ||||||||||||||||
| TGGCTGTCCTGGAACTCACT | 76 023 | 1 | 1 | ||||||||||||||||
| TGTAGACCAGGCTGGCCT | 92 150 | 1 | 1 | ||||||||||||||||
There are 17 introns in the human MLH1 and 18 introns in the mouse orthologue. Also listed is the total number of genomic copies for each listed sequence: this number is provided as a reference only: as we have already described, the pyknons are already over-represented in the introns of genes belonging to specific GO processes. Note that the pairs {AGTAGCTGGGATTACAG, CTGTAATCCCAGCTACT}, {GTATTTTTAGTAGAGA, TCTCTACTAAAAATAC}, {CCCAGGCTGGAGTGCA, TGCACTCCAGCCTGGG}, and {TAATCCCAGCACTTTGGGA, TCCCAAAGTGCTGGGATTA} of the human pyknon examples are the reverse complement of one another: the members of a given pair can be present in the same intron, or in different introns of MLH1 and generally differ in their number of intronic instances in MLH1. See also text.
Table 5.
The introns of MLH1 also contain intact instances of piRNAs and reverse complement of piRNAs in them
| Organism | Intron | Direction | piRNA sequence |
|---|---|---|---|
| Human | 2 | Sense | CTGCATAGTATTCCATGGTGTATATGTGC |
| 3 | Sense | CCTCCCAAAGTGCTGGGATTACAGGCGTGAG | |
| 4 | Sense | TGCCTGTAATCCCAGCACTTTGGGAGGCCG | |
| 4 | Sense | TGTAATCCCAGCACTTTGGGAGGCCGAGG | |
| 5 | Sense | AGTAGAGACAGGGTTTCACCATGTTGGCCA | |
| 5 | Sense | GGCTGGTCTCGAACTCCTGACCTCAGGT | |
| 7 | Antisense | CAGCCTCCTGAGTAGCTGGGATTACAGGCA | |
| 7 | Antisense | CTCACGCCTGTAATCCCAGCACTTTGGGAGG | |
| 7 | Sense | GGCTGGTCTCGAACTCCTGACCTCAGGT | |
| 7 | Sense | TGGTCTCGAACTCCTGACCTCAGGTGATCC | |
| 9 | Antisense | CCTCGGCCTCCCAAAGTGCTGGGATTACA | |
| 9 | Sense | CCTCCCAAAGTGCTGGGATTACAGGCGTGAG | |
| 13 | Antisense | ACCTGAGGTCAGGAGTTCGAGACCAGCC | |
| 13 | Antisense | GGATCACCTGAGGTCAGGAGTTCGAGACCA | |
| 13 | Antisense | TGGATCACCTGAGGTCAGGAGTTCGAGACCA | |
| 14 | Sense | TGCCTGTAATCCCAGCTACTCAGGAGGCTG | |
| 16 | Sense | TCACTTGAACCCAGGAGGCGGAGGTTGCAGTG | |
| Mouse | 2 | Sense | TGAGTTCAAATCCCAGCAACCACATGGTGGC |
| 2 | Sense | TGTGTGTGTGTGTGTGTGTGTGTGTG | |
| 4 | Antisense | AACTCACTCTGTAGACCAGGCTGGCCTCGAAC | |
| 4 | Antisense | AGCCCTGGCTGTCCTGGAACTCACTCTGTA | |
| 4 | Antisense | CCTCGAACTCAGAAATCCGCCTGCCTCTGCCT | |
| 4 | Sense | ACTCAGAAATCCGCCTGCCTCTGCCTCC | |
| 4 | Sense | CTGGCTGTCCTGGAACTCACTCTGTAGA | |
| 4 | Sense | TCGAACTCAGAAATCCGCCTGCCTCTGCCTC | |
| 4 | Sense | TCNCTCTGTAGACCAGGCTGGCCTCGAACT | |
| 4 | Sense | TGGAACTCACTCTGTAGACCAGGCTGGCC | |
| 4 | Sense | TGGCCTCGAACTCAGAAATCCGCCTGCCTC | |
| 9 | Antisense | GCCCTGGCTGTCCTGGAACTCACTTTGTA | |
| 9 | Antisense | TAGCCCTGGCTGTCCTGGAACTCACTTTGNA | |
| 9 | Antisense | TGGCTGTCCTGGAACTCACTTTGTA | |
| 9 | Sense | GCCCTGGCTGTCCTGGAACTCACTTTGTA | |
| 9 | Sense | TCACTTTGTAGACCAGGCTGGCCTCGAACT | |
| 9 | Sense | TCGAACTCAGAAATCTGCCTGCCTCTGCCTC | |
| 9 | Sense | TGGAACTCACTTTGTAGACCAGGCTGGCCT | |
| 9 | Sense | TGGCCTCGAACTCAGAAATCTGCCTGCCTC | |
| 11 | Sense | TCCTTCTTCTTGAGCTTCATGTGGTCTGT | |
| 14 | Antisense | TTAGGGTTTTACTGCTGTGAACAGACACCA | |
| 14 | Sense | TGCTGTGAACAGACACCATGACCAAGGCAAC | |
| 15 | Antisense | GCCACCATGTGGTTGCTGGGATTTGAACTCA | |
The table shows known piRNA sequences and the corresponding MLH1 introns in which they are found in human and mouse.
DISCUSSION
Beginning in the early 1980s with the analysis of amino acid coding sequences (48) an argument was made in support of the hypothesis that ‘sequence conservation implies functional conservation’. The hypothesis was quickly extended to include non-coding sequences and has since been fueling the biological sequence analysis revolution (49). Underlying this hypothesis is an inter-genomic model of conservation according to which genomic regions with functional significance undergo negative selection. Contrasting this, recent work showed a first example that the same type of functional information may exist in multiple genomes in the absence of discernible underlying sequence conservation (9,12).
The analysis that we presented above proceeded along similar lines: using organism-specific pyknon sequences from the human and mouse genomes, we demonstrated that functional conservation in the absence of sequence conservation is rather pronounced. Our results revealed an important role for what we defined as the ‘intra-genomic conservation’ model and led to the following surprising result: although pyknons are present in intronic regions that are not conserved between human and mouse they nonetheless exhibit a preference for the introns of genes belonging to the same biological processes and molecular functions in these two genomes. Analogously, intronic regions that are conserved between human and mouse are also associated with specific biological processes and functions. However, it is very notable that these two sets of processes and functions have an in-significant overlap; this indicates that distinct intronic regions in human and mouse are associated with distinct biological processes and molecular functions, suggesting the involvement of introns in regulation.
Our findings have intriguing implications for intronic evolution. With respect to the conserved intronic regions that we examined, it is apparent that these can be traced back to a common ancestor of the human and mouse genomes. In contrast, the intronic regions that correspond to pyknon instances suggest a substantially more complicated situation: their extent and the high number of the pyknons’ genomic copies suggest that the same basic mechanism may be in action in both the human and the mouse genome. This presumed mechanism, operating on sequences that are not conserved in these two genomes, has given rise to the currently extant collection of introns. It is interesting to note that this presumed mechanism appears to preferentially ‘target’ (actively or passively) the introns of genes that are linked to specific functions, giving rise to the entries of Table 1B (as opposed to the entries of Table 1A). It is not clear at the moment how this presumed mechanism has managed, by acting in an apparently independent manner in two distinct genomes, to ‘delineate’ the pyknons sequences and to ‘arrange’ them inside the transcripts of genes in a manner that for both the human and mouse genomes favors destinations belonging to the same set of processes and functions. These functional links exist without conservation of the underlying sequence, and are in agreement with current thinking that sequence conservation is not a prerequisite for functional relevance (8).
Evidence has been steadily accumulating in support of a functional significance for introns (50): a large fraction of the known microRNAs as well as snoRNAs originate in intronic space; mutations in intronic sequence have been linked to desirable phenotypes; ncRNA with currently uncharacterized regulatory role has been found to originate in intronic space; etc. More recently, intronic sequences were linked to a putative regulatory mechanism for modulating the membrane properties and ion channel gradients of hippocampal neurons (51). Such findings together with the ones that we have presented above support a much more active role for introns. This role is perhaps part of a much more pronounced RNA-driven layer of regulation, as conjectured earlier (52).
SUPPLEMENTARY DATA
At the website http://cbcsrv.watson.ibm.com/pyknons_introns.html the user can access the human and pyknon sequences discussed above.
ACKNOWLEDGEMENTS
The authors would like to thank Tien Huynh for his assistance with some of the computations. Funding to pay the Open Access publication charges for this article was provided by provided by IBM Research.
Conflict of interest statement. None declared.
REFERENCES
- 1.Bejerano G, Lowe CB, Ahituv N, King B, Siepel A, Salama SR, Rubin EM, Kent WJ, Haussler D. A distal enhancer and an ultraconserved exon are derived from a novel retroposon. Nature. 2006;441:87–90. doi: 10.1038/nature04696. [DOI] [PubMed] [Google Scholar]
- 2.Bejerano G, Pheasant M, Makunin I, Stephen S, Kent WJ, Mattick JS, Haussler D. Ultraconserved elements in the human genome. Science. 2004;304:1321–1325. doi: 10.1126/science.1098119. [DOI] [PubMed] [Google Scholar]
- 3.Kellis M, Patterson N, Endrizzi M, Birren B, Lander ES. Sequencing and comparison of yeast species to identify genes and regulatory elements. Nature. 2003;423:241–254. doi: 10.1038/nature01644. [DOI] [PubMed] [Google Scholar]
- 4.Xie X, Lu J, Kulbokas EJ, Golub TR, Mootha V, Lindblad-Toh K, Lander ES, Kellis M. Systematic discovery of regulatory motifs in human promoters and 3′ UTRs by comparison of several mammals. Nature. 2005;434:338–345. doi: 10.1038/nature03441. [DOI] [PMC free article] [PubMed] [Google Scholar]
- 5.Mattick JS, Makunin IV. Non-coding RNA. Human Mol. Genet. 2006;15(Spec No 1):R17–R29. doi: 10.1093/hmg/ddl046. [DOI] [PubMed] [Google Scholar]
- 6.Lai EC, Burks C, Posakony JW. The K box, a conserved 3′ UTR sequence motif, negatively regulates accumulation of enhancer of split complex transcripts. Development. 1998;125:4077–4088. doi: 10.1242/dev.125.20.4077. [DOI] [PubMed] [Google Scholar]
- 7.Dubchak I, Brudno M, Loots GG, Pachter L, Mayor C, Rubin EM, Frazer KA. Active conservation of noncoding sequences revealed by three-way species comparisons. Genome Res. 2000;10:1304–1306. doi: 10.1101/gr.142200. [DOI] [PMC free article] [PubMed] [Google Scholar]
- 8.Pang KC, Frith MC, Mattick JS. Rapid evolution of noncoding RNAs: lack of conservation does not mean lack of function. Trends Genet. 2006;22:1–5. doi: 10.1016/j.tig.2005.10.003. [DOI] [PubMed] [Google Scholar]
- 9.Fisher S, Grice EA, Vinton RM, Bessling SL, McCallion AS. Conservation of RET regulatory function from human to zebrafish without sequence similarity. Science. 2006;312:276–279. doi: 10.1126/science.1124070. [DOI] [PubMed] [Google Scholar]
- 10.Miranda KC, Huynh T, Tay Y, Ang YS, Tam WL, Thomson AM, Lim B, Rigoutsos I. A pattern-based method for the identification of MicroRNA binding sites and their corresponding heteroduplexes. Cell. 2006;126:1203–1217. doi: 10.1016/j.cell.2006.07.031. [DOI] [PubMed] [Google Scholar]
- 11.Rigoutsos I, Huynh T, Miranda K, Tsirigos A, McHardy A, Platt D. Short blocks from the noncoding parts of the human genome have instances within nearly all known genes and relate to biological processes. Proc. Natl Acad. Sci. USA. 2006;103:6605–6610. doi: 10.1073/pnas.0601688103. [DOI] [PMC free article] [PubMed] [Google Scholar]
- 12.McGaughey DM, Vinton RM, Huynh J, Al-Saif A, Beer MA, McCallion AS. Metrics of sequence constraint overlook regulatory sequences in an exhaustive analysis at phox2b. Genome Res. 2008;18:252–260. doi: 10.1101/gr.6929408. [DOI] [PMC free article] [PubMed] [Google Scholar]
- 13.Mattick JS. Introns: evolution and function. Curr. Opin. Genet. Dev. 1994;4:823–831. doi: 10.1016/0959-437x(94)90066-3. [DOI] [PubMed] [Google Scholar]
- 14.Mattick JS, Gagen MJ. The evolution of controlled multitasked gene networks: the role of introns and other noncoding RNAs in the development of complex organisms. Mol. Biol. Evol. 2001;18:1611–1630. doi: 10.1093/oxfordjournals.molbev.a003951. [DOI] [PubMed] [Google Scholar]
- 15.Simons C, Pheasant M, Makunin IV, Mattick JS. Transposon-free regions in mammalian genomes. Genome Res. 2006;16:164–172. doi: 10.1101/gr.4624306. [DOI] [PMC free article] [PubMed] [Google Scholar]
- 16.Pollard KS, Salama SR, Lambert N, Lambot MA, Coppens S, Pedersen JS, Katzman S, King B, Onodera C, Siepel A, et al. An RNA gene expressed during cortical development evolved rapidly in humans. Nature. 2006;443:167–172. doi: 10.1038/nature05113. [DOI] [PubMed] [Google Scholar]
- 17.Sironi M, Menozzi G, Comi GP, Cagliani R, Bresolin N, Pozzoli U. Analysis of intronic conserved elements indicates that functional complexity might represent a major source of negative selection on non-coding sequences. Hum. Mol. Genet. 2005;14:2533–2546. doi: 10.1093/hmg/ddi257. [DOI] [PubMed] [Google Scholar]
- 18.Siepel A, Bejerano G, Pedersen JS, Hinrichs AS, Hou M, Rosenbloom K, Clawson H, Spieth J, Hillier LW, Richards S, et al. Evolutionarily conserved elements in vertebrate, insect, worm, and yeast genomes. Genome Res. 2005;15:1034–1050. doi: 10.1101/gr.3715005. [DOI] [PMC free article] [PubMed] [Google Scholar]
- 19.Nakaya HI, Amaral PP, Louro R, Lopes A, Fachel AA, Moreira YB, El-Jundi TA, da Silva AM, Reis EM, Verjovski-Almeida S. Genome mapping and expression analyses of human intronic noncoding RNAs reveal tissue-specific patterns and enrichment in genes related to regulation of transcription. Genome Biol. 2007;8:R43. doi: 10.1186/gb-2007-8-3-r43. [DOI] [PMC free article] [PubMed] [Google Scholar]
- 20.Brosius J. RNAs from all categories generate retrosequences that may be exapted as novel genes or regulatory elements. Gene. 1999;238:115–134. doi: 10.1016/s0378-1119(99)00227-9. [DOI] [PubMed] [Google Scholar]
- 21.Dixon RJ, Eperon IC, Samani NJ. Complementary intron sequence motifs associated with human exon repetition: a role for intragenic, inter-transcript interactions in gene expression. Bioinformatics. 2007;23:150–155. doi: 10.1093/bioinformatics/btl575. [DOI] [PubMed] [Google Scholar]
- 22.Margulies EH, Cooper GM, Asimenos G, Thomas DJ, Dewey CN, Siepel A, Birney E, Keefe D, Schwartz AS, Hou M, et al. Analyses of deep mammalian sequence alignments and constraint predictions for 1% of the human genome. Genome Res. 2007;17:760–774. doi: 10.1101/gr.6034307. [DOI] [PMC free article] [PubMed] [Google Scholar]
- 23.Ruby JG, Jan CH, Bartel DP. Intronic microRNA precursors that bypass Drosha processing. Nature. 2007;448:83–86. doi: 10.1038/nature05983. [DOI] [PMC free article] [PubMed] [Google Scholar]
- 24.Sironi M, Menozzi G, Comi GP, Cagliani R, Bresolin N, Pozzoli U. Analysis of intronic conserved elements indicates that functional complexity might represent a major source of negative selection on non-coding sequences. Human Mol. Genet. 2005;14:2533–2546. doi: 10.1093/hmg/ddi257. [DOI] [PubMed] [Google Scholar]
- 25.Storici F, Bebenek K, Kunkel TA, Gordenin DA, Resnick MA. RNA-templated DNA repair. Nature. 2007;447:338–341. doi: 10.1038/nature05720. [DOI] [PMC free article] [PubMed] [Google Scholar]
- 26.Bartel DP. MicroRNAs: genomics, biogenesis, mechanism, and function. Cell. 2004;116:281–297. doi: 10.1016/s0092-8674(04)00045-5. [DOI] [PubMed] [Google Scholar]
- 27.Kapranov P, Cheng J, Dike S, Nix DA, Duttagupta R, Willingham AT, Stadler PF, Hertel J, Hackermueller J, Hofacker IL, et al. RNA maps reveal new RNA classes and a possible function for pervasive transcription. Science. 2007;316:1484–1488. doi: 10.1126/science.1138341. [DOI] [PubMed] [Google Scholar]
- 28.Kapranov P, Willingham AT, Gingeras TR. Genome-wide transcription and the implications for genomic organization. Nat. Rev. Genet. 2007;8:413–423. doi: 10.1038/nrg2083. [DOI] [PubMed] [Google Scholar]
- 29.ENCODE Identification and analysis of functional elements in 1% of the human genome by the ENCODE pilot project. Nature. 2007;447:799–816. doi: 10.1038/nature05874. [DOI] [PMC free article] [PubMed] [Google Scholar]
- 30.Dermitzakis ET, Reymond A, Antonarakis SE. Conserved non-genic sequences – an unexpected feature of mammalian genomes. Nat. Rev. Genet. 2005;6:151–157. doi: 10.1038/nrg1527. [DOI] [PubMed] [Google Scholar]
- 31.Nobrega MA, Zhu Y, Plajzer-Frick I, Afzal V, Rubin EM. Megabase deletions of gene deserts result in viable mice. Nature. 2004;431:988–993. doi: 10.1038/nature03022. [DOI] [PubMed] [Google Scholar]
- 32.Lowe CB, Bejerano G, Haussler D. Thousands of human mobile element fragments undergo strong purifying selection near developmental genes. Proc. Natl Acad. Sci. USA. 2007;104:8005–8010. doi: 10.1073/pnas.0611223104. [DOI] [PMC free article] [PubMed] [Google Scholar]
- 33.Iwashita S, Osada N, Itoh T, Sezaki M, Oshima K, Hashimoto E, Kitagawa-Arita Y, Takahashi I, Masui T, Hashimoto K, et al. A transposable element-mediated gene divergence that directly produces a novel type bovine Bcnt protein including the endonuclease domain of RTE-1. Mol. Biol. Evol. 2003;20:1556–1563. doi: 10.1093/molbev/msg168. [DOI] [PubMed] [Google Scholar]
- 34.Lev-Maor G, Sorek R, Shomron N, Ast G. The birth of an alternatively spliced exon: 3′ splice-site selection in Alu exons. Science. 2003;300:1288–1291. doi: 10.1126/science.1082588. [DOI] [PubMed] [Google Scholar]
- 35.Gotea V, Makalowski W. Do transposable elements really contribute to proteomes? Trends Genet. 2006;22:260–267. doi: 10.1016/j.tig.2006.03.006. [DOI] [PubMed] [Google Scholar]
- 36.Meynert A, Birney E. Picking pyknons out of the human genome. Cell. 2006;125:836–838. doi: 10.1016/j.cell.2006.05.019. [DOI] [PubMed] [Google Scholar]
- 37.Aravin A, Gaidatzis D, Pfeffer S, Lagos-Quintana M, Landgraf P, Iovino N, Morris P, Brownstein MJ, Kuramochi-Miyagawa S, Nakano T, et al. A novel class of small RNAs bind to MILI protein in mouse testes. Nature. 2006;442:203–207. doi: 10.1038/nature04916. [DOI] [PubMed] [Google Scholar]
- 38.Girard A, Sachidanandam R, Hannon GJ, Carmell MA. A germline-specific class of small RNAs binds mammalian Piwi proteins. Nature. 2006;442:199–202. doi: 10.1038/nature04917. [DOI] [PubMed] [Google Scholar]
- 39.Stabenau A, McVicker G, Melsopp C, Proctor G, Clamp M, Birney E. The Ensembl core software libraries. Genome Res. 2004;14:929–933. doi: 10.1101/gr.1857204. [DOI] [PMC free article] [PubMed] [Google Scholar]
- 40.Rigoutsos I, Floratos A. Combinatorial pattern discovery in biological sequences: The TEIRESIAS algorithm. Bioinformatics. 1998;14:55–67. doi: 10.1093/bioinformatics/14.1.55. [DOI] [PubMed] [Google Scholar]
- 41.Ashburner M, Ball CA, Blake JA, Botstein D, Butler H, Cherry JM, Davis AP, Dolinski K, Dwight SS, Eppig JT, et al. Gene ontology: tool for the unification of biology. The Gene Ontology Consortium. Nat. Genet. 2000;25:25–29. doi: 10.1038/75556. [DOI] [PMC free article] [PubMed] [Google Scholar]
- 42.Waterston RH, Lindblad-Toh K, Birney E, Rogers J, Abril JF, Agarwal P, Agarwala R, Ainscough R, Alexandersson M, An P, et al. Initial sequencing and comparative analysis of the mouse genome. Nature. 2002;420:520–562. doi: 10.1038/nature01262. [DOI] [PubMed] [Google Scholar]
- 43.Lau NC, Seto AG, Kim J, Kuramochi-Miyagawa S, Nakano T, Bartel DP, Kingston RE. Characterization of the piRNA complex from rat testes. Science. 2006;313:363–367. doi: 10.1126/science.1130164. [DOI] [PubMed] [Google Scholar]
- 44.Bronner CE, Baker SM, Morrison PT, Warren G, Smith LG, Lescoe MK, Kane M, Earabino C, Lipford J, Lindblom A. Mutation in the DNA mismatch repair gene homologue hMLH1 is associated with hereditary non-polyposis colon cancer. Nature. 1994;368:258–261. doi: 10.1038/368258a0. [DOI] [PubMed] [Google Scholar]
- 45.Nystroem-Lahti M, Kristo P, Nicolaides NC, Chang SY, Aaltonen LA, Moisio AL, Jaervinen HJ, Mecklin JP, Kinzler KW, Vogelstein B. Founding mutations and Alu-mediated recombination in hereditary colon cancer. Nat. Med. 1995;1:1203–1206. doi: 10.1038/nm1195-1203. [DOI] [PubMed] [Google Scholar]
- 46.Leung SY, Yuen ST, Chung LP, Chu KM, Chan AS, Ho JC. hMLH1 promoter methylation and lack of hMLH1 expression in sporadic gastric carcinomas with high-frequency microsatellite instability. Cancer Res. 1999;59:159–164. [PubMed] [Google Scholar]
- 47.Alazzouzi H, Domingo E, Gonzalez S, Blanco I, Armengol M, Espin E, Plaja A, Schwartz S, Capella G, Schwartz S., Jr. Low levels of microsatellite instability characterize MLH1 and MSH2 HNPCC carriers before tumor diagnosis. Hum. Mol. Genet. 2005;14:235–239. doi: 10.1093/hmg/ddi021. [DOI] [PubMed] [Google Scholar]
- 48.Doolittle RF, Hunkapiller MW, Hood LE, Devare SG, Robbins KC, Aaronson SA, Antoniades HN. Simian sarcoma virus onc gene, v-sis, is derived from the gene (or genes) encoding a platelet-derived growth factor. Science. 1983;221:275–277. doi: 10.1126/science.6304883. [DOI] [PubMed] [Google Scholar]
- 49.Gusfield D. Algorithms on Strings, Trees, and Sequences: Computer Science and Computational Biology. Cambridge (England); New York: Cambridge University Press; 1997. [Google Scholar]
- 50.Mattick JS, Makunin IV. Small regulatory RNAs in mammals. Hum. Mol. Genet. 2005;14(Spec No 1):R121–R132. doi: 10.1093/hmg/ddi101. [DOI] [PubMed] [Google Scholar]
- 51.Bell TJ, Miyashiro KY, Sul JY, McCullough R, Buckley PT, Jochems J, Meaney DF, Haydon P, Cantor C, Parsons TD, et al. Cytoplasmic BK(Ca) channel intron-containing mRNAs contribute to the intrinsic excitability of hippocampal neurons. Proc. Natl Acad. Sci. USA. 2008;105:1901–1906. doi: 10.1073/pnas.0711796105. [DOI] [PMC free article] [PubMed] [Google Scholar]
- 52.Mattick JS. A new paradigm for developmental biology. J. Exp. Biol. 2007;210:1526–1547. doi: 10.1242/jeb.005017. [DOI] [PubMed] [Google Scholar]
Associated Data
This section collects any data citations, data availability statements, or supplementary materials included in this article.