Abstract
The 29-residue peptide hormone glucagon forms amyloid fibrils within a few hours at low pH. In this study, we use glucagon as a model system to investigate fibril formation by liquid-state 1H-NMR spectroscopy One-dimensional, correlation, and diffusion experiments monitoring the fibril formation process provide insight into the early stages of the pathway on which the molecules aggregate to fibrils. In conjunction with these techniques, exchange experiments give information about the end-state conformation. Within the limits of detection, there are no signs of larger oligomeric intermediates in the course of the fibril formation process. Kinetic information is extracted from the time course of the residual free glucagon signal decay. This suggests that glucagon amyloids form by a nucleated growth mechanism in which trimers (rather than monomers) of glucagon interact directly with the growing fibrils rather than with each other. The results of proton/deuterium exchange experiments on mature fibrils with subsequent dissolution show that the N-terminal of glucagon is the least amenable to exchange, which indicates that this part is strongly involved in the intermolecular bonds of the fibrils.
INTRODUCTION
The spontaneous aggregation of polypeptides into macromolecular amyloid fibrillar structures has received much attention in recent years (1–3). Amyloidosis is involved in more than 20 major diseases and is associated with neurodegeneration and systemic malfunctions, the most well-known of which include Alzheimer's disease, Parkinson's disease, type II diabetes mellitus, Huntington's disease, and the various prion diseases (1,2,4,5). It has been suggested that essentially all polypeptides can form amyloid-like aggregates, given the right circumstances (6). In addition to the direct detrimental disease effects, fibril formation also can be problematic in industrial applications that use polypeptides as pharmaceuticals. It is a major concern to keep the therapeutics in a stable, native form, because disruption to a nonnative conformation might trigger aggregation/fibril formation, with consequences including diminished activity, wrong dose measures, and potential cytotoxic effects from the fibrils through the activation of apoptotic signaling pathways (7).
Substantial efforts have been devoted to the study of the kinetics of amyloid formation and amyloid structures to understand the basic mechanism of fibril formation and to prevent or reverse the process. Kinetic studies have exploited amyloid interactions with dyes such as Congo red, fluorescence measurements of interactions with thioflavin T, and dynamic light scattering (8–11). Secondary structure measurements have involved spectroscopic methods such as circular dichroism and Fourier transform infrared (12–14), whereas structures with different degrees of resolution have been established using electron microscopy (15), atomic force microscopy (AFM) (16), x-ray fiber diffraction (17), x-ray microcrystallography (18), small-angle x-ray scattering (19), and solid-state NMR spectroscopy (20–24). These studies reveal diverse fibrillar super-structures, most of which are based on a so-called cross-β-structure (25) now commonly associated with the definition of amyloids (1,2). Due to the complexity of the system—with intermediate states, highly varying dynamics, molecular interactions, rapid change of the particles from individual molecules in solution to large solid aggregate structures, and the potential to form fibrils with different morphology under different conditions—we are still far from atomic resolution structural insight into the full process of fibril formation. Although intensely studied, only little is known about the early stages of fibril formation, the associated folding/refolding processes, the clear influence from environmental parameters (pH, ionic strength, concentration, temperature, etc.), the dependence on seeds, the formation of intermediate oligomers, protofibrils, exchange of molecules with the fibrils, and variations in initiation and lag time, and much more (14,26–30). The proposed generic ability of proteins to form cross-β structures suggests that backbone interactions are very prominent in fibril structures. Side-chain interactions nevertheless still contribute to contacts between the strands (18) and significantly modulate the kinetics of aggregation (31). An expected common feature is the aggregation of monomers to an oligomeric intermediate, which may either form the basis for further aggregation or be a “dead-end” structure (32–35). These oligomers are currently subject to intense scrutiny, because there is growing evidence that they are the cytotoxic species, possibly due to membrane-perturbing abilities, whereas the fibrils may represent an inert storage state (1,2).
With the aim of exposing features of the early stages of fibril formation, this study uses liquid-state 1H-NMR spectroscopy to address fibril formation of glucagon—a 29-residue peptide hormone that has been used as a model system for the formation of amyloids with methods such as thioflavin T fluorescence (14), electron microscopy (30), AFM (36,37), Fourier transform infrared, and circular dichroism spectroscopy (38), and, recently, microcrystal microbalance (35). Cytotoxic effects also have been reported for glucagon fibrils (39). Glucagon (primary sequence: HSQGT FTSDY SKYLD SRRAQ DFVQW LMNT) is critical in the balancing of the blood glucose level. As the antagonist to insulin, glucagon induces the conversion of glycogen to free glucose (40,41), and it has been used pharmaceutically as a medicament against hypoglycemia, for example (42). Glucagon is known to form fibrous β-sheet structures under various conditions (14,17,36,37,43,44). The structure of crystallized glucagon has been determined with x-ray diffraction (45), revealing a largely α-helical trimer held together by hydrophobic interactions. In solution and bound to dodecyl phosphocholine (DPC) micelles, the structure of glucagon has been studied by liquid-state NMR (46–48). These studies also reveal an α-helical structure that is only well-defined, however, in a short region toward the C-terminus. Liquid-state NMR (48) and light scattering (30) studies suggest equilibrium in the solution between the monomeric and trimeric states, with the trimer favored at higher glucagon concentrations. It is still an open question, however, how these structures are linked to the formation of fibrils.
MATERIALS AND METHODS
Glucagon
Purified wild-type human glucagon of pharmaceutical grade quality (>98.9% pure, produced by fermentation) was kindly provided by Novo Nordisk A/S (Bagsværd, Denmark). It was dissolved in H2O with 5% D2O (with 100% D2O for diffusion ordered spectroscopy (DOSY) experiments,), 0.1 mM NaN3, and adjusted to pH 2.0 with 1 M HCl. The peptide concentration was either 1.4, 3.5, or 7.0 mg/mL (0.4, 1.0, or 2.0 mM). For the exchange experiments, the buffer was prepared in the same way with D2O instead of H2O. The DMSO (dimethyl sulfoxide) buffer consisted of 95% DMSO-d6, 5% D2O (deuterated sample)/H2O (reference), and the pD*/pH was adjusted to 5.0 with HCl/DCl (49).
Glucagon fibrils
Fibrils were produced by solubilizing 4.0 mg glucagon in 600 μL H2O buffer at pH 2 and adding 6 μL 30 mM Na2SO4. For exchange experiments, the solution was left at room temperature for 4 days, after which it had become a gel. Fibrils were dried by flash-freezing and freeze-drying.
NMR spectroscopy
NMR experiments were performed with spectrometers operating at 1H Larmor frequencies of 400 or 700 MHz (Bruker Avance 400 and Avance II 700, respectively; Bruker Biospin, Rheinstetten, Germany) and 800-MHz spectrometers (Varian Inova; Varian, Palo Alto, CA) equipped with a double-resonance or a triple-resonance z-gradient room temperature (for 400 and 700 MHz), or a cryogenic probe (for 800 MHz). In all experiments, the temperature was controlled to 298.3 K. To monitor fibril formation, the following series of experiments were conducted while the sample was aging. 1), A series of nuclear Overhauser enhancement spectroscopy (NOESY) experiments with 200-ms mixing time (700 MHz, 8 transients, 600 increments, experimental time 4 h 15 min each). Control one-dimensional (1D) spectra were acquired in between the NOESY spectra. 2), A series of total correlation spectroscopy (TOCSY) experiments with 40-ms mixing time and the same acquisition parameters as the NOESY series. 3), A series of stimulated-echo bipolar gradient diffusion DOSY (50) experiments with 4-ms encoding gradients and 100-ms diffusion delay (400 MHz, 32 transients, 32 gradient increments, experimental time 1 h each). Another DOSY series was sampled with 4.5-ms encoding gradients and 1200-ms diffusion delay to search for potential slower decays stemming from large size molecules (400 MHz, 64 transients, 16 increments, 1 h, data not shown). Dioxane (3.8 mM) was used as a reference to verify that the diffusion coefficient was not affected by changing solvent properties or the change in concentration. 4), For secondary structure parameters, additional spectra were acquired on fresh samples of 1.4 and 7.0 mg/mL concentrations (while verifying that the sample was still in its lag phase), i.e., a NOESY (800 MHz, 1600 increments, 200-ms mixing time) with 20 transients for 1.4 mg/mL and 8 transients for 7.0 mg/mL, and two TOCSY (800 MHz, 4 transients, 1600 increments, 25- and 70-ms mixing time).
Principal component analysis
Principal component analysis (PCA) (51) reduces the dimensionality of a data set (e.g., the number of spectra) by describing correlated variations. It essentially groups features of the spectra that behave the same way under changing conditions, e.g., time. Each component is given by a group of features (positive and/or negative changes) called the “loading” and a score plot, which describes how much of the component is present under the different conditions. Ideally the sum of all the scores × loadings describes the noise-free part of the data set. PCA was conducted on a data set obtained from a series of 1D spectra divided into 0.01 ppm regions (bins) over which the signal was integrated to obtain the signal intensity. The region around the residual water signal (6.0–4.0 ppm) was removed to not compromise the analysis. The data were scaled to obtain unit variance (i.e., each region/bin was divided by the standard deviation of the integral of that region within the entire data set) and then centered. This scaling reduces the weight of stochastic large amplitude variations and increases the weight of small correlated changes. Singular value decomposition was performed on the matrix X containing the scaled binned spectra, resulting in three matrices U, D, and V, where U × D × V = X. The scores are contained in U × D; V contains the loadings, and D contains the contribution from each component. The resulting scores and loadings were then rescaled to the original intensities (i.e., each region/bin of the loadings was multiplied by the standard deviation of the integral of that region within the entire data set, and the scores were scaled so that U × D × V = X still applies). The PCA and pre- and postprocessing was performed using inhouse R-scripts (the R project) (52).
H/D exchange
A total of 600 μL deuterated buffer (pD* 2.0) was added to the freeze-dried fibrils and placed on a shaker for the exchange period of 24 h. After this period, exchangeable protons on the outside of the fibril should be exchanged with deuterium, whereas the core should still contain protons. A reference sample was treated in the same way but exchanged in H2O buffer rather than D2O buffer. The exchange period was terminated by flash-freezing and freeze-drying the fibrils. The fibrils were dissolved in 98% trifluoroacetic acid-d (53), flash-freezed and freeze-dried. Then, the sample was resolubilized in DMSO buffer at pD* (deuterated sample)/pH (reference) 5.0, a value at which exchange with the DMSO is minimized (49). The dissolving with trifluoroacetic acid was fast, ∼5 min, which was essential to avoid a further exchange in the dissolving medium. Dissolving with 40% trifluoroethanol-d3 and 95% DMSO-d6 (54) also was attempted (data not shown); this process, however, was too slow and was observed decreasing the signal of the reference sample significantly. Exchange rates were calculated on the basis of TOCSY spectra with 30-ms mixing time (400 MHz, 8 transients, 600 increments, experimental time 3 h 30 min each).
AFM
A 7.0 mg/mL solution of glucagon was left to change to a viscous gel-like phase. A very small scoop of this gel-like phase was taken with a pipette tip and resuspended in 100 μL deionized water. A total of 2–5 μL drops of the resuspended sample were placed on freshly cleaved mica, and the drop was gently dried with nitrogen. Imaging was performed with a microscope (PicoSPM; Molecular Imaging, Phoenix, AZ) in contact mode using a 10-μm scanner.
RESULTS AND DISCUSSION
Time evolution of fibril formation
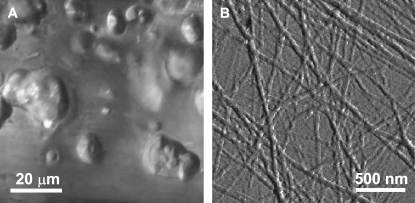
After the preparation of a 3.5 mg/mL solution of glucagon, the consistency of the sample changes within a period of typically 1–2 days from a clear solution toward a viscous gel phase containing spherulites in the micrometer-size range (Fig. 1 A). The time before fibril formation was not well reproducible. Sometimes the process takes much longer; in other cases, it starts immediately after preparation of the sample. An extract of the gel was investigated by AFM. Fig. 1 B shows the typical mesh of fibril structures in the representation of the deflection derivative. The typical thickness of the fibrils is 30–70 nm, which is in accordance with the values previously reported by Dong et al. (37)
FIGURE 1.
(A) Optical microscope (20×) and (B) AFM images of a glucagon sample after fibril formation.
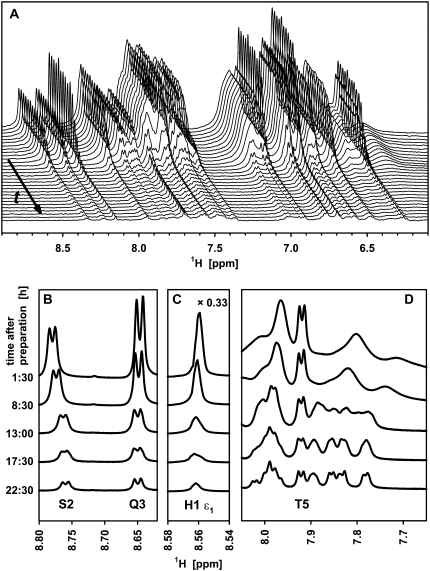
During the time course of fibril formation, 1H liquid-state NMR spectra display significant changes (Fig. 2 A). The upper spectrum represents the initial stage, whereas the lower spectrum was observed after 35 h when advanced fibril formation was macroscopically visible, as shown in Fig. 1 A. Upon fibril formation, all peaks decreased in intensity. In our interpretation, it should be kept in mind that only monomers and oligomers up to a range of 200 kDa (∼60 glucagon molecules) will give detectable signals in current liquid-state NMR experiments. The signals of slowly tumbling larger aggregates, such as protofibrils and fibrils, are broadened beyond detection. The time series of spectra is supposed to monitor the pathway toward the unobservable state. For all peaks, we observed a systematic decrease of the signal intensity over time. This development manifested visually through a decrease of the peak heights, because no line broadening was seen for the observable signals throughout fibril formation. Many of the signals, however, narrowed in the course of fibril formation, an effect that will be discussed below. The absence of line broadening suggests that the decay of the signal represents a loss of free glucagon monomers (or very small oligomers) rather than an increase in size of small polymeric units. The spectra revealed no signs of additional signals that could come from low molecular weight intermediate states.
FIGURE 2.
Excerpts from series of 1D 1H liquid-state NMR spectra of glucagon monitored during fibril formation. (A) Amide (8.6–7.7 ppm) and aromatic/amino region (7.5–6.3 ppm) from 0 to 35 h in steps of 75 min after sample preparation (from back to front). The frequency axis refers only to the first (upper) spectrum at 0 h; the subsequent spectra contain offsets in both dimensions to enhance visibility. (B–D) Excerpts exploring spectral changes for the peaks of Ser-2 and Gln-3 (B), His-1 ɛ1 (C), and the upfield part (D) of the amide region during the ramp phase. (A) The spectra was recorded at 400 MHz using a 3.5-mg/mL sample of glucagon. (B–D) The spectra in were reproduced at 700 MHz using a 7.0-mg/mL sample.
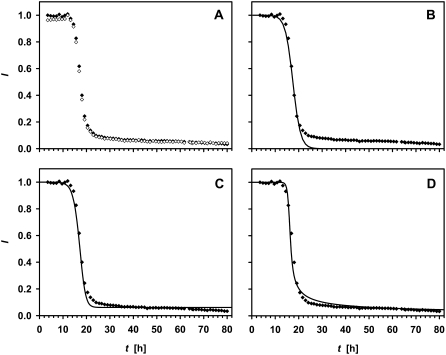
The decay of the 1D 1H liquid-state NMR signal intensities occurs after a lag time of between 0 and 100 h in a ramp phase of fast decay, which ends in a smooth asymptote to zero. The length of the ramp phase is relatively reproducible in 8 h. In Fig. 3 A, the behavior is demonstrated for the well-resolved and representative singlet of the His-1 ɛ1 proton (8.59 ppm) and for the Ala-19 Hβ signal (1.31 ppm). The sigmoidal overall decay profile for the integrated signal intensity is comparable to analogous observations by means of thioflavin T fluorescence (14,30), and it provides information about the process of aggregation. For example, it is not consistent with a model in which each collision of two free glucagon molecules leads to aggregation with a certain probability, because such a scenario would lead to an exponential rather than a sigmoidal decay of the signal. We interpret this particular shape in terms of a model in which the fibril-forming species binds predominantly to existing aggregates and aggregates fragment with a certain probability (55,56).
FIGURE 3.
(A) 1H liquid-state NMR signal intensity of the His-1 ɛ1 (open diamonds) and Ala-19 β (solid diamonds) protons as a function of time after dissolving the sample, and the attempts to fit a logistic function to the Ala-19 Hβ data without (B, line) (Eq. 4) and with (C, line) (Eq. 5) a backward rate. (D) This shows the fitting to the data of a model (line) (Eq. 9), where the trimer is the only fibril-forming species.
The velocity of fibril formation, measured as the loss of the peak intensity I, is in this model:
 |
(1) |
where [s] is the concentration of the fibril-forming species and [a] is the concentration of aggregates. Due to the lack of aggregates, the rate is initially very slow (lag phase). When a significant number of aggregates has been formed, the velocity of fibril formation increases (ramp phase), until the formation of fibrils is limited by the decreasing availability of the fibrillating species. The aggregate concentration [a] is proportional to the loss of free glucagon, as in the following:
 |
(2) |
where [f] is the total concentration of free glucagon, [f]0 is the starting concentration of free glucagon, and 1/γ is determined by the average size of the fibrils. The size is determined by the probability of fragmentation. Because the signal intensity I reflects the concentration of free molecules, one can set up the following:
 |
(3) |
where γ is merged with the proportionality factor for the collision probability to r. If all species of free glucagon can associate with the fibril, i.e., [s] = [f], Eq. 3 is formally equal to the logistic equation, except for the negative proportionality:
 |
(4) |
The origin of the time axis is shifted by the lag phase plus half of the ramp phase l to the origin of the point of symmetry of the sigmoid  which allows us to circumvent the problem of an ill-defined initial condition. If [a](t = 0) was zero, fibril formation would never start. The problem of the starting concentrations is related to the poor reproducibility of the lag phase. For the same reason, the use of preformed fibrils as seeds decreases the lag time (30). On fitting Eq. 4 to the signal intensity of the His-1 ɛ1 and Ala-19 β protons, we find l = 17.5 h and r = 0.17 M−1s−1 (Fig. 3 B). The deviation from the model during the lag phase may be explained by an instability in the measurements. Due to the change of the sample phase during the experiment, an automatic correction of field homogeneity was necessary, which was not perfectly stable at the beginning.
The discrepancy between model and experiment after the end of the ramp phase, however, cannot be neglected. To explore the origin of the relatively slow decay, we included an equilibrium between fibril-bound and free glucagon by including a backward rate constant b in Eq. 3, as shown in the following:
 |
(5) |
This model, however, does not trace the asymmetry correctly (Fig. 3 C). Moreover, the experimental data do not convincingly exhibit an asymptotic approach to an equilibrium rather than to zero.
This discrepancy reveals that a more complex model is needed to explain the experimental observations, thereby reinforcing the potential for obtaining a more detailed insight into the early stages of fibril formation through simple 1D NMR decay experiments. Motivated by earlier reports describing an equilibrium between monomer and trimer (30,48), we introduced this possibility using:
 |
(6) |
where K is the trimer formation constant, and [m] and [t] are the monomer and trimer concentrations, respectively. The free glucagon concentration is:
 |
(7) |
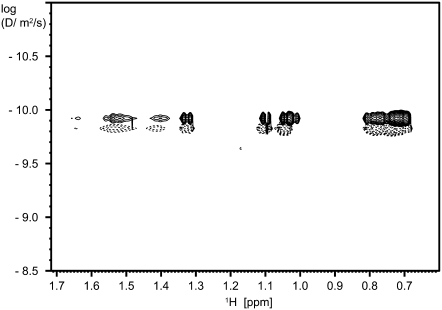
The existence of a monomer-trimer equilibrium is supported by line broadening and by diffusion experiments (Fig. 4). The equilibrium constant K can be obtained from the concentration dependence of the chemical shift (48). Our data are consistent with a K value of 60,000 M−2; this value, however, contains a relatively high uncertainty.
FIGURE 4.
DOSY spectra of a 7.0-mg/mL solution of glucagon before (solid contour lines) and toward the end of the ramp phase (dotted contour lines). Relative intensities of the lowest contour level: before, 1.00; end of ramp, 0.72.
The coexistence of a trimer population suggests the question of whether this species lies on the pathway to fibril formation or whether it is only a dead-end sideway caused by high concentrations as is common for peptides. The possibility that both species, monomer and trimer, contribute equally to fibril formation already is covered by [s] = [f] in Eq. 3, the solution of which left room for improvement.
Instead, we probed the two possibilities that either only the monomeric state ([s] = [m] in Eq. 3) or only the trimeric state ([s] = [t]) allowed binding to the fibril. To obtain an equation in [f], [m] is substituted in the former case by the real solution of the cubic equation derived from Eqs. 6 and 7,
 |
(8) |
In the latter case, [t] is substituted in advance according to Eq. 7. To facilitate a numeric integration, the lag phase problem was handled by means of an adjustable starting aggregate concentration, [a]0, rather than a time shift:
 |
(9) |
with [m] given by Eq. 8. The other fit parameter was the rate constant r. The shift of the equilibrium due to the nonlinear constant K makes the curve asymmetric. This asymmetry matches well with the behavior of the experimental data when assuming that the trimer is in the pathway. With decreasing concentration of free glucagon molecules, the equilibrium shifts toward the monomeric state, so that there are only few trimers remaining that can lead to the attachment of a glucagon molecule to a fibril (Fig. 3 D). For this model, r is found to be 21 M−1s−1. The model that assumes that only monomers attach to fibrils provides a curve similar to the case where [s] = [f], and it therefore has to be rejected. The finding above does not necessarily mean that whole trimers bind to fibrils, but that there is a binding of one or more glucagon molecules upon the collision of trimers with fibrils.
As every model, this model has to be considered as a simplification that nevertheless describes the main characteristics well. Residual deviations can be due to a nonconstant γ (e.g., by higher-order aggregation as bundling of fibrils as seen by AFM (37) and/or even the aggregation to macrostructures visible by light microscopy as shown in Fig. 1 A).
The interpretation of the variations in the 1D 1H-NMR spectra is supported by the DOSY (50) 1H-NMR spectra shown in Fig. 4. The spectra belong to a series that is monitoring the behavior throughout the formation of fibrils, starting from a concentration of 7.0 mg/mL glucagon. One spectrum is acquired before the ramp phase (Fig. 4, solid contour lines) and the other toward the end of the ramp phase (Fig. 4, dotted contour lines). All spectral components of the latter spectrum belong to molecules moving with an average diffusion coefficient of 1.5 ± 0.2 × 10⁻¹⁰ m2/s, which is a value that corresponds to a monomer. This value differs (although the difference is at the limit of the precision of the method) from that of the initial spectrum, 1.2 × 10⁻¹⁰ m2/s, which reflects the presence of a larger amount of trimers in the initial phase (25% of the signal intensity when assuming K = 60,000 M−2). The full set of DOSY spectra (not shown) shows a gradual increase in diffusion coefficients in the course of the formation of fibrils, which is in agreement with the decreasing trimer/monomer ratios at lower concentrations of free glucagon. With this setup, the DOSY experiment should be capable of identifying multimers up to ∼50 aggregated molecules. However, none of the spectra reveal any separate signals corresponding to higher-molecular-weight oligomers. The increasing diffusion coefficient and the constant coefficient of the dioxane reference also indicate that the free molecules are moving without restriction from the gel/fibril matrix formed by the emerging glucagon fibrils.
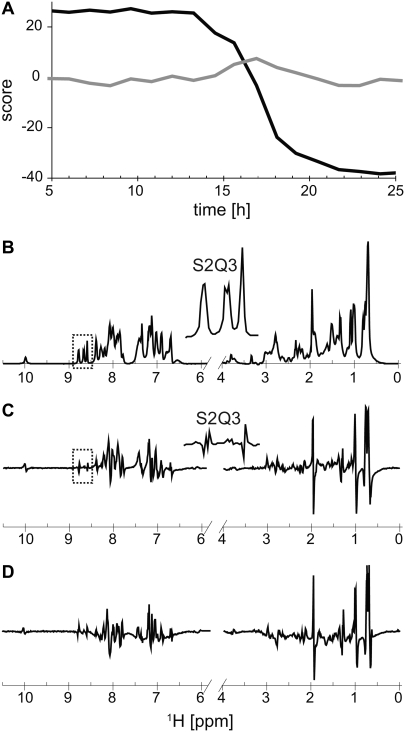
A more detailed look at the 1D spectra in Fig. 2 reveals that the various resonances throughout the spectrum behave differently in terms of their linewidth. The linewidth of the His-1 ɛ1 1H-resonance (Fig. 2 C) remains constant throughout the experiment. This is also the case for all other signals stemming from the six N-terminal residues as demonstrated for Ser-2, Gln-3, and Thr-5 in Fig. 2, B and D, which shows excerpts from 1H-spectra reproduced at 700 MHz (all spectra in Fig. 2, B–D were performed at a concentration of 7.0 mg/mL glucagon rather than 3.5 mg/mL and the lag time in this case was very short). In agreement with the translational motion properties measured above in the DOSY experiments, the rotational molecular tumbling, and so the linewidth of these signals, appear not to be affected by the viscosity of the solution. The signals assigned to the other residues of glucagon display a more complex behavior. In addition to the amide proton resonance of Thr-5, Fig. 2 D shows the amide signals of several residues between number 12 and 29. Whereas the intensities of these signals also show a sigmoidal decrease, their linewidths change significantly. Directly after sample preparation, the signals of the bulk residues are broad and overlapping, whereas they begin to resolve after 13 h, corresponding to the middle of the ramp phase. This finding may seem counterintuitive at first glance, but it is consistent with the nucleated growth mechanism and the existence of a monomer-trimer equilibrium. Arbitrary aggregation would lead to a broadening of lines over time due to growing size of the aggregates, whereas nucleated growth mechanism does not lead to such a broadening. On the contrary, the initial line broadening is due to exchange between monomers and trimers (48) and, as the concentration of residual free glucagon drops due to adsorption, there is less exchange. After 24 h, the spectrum is very similar to a spectrum of a freshly prepared glucagon sample of low concentration (≤1.4 mg/mL).
This explanation implies that there is no exchange between monomers and fibrils or protofibrils on a timescale that would lead to line broadening, i.e., the range of micro- to milliseconds (in that case, line broadening would not be strongest in the absence of fibrils, i.e., in a freshly prepared sample). Narayanan and Reif (57) recently reported exchange between monomers and high mass oligomers for the peptide Aβ1–40 by means of saturation transfer difference (58), a finding that we could not reproduce for glucagon (data not shown).
To facilitate discussion and description in the following sections, we will use the term “free glucagon” for the concentration-dependent equilibrium state involving monomers and trimers.
To further evaluate the possibility of a buildup of minor spectral components, such as those from larger oligomers at low concentrations, we took advantage of PCA (51) for unbiased evaluation of correlated spectral variation in large data sets. Fig. 5 A presents the results from PCA of the 1D spectra series in Fig. 2 A. PCA eliminates redundant information in the data set and filters noise by describing the correlated variation within the data set by a relatively small number of loadings and scores instead of a large number of frequencies and intensities. The loading for the first principal component (PC1) describes the correlated spectral variation that explains most of the variance in the data set. The associated scores describe the amount of the loading present in each spectrum relative to the mean spectrum. The second principal component (PC2) describes the correlated spectral variation once the variation explained by PC1 is removed, and so forth. PC1 accounts for 98.3% of the variance between the spectra throughout fibril formation. The evolution of the score (Fig. 5 A) for PC1 with time basically describes the decrease in peptide concentration during the fibril formation process as shown in Figs. 2 and 3. The loadings of PC1 (Fig. 5 B) are virtually identical to the spectrum for the initial state. PC2 explains 1.0%, which is most of the remaining variance. The loading for PC2 (Fig. 5 C) includes both negative and positive signals, indicating peak movement and/or changes in line shape. This is consistent with the changes in the spectra as the monomer-trimer equilibrium shifts with the decreasing concentration of free glucagon upon fibril formation (as shown in the excerpts in Fig. 2, B and C. Note the contribution to PC2 from Ser-2, which moves as a function of time, and the negligible contribution from Gln-3, which does not move with time. A weighted difference spectrum between NMR-visible glucagon before and after fibril formation (Fig. 5 D) is very similar to the loadings for PC2, which demonstrates that this principal component describes changes that occur throughout the experiment, as described above, and not the appearance of an additional intermediate state. The scores of this component show a peak in the middle of the ramp phase (Fig. 5 A), indicating that the major change in the monomer/trimer ratio occurs in this period during which the concentration of free glucagon rapidly decreases because the free glucagon attaches to fibrils. None of the higher principal components, the total of which explains the remaining 0.7% of the variation, showed any systematic changes of the scores with time. We therefore were unable to find evidence for any NMR-observable intermediates other than the proposed monomer-trimer free glucagon components observed with PCA.
FIGURE 5.
PCA of the spectra series in Fig. 2 A. (A) Scores of the principal components PC1 (black) and PC2 (gray) as a function of experiment time. (B and C) Loadings of PC1 (B) and PC2 (C). (D) Weighted difference between spectra acquired at the beginning and the end of the experiment (end to beginning). The scores are scaled so that the relative variance of the scores reflects the relative variance in the PCs. The insets in B and C show blowups of the loadings corresponding to the amide protons of Ser-2 and Gln-3.
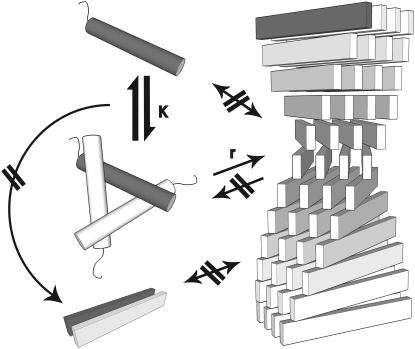
Overall, this analysis led us to a model of nucleated growth mechanism that is illustrated schematically in Fig. 6. With respect to the nucleated growth, it is compatible to a model recently discussed by Collins et al. (55) in the context of prion fibril formation. The nucleated growth model suggests that there is a higher binding affinity of free molecules (trimers, in the context of our study) of glucagon to already existing fibrillar structures, rather than an affinity for mutual binding that could result in the buildup of larger oligomers. There are no larger intermediates detectable. On the side of the free molecules, there is an exchange between monomers and trimers. Only the trimers allow binding to a fibril, which is possibly due to an advantageous structure. This model does not demonstrate whether the whole trimer binds or whether it only facilitates the binding of one molecule. Furthermore, the model suggests a certain probability of fibril fragmentation of fibrils.
FIGURE 6.
Model of a fibril aggregation pathway compatible with the sigmoidal decay and lack of evidence of higher-order oligomers. Monomers and trimers coexist in an equilibrium given by K. The data show a sigmoidal decay during fibril formation (Fig. 3), which indicates a preferential binding of molecules to existing fibrils (nucleated growth). Only the trimers add to existing fibrils with the rate r, as concluded from the asymmetry of the decay curve (Fig. 3 D). There is no measurable off-rate from the fibrils, as the signal intensity approaches asymptotically zero (Fig. 3 C).
In the following section, aspects of fibril formation will be discussed on the submolecular level.
Secondary structure
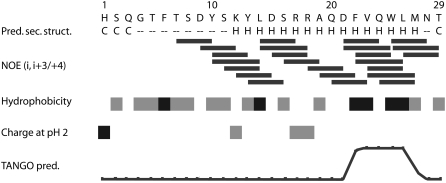
The folding/unfolding and structural rearrangement processes during fibril formation are an intensely debated topic in the literature (1). This debate involves discussion of structural features with the highest propensity for fibril formation (59) and exposure of these features during “prefibril” structural rearrangements, and so on. To gain further insight into the secondary structure of free glucagon molecules in the initial phase of the aggregation, we identified medium-range crosspeaks of a NOESY spectrum of a fresh sample of 7.0-mg/mL concentration. There is a large number of crosspeaks between residues i and i + 3 or i + 4 for the residues ranging from Ser-9 until the C-terminus, as illustrated in the diagram in Fig. 7, along with secondary structure, hydrophobicity, charge, and fibril formation predictions, all of which are residue-specific characteristics commonly discussed in relation to fibril formation. The long-range NOE crosspeak pattern provides strong evidence for a stable α-helical structure as supported by the secondary structure prediction. This is consistent with the crystal structure (45) showing an α-helical structure in this part of the molecule. By definition, amyloid fibrils, however, are aggregates with a typical β-strand structure. The question, then, arises: at what stage is the β-strand structure established, if glucagon is mainly α-helical?
FIGURE 7.
Medium-range NOEs of glucagon in comparison with the secondary structure prediction (70), hydrophobicity (71), charge, and aggregation propensity according to TANGO prediction (67). Secondary structure labels: helix (H); coil (C, all other than α-helix or β-strand); dashes represent no sufficiently reliable prediction. Hydrophobicity: >0.8 (black), −0.2– 0.65 (gray), and <−0.4 (white). Charge at pH 2: +2 (black), +1 (gray), and 0 (white).
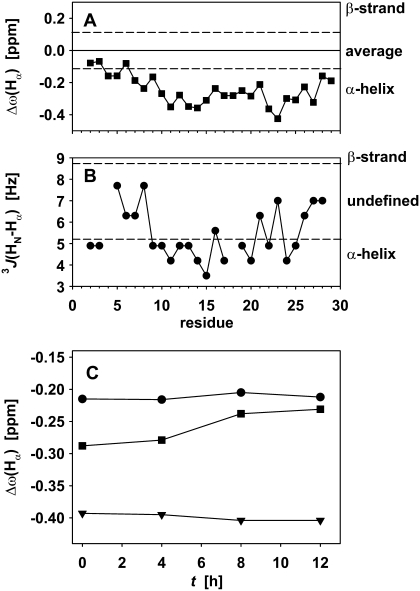
In addition to NOE crosspeak signatures, NMR provides further possibilities to determine the secondary structure, which may be easier to quantify throughout the fibril formation process. The easiest evidence can be obtained from the chemical shift of the Hα protons (60), and the J coupling between HN and Hα, which reflects the dihedral angle φ (61). Fig. 8 A shows the secondary chemical shift, i.e., the deviation from the amino acid–specific random coil average (62), for the Hα resonances that could be resolved in a 1H-TOCSY experiment for a fresh sample at 1.4 mg/mL glucagon. Fig. 8 B shows the corresponding 3J(HN,Hα) coupling constants. Both are clearly indicative of an α-helical structure for the bulk of the dilute sample, whereas the N-terminus in particular gives—like in the NOESY crosspeak pattern—no consistent helical structure. It should be noted that only a consistent secondary shift of several residues of >0.1 ppm can be interpreted as evidence for a secondary structure.
FIGURE 8.
(A) Secondary chemical shift, as the difference of the frequency of the Hα proton to the random coil average value for the amino acid type, for 7.0 mg/mL glucagon. (B) J coupling between amide and α-proton. Dashed lines show the generally accepted limits for the different secondary structure elements in A and B. (C) Development of the secondary chemical shift of the observed signals over the ramp phase of fibril formation. Ser-8 (dots), Leu-14 (triangles), and Gln-20 (squares).
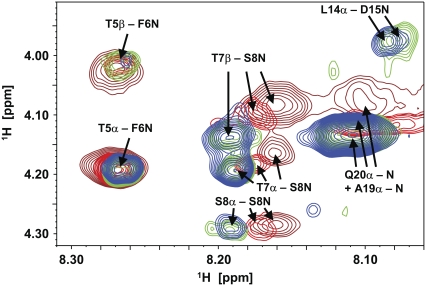
To identify changes in the secondary structure of the “liquid-state NMR observable” parts of the glucagon sample upon fibril formation, an excerpt of the fingerprint region of a NOESY spectrum of a 7.0-mg/mL sample as a function of time during aging was examined (Fig. 9). Again, there was no sign of additional peaks stemming from another conformation building up during this period of measurement; the same observation applied to the corresponding TOCSY spectrum. A potential change in conformation could be observed only by a gradual shift of the peaks, representing the average of two (or more) conformations. Generally, the shifts of the peak positions become more pronounced for the residues from Thr-7 onward than for the N-terminus, and they are more pronounced for the HN proton than for the Hα proton. Due to spectral overlap, the time variation of the Hα chemical shift could be extracted only for nine residues, three of which are shown in Fig. 8 C. Except for Gln-20, there are no significant changes that could indicate changes toward a β-strand conformation for the observable part of the sample. This result supports the model in which free glucagon attaches directly to bigger aggregates, the size of which immediately renders them undetectable by liquid-state NMR. There is no evidence of a degenerative misfolding of monomers preceding fibril formation, as discussed in the context of various fibril-forming systems (1). Note, however, that many of these fibril-forming systems, in contrast to glucagon, are globular proteins of at least 100 residues with well-defined tertiary structures. Our findings indicate that the α-helical structure in the C-terminal part of the molecule is preserved through the initial phases of fibril formation and that the conversion from α-helical secondary structure to β-strands occurs, at the earliest, upon or after attachment of the free glucagon to the fibril aggregate. At that point, it is no longer visible by liquid-state NMR. This interpretation leaves unanswered the question of how the free glucagon binds to the aggregate while remaining mainly in an α-helical conformation. The following deuterium exchange experiment could provide an answer.
FIGURE 9.
Excerpts of a series of NOESY spectra acquired subsequently during the ramp phase of glucagon fibril formation. Brown contour lines represent 30 min–4 h 30 min after preparation of a 7.0-mg/mL sample, His-1 ɛ1 peak intensity in a 1D reference spectrum acquired before the NOESY spectra: 100%. Red represents 4 h 45 min − 8 h 45 min (70%). Green represents 9–13 h (25%). Blue represents 13 h 15 min − 17 h 15 min (15%). The scaling was adjusted to compensate for the different polarization loss during the 2D pulse sequence due to faster relaxation in the first spectra. The relative scales of the lowest contour line are 0.4 (brown); 0.5 (red); 0.85 (green); and 1.0 (blue).
Deuterium exchange
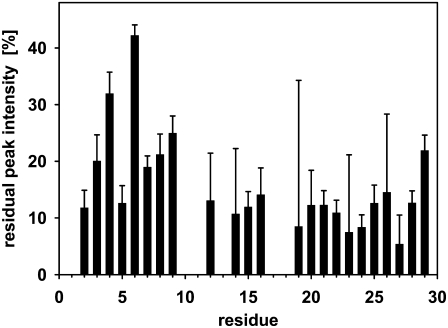
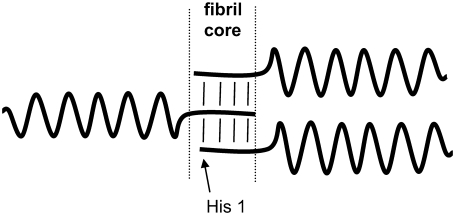
To identify the parts of the glucagon molecule that participate in the formation of fibrils and the parts that may be more flexible and accessible to the surrounding water phase, we subjected mature fibrils to hydrogen/deuterium exchange of amide hydrogens over 24 h. For subsequent liquid-state NMR analysis, the fibrils were dissolved in trifluoroacetic acid to form free glucagon and solubilized in DMSO (63) while preserving the attained protection pattern. This process has been described previously in the contexts of HET-S, β2-microglobulin, and PrP (23,49,64). The 1H-NMR spectra then will reveal higher residual intensity (or lower signal loss) for amide hydrogens of residues buried in the fibril and so, to a lesser extent, substituted by deuterium. The exchange data in Fig. 10 show that the flexible N-terminus has retained the most signal intensity, thus displaying the best protection toward deuterium exchange. In this region, the amide groups have preserved their hydrogen to >20% on average, whereas the remainder of the peptide only has ∼10% hydrogen remaining. A plausible explanation for this finding could be that the nonstructured N-terminus forms the β-stranded core of the fibrils, as illustrated schematically in Fig. 11. This conclusion would support a model in which only a fraction of the peptide is responsible for fibril formation, whereas the remainder of the peptide is packed without intermolecular bonds (and potentially with preserved α-helical structure as shown in Fig. 11), which has been discussed previously in the context of several other fibril-forming proteins (1). With specific attention to the N-terminus, it is interesting to note that the highly charged histidine is believed to play a role in the fibril formation process in several cases (65,66), and the first amino acid of the N-terminus of glucagon is a histidine. The model in Fig. 11 contradicts the likelihood of building intermolecular bindings to initiate aggregation as predicted by the software TANGO (http://tango.crg.es/) (67). As shown in Fig. 7, the TANGO algorithm gives the highest scores to a part close to the C-terminus, where glucagon has a hydrophobic patch without charged residues. This region forms the intermolecular binding site in the trimer crystal structure (45). Pedersen et al. (68) also found that the TANGO predictions are not fully consistent with the effects of mutations in the glucagon sequence in relation to fibril formation. Indeed, they observed that both N- and C-terminal residues are involved in the fibril formation process (68). This is also supported by the predictions of a more recent algorithm, the prediction of amyloid structure aggregation or PASTA (http://protein.cribi.unipd.it/pasta/) (69), which shows a propensity for the formation of anti-parallel β-strands between residues 2–10 (C.B. Andersen, Novo Nordisk, personal communication, 2007).
FIGURE 10.
Exchange of amide protons with deuterium in glucagon fibrils. The higher the residual signal, the less accessible the amide proton is.
FIGURE 11.
Hypothetical model of glucagon aggregation to fibrils compatible with the H/D exchange experiment in conjunction with the 1H liquid-state NMR information on free glucagon. The N-termini form the core of the fibrils (presumably in the form of β-strands, as indicated by strong participation in amide hydrogen-bonding, but not revealed in terms of secondary structure from our NMR experiments). The orientation could also be parallel.
The hypothetical model in Fig. 11 offers an alternative or additional explanation as to why we did not detect any signs of a conformational change away from the α-helical structure for the major part of glucagon, neither through secondary chemical shifts nor reduction of the corresponding NOEs. In this model, the α-helix does not contribute to intermolecular binding and remains preserved, at least during the very early stage of aggregation. We emphasize that the NMR data do not exclude that the helix is unraveled and so subject to a transition to a β-sheet conformation after the attachment of glucagon to a fibrillar nucleus. The hypothesis, however, would provide an answer to the obvious question of how a peptide of predominant and stable helical structure can form β-stranded fibrils.
CONCLUSIONS
Based on liquid-state NMR experiments, this work sets up hypotheses for the formation of fibrils by the example of the peptide hormone glucagon in terms of pathways, kinetics, and the fibril core. Except for signals from a concentration-dependent monomer-trimer equilibrium, there are no signals of intermediate oligomer states visible by liquid-state NMR during fibril formation of glucagon. The sigmoidal kinetics of fibril formation, which is observable by the decay of peak intensities, indicates a process whereby free glucagon molecules bind directly to bigger aggregates rather than to other free molecules. Most interestingly, our observations are compatible with a model in which the fibril-forming species is the trimer. From liquid-state NMR data, we do not observe any sign of conversion from α-helix to β-strand conformation before binding to bigger aggregates. There is an indication that the N-terminus, which has no distinct secondary structure in free glucagon, forms intermolecular β-strands and thus builds the core of the fibrils. Because of the absence of intermediate states in size and concentration allowing detection by liquid-state NMR, solid-state NMR spectroscopy on isotope-labeled samples would be a natural next step for a more detailed structural analysis of glucagon fibrils on an atomic level. Furthermore, the obvious importance of the trimer implies the question whether its structure in solution complies with its triangular crystal structure.
Acknowledgments
The authors thank Dr. Hans Aage Hjuler and his colleagues at Novo Nordisk A/S (Bagsværd, Denmark) for providing us with samples of glucagon and ongoing support of our glucagon research and Christian Beyschau Andersen (Novo Nordisk A/S) for many helpful discussions.
This work was supported by the Danish National Research Foundation, Carlsbergfondet, the Danish Natural Science Research Council, and the Danish Biotechnological Instrument Centre. We acknowledge use of the 800-MHz NMR spectrometer at the Danish Center for Macromolecular NMR spectroscopy at the Carlsberg Laboratory.
Editor: Heinrich Roder.
References
- 1.Chiti, F., and F. M. Dobson. 2006. Protein misfolding, functional amyloid, and human disease. Annu. Rev. Biochem. 75:333–366. [DOI] [PubMed] [Google Scholar]
- 2.Caughey, B., and P. T. Lansbury Jr. 2003. Protofibrils, pores, fibrils, and neurodegeneration: separating the responsible protein aggregates from the innocent bystanders. Annu. Rev. Neurosci. 26:267–298. [DOI] [PubMed] [Google Scholar]
- 3.Tycko, R. 2006. Molecular structure of amyloid fibrils: insights from solid-state NMR. Q. Rev. Biophys. 39:1–55. [DOI] [PubMed] [Google Scholar]
- 4.Sipe, J. D., and A. S. Cohen. 2000. Review: history of the amyloid fibril. J. Struct. Biol. 130:88–98. [DOI] [PubMed] [Google Scholar]
- 5.Frokjaer, S., and D. E. Otzen. 2005. Protein drug stability: a formulation challenge. Nat. Rev. Drug. Disc. 4:298–306. [DOI] [PubMed] [Google Scholar]
- 6.Dobson, C. M. 2003. Protein folding and misfolding. Nature. 426:884–890. [DOI] [PubMed] [Google Scholar]
- 7.Ellis, R. J., and T. J. T. Pinheiro. 2002. Medicine: danger misfolding proteins. Nature. 416:483–484. [DOI] [PubMed] [Google Scholar]
- 8.Naiki, H., N. Hashimoto, S. Suzuki, H. Kimura, K. Nakakuki, and F. Gejyo. 1997. Establishment of a kinetic model of dialysis-related amyloid fibril extension in vitro. Amyloid. 4:223–232. [Google Scholar]
- 9.Serio, T. R., A. G. Cashikar, A. S. Kowal, G. J. Sawicki, J. J. Moslehi, L. Serpell, M. F. Arnsdorf, and S. L. Lindquist. 2000. Nucleated conformational conversion and the replication of conformational information by a prion determinant. Science. 289:1317–1321. [DOI] [PubMed] [Google Scholar]
- 10.Uversky, V. N., J. Li, P. Souillac, I. S. Millett, S. Doniach, R. Jakes, M. Goedert, and M. L. Fink. 2002. Biophysical properties of the synucleins and their propensities to fibrillate: inhibition of α-synuclein assembly by β- and γ-synucleins. J. Biol. Chem. 277:11970–11978. [DOI] [PubMed] [Google Scholar]
- 11.Pedersen, J. S., G. Christensen, and D. E. Otzen. 2004. Modulation of S6 fibrillation by unfolding rates and gatekeeper residues. J. Mol. Biol. 341:575–588. [DOI] [PubMed] [Google Scholar]
- 12.Zandomeneghi, G., M. R. H. Krebs, M. G. McCammon, and M. Fändrich. 2004. FTIR reveals structural differences between native β-sheet proteins and amyloid fibrils. Protein Sci. 13:3314–3321. [DOI] [PMC free article] [PubMed] [Google Scholar]
- 13.Bouchard, M., J. Zurdo, E. J. Nettleton, C. M. Dobson, and C. V. Robinson. 2000. Formation of insulin amyloid fibrils followed by FTIR simultaneously with CD and electron microscopy. Protein Sci. 9:1960–1967. [DOI] [PMC free article] [PubMed] [Google Scholar]
- 14.Pedersen, J. S., D. Dikov, J. L. Fink, H. A. Hjuler, G. Christiansen, and D. E. Otzen. 2006. The changing face of glucagon fibrillation: structural polymorphism and conformational imprinting. J. Mol. Biol. 355:501–523. [DOI] [PubMed] [Google Scholar]
- 15.Jimenez, J. L., E. J. Nettleton, M. Bouchard, C. V. Robinson, C. M. Dobson, and H. R. Saibil. 2002. The protofilament structure of insulin amyloid fibrils. Proc. Natl. Acad. Sci. USA. 99:9196–9201. [DOI] [PMC free article] [PubMed] [Google Scholar]
- 16.Khurana, R., C. Ionescu-Zanetti, M. Pope, J. Li, L. Nielson, M. Ramirez-Alvarado, L. Regan, A. L. Fink, and S. A. Carter. 2003. A general model for amyloid fibril assembly based on morphological studies using atomic force microscopy. Biophys. J. 85:1135–1144. [DOI] [PMC free article] [PubMed] [Google Scholar]
- 17.Glenner, G. G., E. D. Eanes, H. A. Bladen, R. P. Linke, and J. D. Termine. 1974. β-pleated sheet fibrils – comparison of native amyloid with synthetic protein fibrils. J. Histochem. Cytochem. 22:1141–1158. [DOI] [PubMed] [Google Scholar]
- 18.Nelson, R., M. R. Sawaya, M. Balbirnie, A. Ø. Madsen, C. Riekel, R. Grothe, and D. Eisenberg. 2005. Structure of the cross-β spine of amyloid-like fibrils. Nature. 435:773–778. [DOI] [PMC free article] [PubMed] [Google Scholar]
- 19.Vestergaard, B., M. Groenning, M. Roessle, J. S. Kastrup, M. Van de Weert, J. M. Flink, S. Frokjaer, M. Gajhede, and D. I. Svergun. 2007. A helical structural nucleus is the primary elongating unit of insulin amyloid fibril. PLoS Biol. 5:e134. [DOI] [PMC free article] [PubMed] [Google Scholar]
- 20.Petkova, A. T., Y. Ishii, J. J. Balbach, O. N. Antzutkin, R. D. Leapman, F. Delaglio, and R. Tycko. 2002. A structural model for Alzheimer's β-amyloid fibrils based on experimental constraints from solid-state NMR. Proc. Natl. Acad. Sci. USA. 99:16742–16747. [DOI] [PMC free article] [PubMed] [Google Scholar]
- 21.Petkova, A. T., R. D. Leapman, Z. Guo, W.-M. Yau, M. P. Mattson, and R. Tycko. 2005. Self-propagating, molecular-level polymorphism in Alzheimer's β-amyloid fibrils. Science. 307:262–265. [DOI] [PubMed] [Google Scholar]
- 22.Jaroniec, C. P., C. E. MacPhee, V. S. Bajaj, M. T. McMahon, C. M. Dobson, and R. G. Griffin. 2004. High-resolution molecular structure of a peptide in an amyloid fibril determined by magic angle spinning NMR spectroscopy. Proc. Natl. Acad. Sci. USA. 101:711–716. [DOI] [PMC free article] [PubMed] [Google Scholar]
- 23.Ritter, C., M. L. Maddelein, A. B. Siemer, T. Luhrs, M. Ernst, B. H. Meier, S. J. Saupe, and R. Riek. 2005. Correlation of structural elements and infectivity of the HET-s prion. Nature. 435:844–848. [DOI] [PMC free article] [PubMed] [Google Scholar]
- 24.Heise, H., W. Hoyer, S. Becker, O. C. Andronesi, D. Riedel, and M. Baldus. 2005. Molecular-level secondary structure, polymorphism, and dynamics of full-length α-synuclein fibrils studied by solid-state NMR. Proc. Natl. Acad. Sci. USA. 102:15871–15876. [DOI] [PMC free article] [PubMed] [Google Scholar]
- 25.Eanes, E. D., and G. G. Glenner. 1968. X-ray diffraction studies on amyloid filaments. J. Histochem. Cytochem. 16:673–677. [DOI] [PubMed] [Google Scholar]
- 26.Come, J. H., P. E. Fraser, and P. T. Lansbury, Jr. 1993. A kinetic model for amyloid formation in the prion diseases: importance of seeding. Proc. Natl. Acad. Sci. USA. 90:5959–5963. [DOI] [PMC free article] [PubMed] [Google Scholar]
- 27.Jarrett, J. T., and P. T. Lansbury, Jr. 1992. Amyloid fibril formation requires a chemically discriminating nucleation event: studies of an amyloidogenic sequence from the bacterial protein OsmB. Biochemistry. 31:12345–12352. [DOI] [PubMed] [Google Scholar]
- 28.Colon, W., and J. W. Kelly. 1992. Partial denaturation of transthyretin is sufficient for amyloid fibril formation in vitro. Biochemistry. 31:8654–8660. [DOI] [PubMed] [Google Scholar]
- 29.Carulla, N., G. L. Caddy, D. R. Hall, J. Zurdo, G. M. Feliz, E. Giralt, C. V. Robison, and C. M. Dobson. 2005. Molecular recycling within amyloid fibrils. Nature. 436:554–558. [DOI] [PubMed] [Google Scholar]
- 30.Andersen, C. B., D. Otzen, G. Christiansen, and C. Rischel. 2007. Glucagon amyloid-like fibril morphology is selected via morphology-dependent growth inhibition. Biochemistry. 46:7314–7324. [DOI] [PubMed] [Google Scholar]
- 31.Chiti, F., M. Stefani, N. Taddei, G. Ramponi, and C. M. Dobson. 2003. Rationalization of the effects of mutations on peptide and protein aggregation rates. Nature. 424:805–808. [DOI] [PubMed] [Google Scholar]
- 32.Hartley, D. M., D. M. Walsh, C. P. Ye, T. Diehl, S. Vasquez, P. M. Vassilev, D. B. Teplow, and D. J. Selkoe. 1999. Protofibrillar intermediates of amyloid β-protein induce acute electrophysiological changes and progressive neurotoxicity in cortical neurons. J. Neurosci. 19:8876–8884. [DOI] [PMC free article] [PubMed] [Google Scholar]
- 33.Baskakov, I. V., G. Legname, M. A. Baldwin, S. B. Prusiner, and F. E. Cohen. 2002. Pathway complexity of prion protein assembly into amyloid. J. Biol. Chem. 277:21140–21148. [DOI] [PubMed] [Google Scholar]
- 34.Soto, C., L. Estrada, and J. Castilla. 2006. Amyloids, prions and the inherent infectious nature of misfolded protein aggregates. Trends Biochem. Sci. 31:150–155. [DOI] [PubMed] [Google Scholar]
- 35.Hovgaard, M. B., M. Dong, D. E. Otzen, and F. Besenbacher. 2007. Quartz crystal microbalance studies of multilayer glucagon fibrillation at the solid-liquid interface. Biophys. J. 93:2162–2169. [DOI] [PMC free article] [PubMed] [Google Scholar]
- 36.De Jong, K. L., B. Incledon, C. M. Yip, and M. R. DeFelippis. 2006. Amyloid fibrils of glucagon characterized by high-resolution atomic force microscopy. Biophys. J. 91:1905–1914. [DOI] [PMC free article] [PubMed] [Google Scholar]
- 37.Dong, M. D., M. B. Hovgaard, S. L. Xu, D. E. Otzen, and F. Besenbacher. 2006. AFM study of glucagon fibrillation via oligomeric structures resulting in interwoven fibrils. Nanotechnology. 17:4003–4009. [DOI] [PubMed] [Google Scholar]
- 38.Stigsnaes, P., S. Frokjaer, S. Bjerregaard, M. van de Weert, P. Kingshott, and E. H. Moeller. 2007. Characterisation and physical stability of PEGylated glucagon. Int. J. Pharm. 330:89–98. [DOI] [PubMed] [Google Scholar]
- 39.Onoue, S., K. Ohshima, K. Debari, K. Koh, S. Shioda, S. Iwasa, K. Kashimoto, and T. Yajima. 2004. Mishandling of the therapeutic peptide glucagon generates cytotoxic amyloidogenic fibrils. Pharm. Res. 21:1274–1283. [DOI] [PubMed] [Google Scholar]
- 40.Kimball, C. P., and J. R. Murlin. 1923. Aqueous extracts of pancreas III. Some precipitation reactions of insulin. J. Biol. Chem. 58:337–348. [Google Scholar]
- 41.De Duve, C. 1953. Glucagon; the hyperglycaemic glycogenolytic factor of the pancreas. Lancet. 265:99–104. [DOI] [PubMed] [Google Scholar]
- 42.Hall-Boyer, K., G. P. Zaloga, and B. Chernow. 1984. Glucagon: hormone or therapeutic agent? Crit. Care Med. 12:584–589. [PubMed] [Google Scholar]
- 43.Beaven, G. H., W. B. Gratzer, and H. G. Davies. 1969. Formation and structure of gels and fibrils from glucagon. Eur. J. Biochem. 11:37–42. [DOI] [PubMed] [Google Scholar]
- 44.Moran, E. C., P. Y. Chou, and G. D. Fasman. 1977. Conformational transitions of glucagon in solution: the α to β transition. Biochem. Biophys. Res. Commun. 77:1300–1306. [DOI] [PubMed] [Google Scholar]
- 45.Sasaki, K., S. Dockerill, D. A. Adamiak, I. J. Tickle, and T. Blundell. 1975. X-ray analysis of glucagon and its relationship to receptor binding. Nature. 257:751–757. [DOI] [PubMed] [Google Scholar]
- 46.Bösch, C., A. Bundi, M. Oppliger, and K. Wüthrich. 1978. 1H nuclear magnetic resonance studies of the molecular conformation of monomeric glucagon in aqueous solution. Eur. J. Biochem. 91:204–214. [DOI] [PubMed] [Google Scholar]
- 47.Braun, W., G. Wider, K. H. Lee, and K. Wüthrich. 1983. Conformation of glucagon in a lipid-water interphase by 1H nuclear magnetic resonance. J. Mol. Biol. 169:921–948. [DOI] [PubMed] [Google Scholar]
- 48.Wagman, M. E., C. M. Dobson, and M. Karplus. 1980. Proton NMR studies of the association and folding of glucagon in solution. FEBS Lett. 119:265–270. [DOI] [PubMed] [Google Scholar]
- 49.Hoshino, M., H. Katou, Y. Hagihara, K. Hasegawa, H. Naiki, and Y. Goto. 2002. Mapping the core of the β (2)-microglobulin amyloid fibril by H/D exchange. Nat. Struct. Biol. 9:332–336. [DOI] [PubMed] [Google Scholar]
- 50.Morris, K. F., and C. S. Johnson. 1992. Diffusion-ordered two-dimensional nuclear magnetic resonance spectroscopy. J. Am. Chem. Soc. 114:3139–3141. [Google Scholar]
- 51.Spearman, C. H. 1904. General intelligence objectivity determined and measured. Am. J. Psychol. 15:201–293. [Google Scholar]
- 52.The R project for statistical computing. Web-page: http://www.r-project.org/index.html
- 53.Claessen, D., R. Rink, W. de Jong, J. Siebring, P. de Vreugd, F. G. Boersma, L. Dijkhuizen, and H. A. Wosten. 2003. A novel class of secreted hydrophobic proteins is involved in aerial hyphae formation in Streptomyces coelicolor by forming amyloid-like fibrils. Genes Dev. 17:1714–1726. [DOI] [PMC free article] [PubMed] [Google Scholar]
- 54.Ippel, J. H., A. Olofsson, J. Schleucher, E. Lundgren, and S. S. Wijmenga. 2002. Probing solvent accessibility of amyloid fibrils by solution NMR spectroscopy. Proc. Natl. Acad. Sci. USA. 99:8648–8653. [DOI] [PMC free article] [PubMed] [Google Scholar]
- 55.Collins, S. R., A. Douglass, R. D. Vale, and J. S. Weissman. 2004. Mechanism of prion propagation: amyloid growth occurs by monomer addition. PLoS Biol. 2:e321. [DOI] [PMC free article] [PubMed] [Google Scholar]
- 56.Smith, J. F., T. P. J. Knowles, C. M. Dobson, C. E. MacPhee, and M. E. Welland. 2006. Characterization of the nanoscale properties of individual amyloid fibrils. Proc. Natl. Acad. Sci. USA. 103:15806–15811. [DOI] [PMC free article] [PubMed] [Google Scholar]
- 57.Narayanan, S., and B. Reif. 2005. Characterization of chemical exchange between soluble and aggregated states of β-amyloid by solution-state NMR upon variation of salt conditions. Biochemistry. 44:1444–1452. [DOI] [PubMed] [Google Scholar]
- 58.Mayer, M., and B. Meyer. 1999. Characterization of ligand binding by saturation transfer difference NMR spectroscopy. Angew. Chem. Int. Ed. 38:1784–1788. [DOI] [PubMed] [Google Scholar]
- 59.Pawar, A. P., K. F. DuBay, J. Zurdo, F. Chiti, M. Vendruscolo, and C. M. Dobson. 2005. Prediction of “aggregation-prone” and “aggregation-susceptible” regions in proteins associated with neurodegenerative diseases. J. Mol. Biol. 350:379–392. [DOI] [PubMed] [Google Scholar]
- 60.Wishart, D. S., B. D. Sykes, and F. M. Richards. 1992. The chemical shift index: a fast and simple method for the assignment of protein secondary structure through NMR spectroscopy. Biochemistry. 31:1647–1651. [DOI] [PubMed] [Google Scholar]
- 61.Karplus, M. 1959. Contact electron-spin coupling of nuclear magnetic moments. J. Chem. Phys. 30:11–15. [Google Scholar]
- 62.Schwarzinger, S., G. J. A. Kroon, T. R. Foss, J. Chung, P. E. Wright, and H. J. Dyson. 2001. Sequence-dependent correction of random coil NMR chemical shifts. J. Am. Chem. Soc. 123:2970–2978. [DOI] [PubMed] [Google Scholar]
- 63.Zhang, Y. Z., Y. Paterson, and H. Roder. 1995. Rapid amide proton exchange rates in peptides and proteins measured by solvent quenching and two-dimensional NMR. Protein Sci. 4:804–814. [DOI] [PMC free article] [PubMed] [Google Scholar]
- 64.Kuwata, K., T. Matumoto, H. Cheng, K. Nagayama, T. L. James, and H. Roder. 2003. NMR-detected hydrogen exchange and molecular dynamics simulations provide structural insight into fibril formation of prion protein fragment 106–126. Proc. Natl. Acad. Sci. USA. 100:14790–14795. [DOI] [PMC free article] [PubMed] [Google Scholar]
- 65.Dong, J., J. M. Canfield, A. K. Mehta, J. E. Shokes, B. Tian, W. S. Childers, J. A. Simmons, Z. Mao, R. A. Scott, K. Warncke, and D. G. Lynn. 2007. Engineering metal ion coordination to regulate amyloid fibril assembly and toxicity. Proc. Natl. Acad. Sci. USA. 104:13313–13318. [DOI] [PMC free article] [PubMed] [Google Scholar]
- 66.Gaggelli, E., N. D'Amelio, D. Valensin, and G. Valensin. 2003. 1H NMR studies of copper binding by histidine-containing peptides. Magn. Reson. Chem. 41:877–883. [Google Scholar]
- 67.Fernandez-Escamilla, A. M., F. Rousseau, J. Schymkowitz, and L. Serrano. 2004. Prediction of sequence-dependent and mutational effects on the aggregation of peptides and proteins. Nat. Biotechnol. 22:1240–1241. [DOI] [PubMed] [Google Scholar]
- 68.Pedersen, J. S., D. Dikov, and D. E. Otzen. 2006. N- and C-terminal hydrophobic patches are involved in fibrillation of glucagon. Biochemistry. 45:14503–14512. [DOI] [PubMed] [Google Scholar]
- 69.Trovato, A., F. Chiti, A. Maritan, and F. Seno. 2006. Insight into the structure of amyloid fibrils from the analysis of globular proteins. PLoS Comp. Biol. 2:e170. [DOI] [PMC free article] [PubMed] [Google Scholar]
- 70.Rost, B., and C. Sander. 1993. Prediction of protein secondary structure at better than 70% accuracy. J. Mol. Biol. 232:584–599. [DOI] [PubMed] [Google Scholar]
- 71.Eisenberg, D., R. M. Weiss, T. C. Terwilliger, and W. Wilcox. 1982. Hydrophobic moments and protein structure. Faraday Symp. Chem. Soc. 17:109–120. [Google Scholar]


