

Abstract
Unitary potential (UP) depolarizations are the basic intracellular events responsible for pacemaker activity in interstitial cells of Cajal (ICCs), and are generated at intracellular sites termed “pacemaker units”. In this study, we present a mathematical model of the transmembrane ion flows and intracellular Ca2+ dynamics from a single ICC pacemaker unit acting at near-resting membrane potential. This model quantitatively formalizes the framework of a novel ICC pacemaking mechanism that has recently been proposed. Model simulations produce spontaneously rhythmic UP depolarizations with an amplitude of ∼3 mV at a frequency of 0.05 Hz. The model predicts that the main inward currents, carried by a Ca2+-inhibited nonselective cation conductance, are activated by depletion of sub-plasma-membrane [Ca2+] caused by sarcoendoplasmic reticulum calcium ATPase Ca2+ sequestration. Furthermore, pacemaker activity predicted by our model persists under simulated voltage clamp and is independent of [IP3] oscillations. The model presented here provides a basis to quantitatively analyze UP depolarizations and the biophysical mechanisms underlying their production.
INTRODUCTION
Phasic gastrointestinal (GI) muscle tissue generates rhythmic contractions without input from the enteric nervous system (1). The electrical activity that coordinates these contractions is termed “slow waves.” Originally thought to be an intrinsic property of smooth muscle cells (SMCs) (2), slow waves are now known to originate from a specialized group of pacemaker cells called interstitial cells of Cajal (ICCs). This conclusion was based in part on experimental investigations wherein GI tissue lacking an intact ICC network failed to produce slow-wave electrical activity (3–5).
Slow waves generated by ICCs, also referred to in the literature as pacemaker potentials (PP), conduct via gap junctions to SMC, activating L-type Ca2+ channels, Ca2+ influx, and contraction of muscle cells (4–6). Full slow waves result from the summation of a large number of small-amplitude and localized cellular membrane fluctuations, known as unitary potentials (UPs), which have been detected in many GI muscles (7–10). UPs are thus the elementary events responsible for ICC pacemaker activity, and hence are fundamental in driving coordinated GI muscle contractions.
Despite the importance of UPs in generating ICC pacemaker activity, controversy remains as to the biophysical mechanisms and processes underlying their production (see discussion in Sanders et al. (11)). Studies on intact muscle strips, in which the activity of ICCs cannot be isolated, have suggested a variety of mechanisms for pacemaker activity (7,12–14). Pharmacological and ultrastructural experimental studies performed on ICCs over the last two decades have led to the formation of a novel pacemaking hypothesis (11,15). This hypothesis, which we will refer to henceforth as the Sanders pacemaking hypothesis, proposes a detailed structural feature, occurring at specific sites within ICCs (termed pacemaker units), which provides a unique intracellular Ca2+-handling mechanism that appears to be fundamental to generation of spontaneous pacemaker currents.
In brief, the hypothesis states that the pacemaker cycle is initiated by release of Ca2+ from inositol-1,4,5-triphosphate-receptor (IP3R)-operated stores that are in close proximity to the plasma membrane and to mitochondria. The increase in local [Ca2+] gates opens a mitochondrial Ca2+ uptake mechanism that results in a transient reduction in [Ca2+] in the cytoplasmic microdomain of the pacemaker unit. The reduction in sub-plasma-membrane [Ca2+] activates the primary pacemaker conductance that experiments on isolated ICCs have shown to be a Ca2+-inhibited, nonselective cation conductance. The pacemaker conductance is voltage-independent, so a voltage-dependent mechanism is required to coordinate the many pacemaker units within a single ICC and within a network of ICCs. This voltage-dependent mechanism is likely to be a T-type Ca2+ conductance expressed by ICCs (16,17), which is activated by the transient depolarizations of UPs and provides a means of nonregenerative propagation of slow-wave potentials over many millimeters. For a full description of the Sanders pacemaker hypothesis, and the experimental studies that led to its formation, the reader is directed to a recent review (11).
Due to the small dimensions of the pacemaker unit, however, it is technically difficult to empirically investigate the Sanders hypothesis in a direct manner. Therefore, the application of biophysically based mathematical models provides an alternative approach to test the underlying assumptions about the pacemaker cycle. The biophysically based modeling approach has been used successfully, in combination with physiological data, for the last 40 years to investigate cardiac cellular activity (18). Compared to the cardiac field, modeling of ICC pacemaker activity is still in its infancy. Nonetheless, several investigators have created mathematical models that reproduce specific aspects of ICC pacemaker activity (12,13,19,20). A brief summary of these established ICC models is given in Table 1. From this collection, note that only the model in Edwards and Hirst (12) has a UP basis to reproduce whole-cell electrical activity. However, the UP representation they use is phenomenological and therefore is unable to capture the subcellular Ca2+-handling mechanisms thought to be involved in UP depolarizations.
TABLE 1.
Features of established ICC models
| Reference | No. of state variables | Model type* | Behavior† | Tracks ionic species | UP basis | Spatial scale |
|---|---|---|---|---|---|---|
| 19 | 2 | P | D | No | No | SC/MC |
| 12 | 5 | P | S | No | Yes | MC |
| 13 | 4 | P | D | Yes | No | SC/MC |
| 20 | 14 | B | D | Yes | No | SC |
SC, single cell; MC, multiple cells.
P, phenomenological; B; biophysically based.
D, deterministic; S, stochastic.
In this study, we integrate experimental data and the understanding of the Sanders pacemaker hypothesis to introduce the first biophysically based computational modeling framework that simulates ICC pacemaker activity on the pacemaker unit spatial scale. This modeling framework is designed to reproduce UP depolarizations from a single pacemaker unit operating at resting membrane potential (RMP), which is approximately −70 mV in ICCs (17,21). Due to the complexity of the modeling framework, we introduce each of the model components separately as follows:
Parameter estimation
Intracellular compartmental volumes
Model state variables
Plasma membrane currents
The IP3 receptor model
Other intracellular Ca2+ fluxes
Mitochondrial Ca2+ buffering
A schematic diagram of the pacemaker unit illustrating all compartmental volumes and ionic conductances, together with their respective interactions, is shown in Fig. 1.
FIGURE 1.

Schematic diagram of the ICC pacemaker unit showing all the components involved in the UP modeling framework. Displayed are the ionic conductances and their respective interactions with the intracellular organelles and cytoplasmic subspaces. The four compartmental volumes comprising the pacemaker unit are 1), the endoplasmic reticulum (ER); 2), the mitochondria; 3), the cytoplasmic subspace 1; and 4), the cytoplasmic subspace 2. The four plasma membrane currents that regulate cellular electrophysiology are 1), the inward Ca2+ current (ICa); 2), the nonselective cation conductance (INSCC); 3), the plasma membrane Ca2+-ATPase (IPM); and 4), the outward Na+ current (INa). The five Ca2+ fluxes responsible for controlling intracellular Ca2+ movement are 1), the mitochondrial Ca2+ uniporter (JMCU); 2), the mitochondrial Na+/Ca2+ exchanger (JNCX); 3), sarcoendoplasmic reticulum Ca2+-ATPase (JSERCA); 4), the IP3R Ca2+ flux (JIPR); and 5), the intercytoplasmic subspace Ca2+ flux (JS1S2). All of the components included in this model are introduced in the Model framework section. The equations describing the ionic conductances and governing the model-state variables are located in Appendix A, and all model parameter and initial-state variable values are given in Table 2.
MODEL FRAMEWORK
Parameter estimation
Where available, model parameters were either obtained by fitting to appropriate ICC experimental data or were based on values from the most appropriate alternative cell types, such as pancreatic acinar cells and sympathetic neurons. These cells were deemed to be appropriate alternatives, because, like ICCs, they are nonmuscle cells and their activity is highly dependent on cycling of intracellular Ca2+ (22,23). All model parameters ascertained in this manner are specifically stated below. The remaining model parameters, for which there was no suitable data or appropriate alternative cell type, were optimized using a nonlinear fitting approach. This fitting procedure sought to optimize parameter values such that the model response reproduced experimentally observed characteristic UP features, namely,
Amplitude, YA = 3 mV,
Half-width, YHW = 0.21s (defined as the time where membrane potential is >50% of YA),
Frequency, YF = 0.05 Hz.
The values for YA and YHW stated above were obtained from experimental data recorded in guinea pig antral tissue (9). The exact frequency of UP depolarizations in ICCs is unknown, as it is not possible to isolate electrical activity from a single pacemaker unit. Therefore, we have assumed that YF is equal to the frequency of pacemaker potential depolarizations, which is ∼3 cycles/min (or 0.05 Hz) in guinea pig antral tissue (9,21). It should be noted that although the modeling framework is based on ICC experimental data from gastric tissue, and hence is representative of UPs from this organ, the biophysical nature of the model allows for the potential applicability to GI-organ ICCs.
The optimization objective function, F, was calculated as the sum of the absolute residuals between the model and experimentally recorded characteristic values,
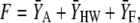 |
(1) |
where 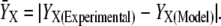
In addition to minimizing F, a further criterion was imposed on the parameters to ensure a physiological response from the model. This criterion was the enforcement of pacemaker activity cessation with the effective blocking of an individual ionic conductance, leaving the other conductances unaltered. This test was repeated for each ionic conductance within the pacemaker unit (Fig. 1). Effective blocking of an ionic conductance was simulated by setting the conductance rate to zero. To achieve a feasible parameter set that optimized F within this discrete constraint, we employed a Monte Carlo minimization algorithm (24).
Intracellular compartmental volumes
The intracellular compartmental volumes affect the concentrations of the major ionic species, and hence the pacemaker unit's ionic conductances. The spatial components used to represent the compartmental volumes within the model are based upon measurements from high-powered ICC electron micrographs (EM) (11,15). These EM studies clearly show the location of an abundance of endoplasmic reticulum (ER) and mitochondria in close apposition to each other and the cellular membrane (Fig. 2). From these images, the total pacemaker unit volume was estimated to be on the order of 1 μm3.
FIGURE 2.

High-powered ICC electron micrograph photos showing the ultrastructural features. Note the abundance of mitochondria (M) and endoplasmic reticulum (arrowheads) in close proximity to each other and the cell membrane. Figure reprinted with permission from the Annual Review of Physiology, Volume 68 © 2006 by Annual Reviews (www.annualreviews.org).
Ionic concentrations within each compartmental volume are assumed to be homogeneous. This assumption is justified by the small volumes of the compartments and their relatively high ionic diffusion rates. A consequence of assuming ion concentration homogeneity within the compartmental volumes is that the model equations are only dependent upon time, and as such model dynamics can be described by ordinary differential equations. The spatial components of the pacemaker unit are modeled by four compartmental volumes: 1), the ER; 2), the mitochondria; 3), cytosolic subspace 1 (S1); and 4), cytosolic subspace 2 (S2).
Estimates of the intracellular compartmental volume ratios were made from ICC EMs (Fig. 2). Note that the volume ratios are quoted relative to the smallest compartmental volume, S2, and not the pacemaker unit. By using this convention the number of free model parameters is reduced.
Endoplasmic reticulum subspace
The ER is an intracellular Ca2+ store that cycles Ca2+ by release via the IP3R and is sequestered back again by the sarcoendoplasmic reticulum calcium ATPase (SERCA) pump proteins. It should be noted that the ryanodine receptors may be present in ICCs as well. However, experimental evidence suggests that ryanodine has little effect on pacemaker activity in ICCs (25) or in strips of guinea pig muscle (14). Therefore, a representation of ryanodine receptors was not included in our UP model.
Mitochondrial subspace
Mitochondrial Ca2+ uptake regulates cellular ATP production and defines the spatiotemporal transients of the cytosolic Ca2+ signals (26,27). Ca2+ is accumulated into the mitochondrial matrix by flux through the mitochondrial calcium uniporter (MCU) and released by the mitochondrial sodium/calcium exchanger (NCX).
Cytosolic subspaces
The remainder of the pacemaker unit consists of the cytosolic volume (CV). The close spatial arrangement of the ER and mitochondria gives rise to the possible formation of microdomains between these organelles. Such microdomains are consistent with a hypothesis known as the “hotspot theory” (28,29). In brief, the theory postulates that if the ER and mitochondria are spatially adjacent, then ER Ca2+ release can create regions of extremely high [Ca2+] between the organelles. Exposing the MCU to these Ca2+ “hotspots” activates this conductance, causing mitochondrial Ca2+ accumulation. Such activation of the MCU would not be possible under normal cytosolic Ca2+ oscillations (0.1–1.0 μM), as the MCU is a low-Ca2+-affinity conductance (30). Experimental evidence supporting this hypothesis has been observed in cells where there exists a close spatial relationship between the ER and mitochondria (27,28,31).
Due to the significantly higher Ca2+ fluxes through the aforementioned microdomains, a large [Ca2+] gradient will be formed between these regions and the rest of the CV. As a result, the assumption of ionic concentration homogeneity throughout the entire pacemaker unit CV is unrealistic. Therefore, the CV was split into two separate compartmental volumes, the bulk CV and a volume representing the microdomain formed between the organelles, termed cytosolic subspaces 1 (S1) and 2 (S2), respectively. S1 regulates the Ca2+ fluxes into the ER and from the mitochondria. The concentrations of the S1 ionic species are the ionic concentrations the plasma membrane currents are exposed to. The model assumes that there is no ion diffusion from S1 to neighboring pacemaker units; hence the only mechanism for ion efflux from the pacemaker unit is across the cell membrane. S2 accommodates ER Ca2+ release from the IP3R and mitochondrial Ca2+ uptake by the MCU. Note that S2 [Ca2+] regulates both the IP3R and the MCU. Also note that, as there is no physical separation between the cytosolic subspaces, Ca2+ can diffuse between these volumes. We model this passive Ca2+ diffusion by the “flux”, JS1S2 (see Intracellular Ca2+ fluxes).
Model state variables
The major intra- and extracellular ion concentrations and cellular membrane potential are represented by dynamic state variables (SVs) that are governed by a series of coupled differential equations. In total, there are seven SVs that are tracked by the UP model (refer to the structures given schematically in Fig. 1), namely,
membrane potential (Vm),
S1 [Ca2+] (CS1),
S1 [Na+] (NS1),
S2 [Ca2+] (CS2),
ER [Ca2+] (CER),
mitochondrial [Ca2+] (CMT), and
IP3R control SV (H).
Plasma membrane conductances
The plasma membrane currents represent ion flows across the cell membrane. Net ionic flux across the cell membrane determines the rate of change of Vm, with net inward flux causing cellular depolarization (increasing Vm) and net outward flux cellular repolarization (decreasing Vm). As a convention, all inward plasma membrane currents have negative polarity and ion transport across the cell membrane flows into/out of S1. There are four plasma membrane conductances included in the UP model (Fig. 1), which are
inward Ca2+ current, ICa,
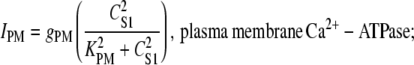
plasma membrane Ca2+-ATPase pump, IPM,
Ca2+-inhibited nonselective cation conductance, INSCC,
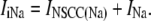
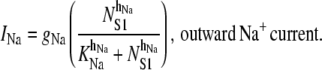
Outward Na+ pump, INa.
For Vm near RMP, ICa provides the initial Ca2+ flux required for calcium-induced-calcium-release (CICR) initiation. Note that other conductances have also been identified in ICCs as being candidates for providing this initial Ca2+ influx; specifically, the dihydropyridine-sensitive L-Type and the dihydropyridine-resistant T-Type Ca2+ currents (8). However, the magnitudes of these currents are negligible near RMP (8). ICa is modeled by a passive current flowing against the Ca2+ electrochemical gradient, and takes the form
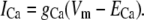 |
(2) |
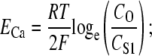
We set gCa to 0.01 pS to provide sufficient Ca2+ entry for CICR initiation and to maintain resting CS1 levels. The Ca2+ Nernst potential, ECa, is given by the equation
 |
(3) |
where CO is extracellular [Ca2+] of 1800 μM, T is body temperature of 310.16 K, R is the universal gas constant, and F is Faraday's constant.
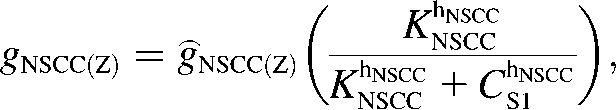
The nonselective cation conductance is postulated to be the main inward current responsible for UP depolarization (11,32). Our model of INSCC conducts both Ca2+ and Na+ ions and is given by the equation
 |
(4) |
where Z is either Na or Ca. Current-voltage relations show that the INSCC reversal potential, ENSCC, is ∼0 mV (33). The conductance of both ions through INSCC is modeled by the CS1-inhibited Hill equation:
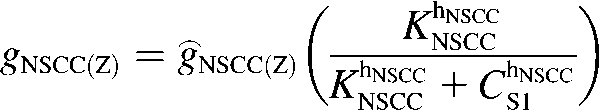 |
(5) |
Voltage-ramp experiments performed on this conductance yielded KNSCC = 0.375 μM and hNSCC = 3 (33), however, we used the value KNSCC = 0.12 μM in the model. This lower value was necessary to ensure appreciable activation of INSCC for changes in [Ca2+] around resting CS1 levels of 0.12 μM. The fitted values of ĝNSCC(Ca) and ĝNSCC(Na) were 0.12 pS and 220 pS, respectively. This is consistent with the assumption that Na+ is the main charge carrier responsible for membrane electrical activity.
The plasma membrane Ca2+-ATPase pump extrudes Ca2+ across the cell membrane to regulate cytosolic [Ca2+]. We model IPM by a second-order Hill equation that is activated by CS1:
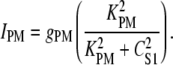 |
(6) |
The value KPM = 1.00 μM was based on typical values from pancreatic acinar cells (34) and we fit gPM = 420 fA to control resting CS1 levels.
The outward Na+ pump accounts for the UP repolarization phase by extruding Na+ ions from the pacemaker unit. Note that UP repolarization is not actually described by the Sanders hypothesis, therefore, INa is a phenomenological addition to the modeling framework. However, justification for a repolarizing conductance in the form of INa is provided in the Discussion. We model INa by the NS1-activated Hill equation as
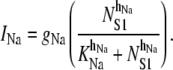 |
(7) |
We set KNa = 1.0 × 10⁴ μM and hNa = 4 to ensure INa was sensitive to changes in physiological NS1 levels. The value of gNa was fit to a value of 1.5 × 10⁴ fA to ensure sufficient extrusion of Na+ from the pacemaker unit so as to prevent transient increases in NS1 levels. The differential equation governing membrane potential is given by the equation
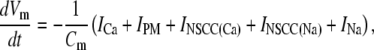 |
(8) |
where Cm is the cellular membrane capacitance and was set to a value of 20 pF, which is within the range of capacitances recorded from murine ICCs (32).
The IP3 receptor model
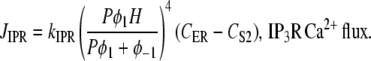
The IP3R releases Ca2+ from ER stores into the cytosol (or in terms of the UP model, S2). The IP3R representation used with the modeling framework is based on a simplified two-state model (35). In modeling JIPR, we use the same assumptions given in Sneyd et al. (35), namely, that the IP3R is comprised of four identical and independent subunits and can only conduct Ca2+ if all the subunits are in an open state. In addition, it is also assumed that the IP3R Ca2+ flux is proportional to the CER/CS2 gradient, giving the equation for JIPR:
 |
(9) |
where P is the [IP3], φ represents the IP3R-state transitional rates, and H is a SV that dynamically controls the receptor's open state. All the equations governing H and φ are identical to the formulations given in Sneyd et al. (35) except for φ3, which we have modeled as a time-dependent “slow” SV. The purpose of this modification was to lengthen the quiescent phase of the oscillatory cycle by reducing the rate at which the IP3R returns to a susceptible state. We deemed this modification necessary to reconcile the fast UP repolarization rates with the relatively slow pacing frequency (1/YF ≈ 100YHW). We implemented a Hodgkin-Huxley type formulation to model φ3 (36), which is given by the differential equation
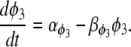 |
(10) |
To obtain an initial feasible IP3R parameter set that produced an oscillatory response, we used the parameter values quoted from Sneyd et al. (35). To increase the operable [Ca2+] range of the IP3R, the parameters R1 and R3 were scaled by a factor of 6 to values of 36 μM and 300 μM, respectively. All of the remaining IP3R rate parameters were determined via the fitting procedure (see Parameter estimation) and are listed in Table 2. Note that we do not dynamically track P, because oscillations of this metabolite have not been demonstrated in ICCs (11). Therefore, we have assumed a constant value of P = 1 μM.
TABLE 2.
UP model parameters
| Parameter | Parameter value | Equations | Reference | |
|---|---|---|---|---|
| Plasma membrane current parameters | ||||
| gCa | 0.01 pS | A12 | F | |
| ENSCC | 0 mV | A14 | (33) | |
| ĝNSCC(Ca) | 0.12 pS | A15 | F | |
| ĝNSCC(Na) | 220 pS | A15 | F | |
| KNSCC | 0.12 μM | A15 | F | |
| hNSCC | 3 | A15 | (33) | |
| gPM | 420 fA | A16 | F | |
| KPM | 1 μM | A16 | (34) | |
| gNa | 1.5 × 10⁴ fA | A17 | F | |
| KNa | 1 × 10⁴μM | A17 | F | |
| hNa | 4 | A17 | F | |
| Intracellular Ca2+ flux parameters | ||||
| VSERCA | 1 × 10⁵ s−1 | A18 | F | |
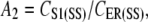
| A2 | 6 × 10⁻⁴ | A18 | F | |
| A4 | 3.57 μM−1 | A18 | (40) | |
| A5 | 2.7 × 10⁻⁵μM−1 | A18 | (40) | |
| A6 | 2.31 × 10⁻⁵μM−2 | A19 | (40) | |
| VMCU | 800 μM s−1 | A19 | F | |
| KMCU | 10 μM | A19 | (30) | |
| KINH | 10 μM | A20 | F | |
| hINH | 4 | A20 | F | |
| VNCX | 0.5 μM s−1 | A21 | F | |
| KNCX | 0.3 μM | A21 | (44) | |
| μS1S2 | 0.04 s−1 | A22 | F | |
| IP3R parameters | ||||
| kIPR | 2000 s−1 | A23 | F | |
| k1 | 0 s−1 | A24 | F | |
| k−1 | 6.4 μM s−1 | A25 | F | |
| k2 | 4 s−1 | A26 | F | |
| r2 | 200 s−1 | A24 | F | |
| r−2 | 0 μM s−1 | A25 | F | |
| r4 | 750 s−1 | A26 | F | |
| R1 | 36 μM | A24 | (35) | |
| R3 | 300 μM | A25,26 | (35) | |
| gα | 0.02 s−2 | A28 | F | |
| gβ | 300 s−1 | A29 | F | |
| Kβ | 2 μM | A29 | F | |
| hβ | 2 | A29 | F | |
| Mitochondrial Ca2+ buffer parameters | ||||
| Km | 0.01 μM | A10 | F | |
| Bm | 100 μM | A10 | F | |
| Intracellular subspace relative volumes | ||||
| γS1 | 100 | A11 | (12,11) | |
| γS2 | 1 | A11 | (12,11) | |
| γER | 20 | A11 | (12,11) | |
| γMT | 200 | A11 | (12,11) | |
| Other constants | ||||
| δS | 26 μM C−1 | A1,6 | F | |
| Cm | 20 pF | A1 | (32) | |
| Cell constants | ||||
| ZCa | 2 | A2 | ||
| ZNa | 1 | A6 | ||
| R | 8.31 × 10⁻³ aJ zmol−1 K−1 | A13 | ||
| T | 310.16 K | A13 | ||
| F | 0.09649 fC zmol−1 | A13 | ||
| CO | 1.8 × 10³μM | A13 | ||
| P | 1 μM | A23 |
F, parameter value was fitted.
Other intracellular Ca2+ fluxes
The intracellular Ca2+ fluxes represent Ca2+ flows through the cytosolic volumes and the intracellular organelles. These fluxes are responsible for the intracellular Ca2+ oscillations and the localized Ca2+ depletion beneath the cell membrane required to activate INSCC. Our model includes five intracellular Ca2+ fluxes (Fig. 1):
Sarcoendoplasmic reticulum Ca2+-ATPase, JSERCA,
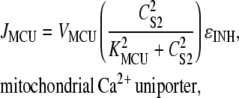
Mitochondrial Ca2+ uniporter, JMCU,
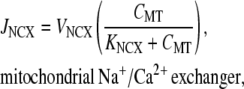
Mitochondrial Na+/Ca2+ exchanger, JNCX,
Intercytosolic subspace Ca2+ flux, JS1S2.
The SERCA pump proteins transport Ca2+ ions from the cytosol into the ER, and are activated by increased cytosolic [Ca2+] (37,38) and/or by decreased luminal ER [Ca2+] (39). Our model of JSERCA is based on the nonbuffering four-state model of Higgins et al. (40), which binds one Ca2+ ion and has the form
 |
(11) |
The reason for this choice of SERCA pump model is because its formulation includes both cytosolic and luminal [Ca2+] dependencies. This is opposed to the majority of SERCA pump models, which only have cytosolic [Ca2+] dependencies (18,41) or have very weak luminal [Ca2+] dependencies (42). We used the parameter values A4 = 3.57 μM−1, A5 = 2.70 × 10⁻⁵ μM−1, and A6 = 2.31 × 10⁻⁵ μM−2 quoted from pancreatic acinar cells (40), and VSERCA was fit to a value of 1 ×10⁵ s−1. In determining the value of A2, we used the assumption that CER and CS1 reached near-steady-state levels and that the IP3R has negligible Ca2+ flux during the quiescent phase of the UP cycle. From this assumption, we can approximate A2 using the equation
 |
(12) |
where CS1(SS) is steady-state CS1 of 0.12 μM and CER(SS) is steady-state CER, which we set to ∼200 μM. Substituting these values into Eq. 12, we therefore obtained a value of A2 = 0.12/200 = 6.0 × 10⁻⁴.
The MCU is a high-capacity, low-Ca2+-affinity conductance that rapidly accumulates Ca2+ from the cytosol (or, in terms of the UP model, S2). The JMCU model is based on the formulation given in Gunter and Pfeiffer (30), which models the MCU by a second-order Hill equation as follows:
 |
(13) |
We set KMCU at 10 μM, which is within the range of values quoted from the literature for this conductance (30), and the value of VMCU was set to 800 μM s−1 to ensure sufficient Ca2+ removal from S2. The MCU inhibition term, ɛINH is a phenomenological modification to prevent excessive build-up in mitochondrial Ca2+ levels over multiple cycles, and is given by the equation
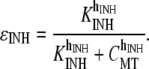 |
(14) |
We used values of KINH = 10 μM and hINH = 4 such that MCU activity was unaffected for normal (physiological) CMT oscillations, but was significantly reduced for high (pathophysiological) CMT levels.
The mitochondrial NCX is the primary mechanism of Ca2+ release from the mitochondrial matrix (30,43). We model this conductance using the formulation given in Colegrove et al. (44), which has the functional form
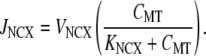 |
(15) |
We used a value of KNCX = 0.3 μM, which is in agreement with estimates obtained from sympathetic neurons (44). A value of VNCX = 0.5 μM s−1 was used to prevent a transient build-up in mitochondrial Ca2+ over subsequent UP cycles. Note that the model of JNCX only conducts Ca2+ because mitochondrial [Na+] changes are typically small and, as such, have a negligible effect on conductance activity (45).
The intercytoplasmic subspace Ca2+ flux provides a mechanism for Ca2+ diffusion between the cytoplasmic volumes. We use a simplification of the general diffusion equation (46) to model JS1S2 as follows:
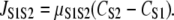 |
(16) |
We used a value of μS1S2 = 0.04 s−1 to 1), allow sufficient Ca2+ entry from S1 to initiate CICR, and 2), prevent Ca2+ diffusing back into the bulk cytosol before the MCU could properly activate.
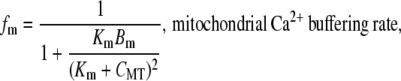
Mitochondrial Ca2+ buffering
The mitochondrial Ca2+ buffer is a phenomenological addition to the model that is used to prevent depletion of CMT stores. The Ca2+ buffer model we used is based on the fast-approximation Ca2+ buffer model (47), and is given by the equation
 |
(17) |
Note that Eq. 17 differs from the original formulation in that fm appears on the righthand, as opposed to the lefthand, side of the differential equation. The buffering parameters, Km and Bm, were set to values of 0.01 μM and 100 μM, respectively such that prolonged net Ca2+ efflux from the mitochondria did not fully deplete Ca2+ stores.
Pacemaker unit model
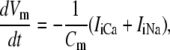
Now that all of the constituent equations have been defined, the differential equations governing the intracellular ionic species can be stated. With reference to Fig. 1, the ionic species conservation ordinary differential equations are
 |
(18) |
 |
(19) |
 |
(20) |
 |
(21) |
 |
(22) |
where δS is a scale factor that converts a plasma membrane current, in pA, to an intracellular flux, in μM s−1, and where ZX is the valency of ion X. Note that for convenience, the plasma membrane conductances have been divided into separate Na+ and Ca2+ aggregate currents:
 |
(23) |
 |
(24) |
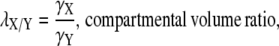
The intercompartmental volume ratio, λX/Y, which scales the ionic fluxes between compartmental volumes, hence conserving ionic concentrations, is calculated as
 |
(25) |
where X and Y are the compartmental volumes.
A complete list of all the UP model equations is given in Appendix A, and all model parameters and SV initial conditions are given in Tables 2 and 3. Numerical simulations were carried out on a 3.0 GHz Intel Pentium 4 desktop computer using MATLAB (Version 7.1.0.246 Release 14; The MathWorks, Natick, MA). The model differential equations were integrated using the stiff equation solver, ode15s. The nondefault ode15s integration options were AbsTol = 1.0E-4 and RelTol = 1.0E-8.
TABLE 3.
State variable initial conditions
| State variable | Initial value |
|---|---|
| Vm | −70.1 mV |
| CS1 | 0.120 μM |
| CS2 | 0.023 μM |
| CER | 203 μM |
| CMT | 0.220 μM |
| NS1 | 1.01 × 10⁴μM |
| φ3 | 0.306 s−1 |
RESULTS
Unitary potential depolarizations
Integration of the model equations produces UPs with amplitudes of 3.00 mV (from a minimum diastolic potential of −70.2 mV), frequency of 0.05 Hz, and half-width of 0.21s (Fig. 3 A). These UPs are spontaneously rhythmic (Fig. 3 B), and long-term simulations of more than 1000 oscillations show that the depolarizations are stable (data not shown). Table 4 summarizes all the model UP characteristic values and compares them to their experimentally recorded analogous values (9).
FIGURE 3.

UP membrane depolarizations produced from model simulations. (A) A single UP oscillation. (B) UPs over multiple pacemaker cycles, illustrating the spontaneous rhythmicity of model pacemaker activity.
TABLE 4.
Comparison of simulated and experimentally recorded UP characteristic values
Intracellular ion cycling
Underlying the UP depolarizations are oscillations in the intracellular ionic species (Fig. 4). The model oscillations begin with Ca2+ entry across the cell membrane, which passively diffuses from S1 to S2, transiently increasing both CS2 and the IP3R open probability (Fig. 5 A). Once the IP3R open probability reaches CICR threshold, ER Ca2+ is released into the microdomain, causing a significant increase in CS2 (Fig. 5, B and C). This has the effect of simultaneously inactivating the IP3R and activating the MCU, causing rapid mitochondrial Ca2+ accumulation (Fig. 5 D). Note that at this point the bulk of the Ca2+ released from the ER is now located in the mitochondria. Therefore, when the SERCA pumps sequester Ca2+ from S1 to refill ER stores, CS1 falls below its original levels, causing INSCC activation (Fig. 5 E). The resultant net ionic influx depolarizes the cell membrane, with Ca2+ entry restoring CS1 levels, which inactivates INSCC, and Na+ entry elevating NS1, activating INa (Fig. 5 F). Therefore, the simultaneous inactivation of INSCC and activation of INa shifts net transmembrane ion flow from inward to outward, hence repolarizing the cell. Restoration of the intracellular ionic species returns the pacemaker unit to a susceptible state, allowing this cycle to continue ad infinitum. The process described above is summarized by the schematic diagram given in Fig. 6.
FIGURE 4.

Intracellular ionic concentrations and IP3R open probability tracked over multiple pacemaker cycles. The plots displayed are (A) S1 [Ca2+], CS1, (B) S2 [Ca2+], CS2, (C) IP3R open probability, PIPR, (D) ER [Ca2+], CER, (E) mitochondrial [Ca2+], CMT, and (F) S1 [Na+], NS1. Note that logarithmic values are plotted for the CS2 (B) and PIPR (C) traces.
FIGURE 5.

Plots showing the temporal relationship between the model SVs during the ER Ca2+ release phase of the UP oscillatory cycle. (A) The simultaneous increase in CS2 and PIPR leads to (B) initiation of ER Ca2+ causing a sudden reduction in CER, which results in (C) a significant increase in CS2. (D) The significant increase in CS2 activates the MCU, causing mitochondrial Ca2+ accumulation. (E) Simultaneously, the SERCA pumps activate to replenish ER Ca2+ stores, hence causing a reduction in CS1. The depletion in CS1 activates INSCC, resulting in (F) a significant influx of Na+ into the pacemaker unit. Note that the SV on the left vertical axis is represented by the solid curve, and the SV on the right vertical axis by the dashed curve. Also note that logarithmic values are plotted for the CS2 (B) and PIPR (C) traces.
FIGURE 6.

Schematic diagram of the pacemaking mechanism cycle as illustrated by the model response. (Step 1) Initial Ca2+ entry from the Vm-dependent inward Ca2+ current, ICa, which diffuses from S1 to S2. (Step 2) Sufficient Ca2+ entry into S2 raises the IP3R open probability to threshold and ER Ca2+ release occurs. (Step 3) The subsequent increase in CS2 activates the MCU, causing rapid mitochondrial Ca2+ accumulation. (Step 4) ER Ca2+ sequestration via the SERCA pumps to replenish ER Ca2+ stores. (Step 5) Activation of INSCC, caused by CS1 depletion from SERCA activation. The resulting Ca2+ and Na+ influx is responsible for the UP depolarization phase. (Step 6) Repolarization, caused by INa activation from increased NS1 levels, and CMT restitution, from JNCX, resets the pacemaker unit allowing the cycle to begin again.
Cytosolic Ca2+ oscillations
Cytosolic [Ca2+], calculated as the weighted average of CS1 and CS2, produces a spike over the pacemaker cycle (Fig. 7). The increase in cytosolic [Ca2+] is attributed to the large CS2 transient, which offsets the decrease in CS1. This is despite the fact that CS1 makes up the bulk of cytosolic [Ca2+]. This result is qualitatively similar to spatially averaged ICC intracellular Ca2+ image recordings (48–52). An interesting point to note about the simulated cytosolic [Ca2+] traces is that despite the reduction in subplasma membrane, required to activate pacemaker currents, there is still a general increase in [Ca2+] over the pacemaker cycle.
FIGURE 7.

Pacemaker unit cytosolic [Ca2+] oscillations around the ER Ca2+ release phase of the pacemaker cycle (A) and over multiple pacemaker cycles (B). Note that there is an increase in cytosolic [Ca2+] over each cycle. This is despite the fact that depletion of CS1 is required for the activation of pacemaker currents (INSCC) and CS1 makes up the bulk of cytosolic [Ca2+].
Voltage-clamp simulations
Simulations of voltage-clamp experiments were performed to determine the effect that membrane potential has on pacemaker activity. To replicate voltage-clamp experimental conditions, simulations were run with Eq. 8 set to zero and Vm set to the clamp potential. All other model state variables were calculated normally. The clamp potentials used for these simulations were 1) −70 mV to simulate control activity; 2), −60 mV to simulate depolarized conditions; and 3), −80 mV to simulate hyperpolarized conditions.
Results of these simulations qualitatively demonstrate two experimentally observed phenomena. First, model pacemaker activity persists under voltage clamp, as signified by the continuation of intracellular ion oscillations (Fig. 8). This result is comparable to experimental studies wherein voltage-clamped ICCs continued to generate pacemaker currents (25,32,33,53). Second, the reduction in cytosolic [Ca2+] caused by membrane depolarization (Fig. 8 E) reduces pacemaker frequency. This result is consistent with experimental observations, made by multiple investigators, that reduction in ICC intracellular [Ca2+] induced by the Ca2+ chelator, BAPTA-AM, caused a reduction in UP discharge rate (7,9,10).
FIGURE 8.

Intracellular ionic concentrations produced under simulated voltage-clamp conditions for (A) CS1, (B) CS2, (C) CER, (D) CMT, and (E) NS1. Simulations were performed for Vm = −80, −70, and −60 mV. The simulations show that depolarization causes a decrease in pacemaking frequency and a decrease in the magnitude of the intracellular ionic concentrations (the effect is opposite for hyperpolarization). Note that logarithmic values are plotted for the CS2 trace (B).
Effects of blocking mitochondrial Ca2+ uptake
To determine the mitochondria's influence on pacemaker activity, numerical experiments were performed in which mitochondrial Ca2+ uptake was blocked. To replicate the experimental conditions of Beckett et al. (10), MCU activity was negated by collapsing the mitochondrial Ca2+ electrochemical gradient (i.e., setting Eq. 11 to zero). No alterations were made to any of the other model parameters.
The results of this numerical investigation show that inhibition of the MCU abolishes spontaneous membrane depolarizations (Fig. 9 A). The cessation of pacemaker activity appears to be caused by a build-up in CS2 that prevents the IP3R from returning to a fully activated state (Fig. 9, B and C). Prolonged simulation of the model, after the cessation of pacemaker activity, shows that there is significant membrane hyperpolarization caused by a transient increase in CS1 (Fig. 9, D and E). This increase in CS1 is due to the emptying of mitochondrial Ca2+ stores over time (Fig. 9 F). Both of these results are similar to observations from experiments on murine gastric fundus, wherein mitochondrial Ca2+ uptake had been inhibited (10).
FIGURE 9.

Numerical simulations showing the short-term (A–C) and long-term (D–F) effects of mitochondrial inhibition on pacemaker activity. The bar above the traces in A–C denotes MCU inhibition. UP depolarizations, which are present before MCU inhibition, are abolished after MCU block (A). This appears to be due to a build-up in CS2 (B) which prevents the IP3R from returning to a susceptible state (C). Long-term simulation, after pacemaker activity cessation, shows membrane hyperpolarization (D) caused by a transient increase in CS1 (E). The increase in CS1 is due to the emptying of mitochondrial Ca2+ stores over time (F). Note that logarithmic values are plotted for the CS2 (B) and PIPR (C) traces, and that the y axis on CS1 trace (E) is truncated at 0.121 μM.
DISCUSSION
In this study, we introduce the first, to our knowledge, biophysically based computational modeling framework that simulates ICC pacemaker activity on the pacemaker unit spatial scale. This modeling framework is also the first to take into account a variety of biophysical parameters that have been measured experimentally: 1), the involvement of mitochondria as a basic mechanism in generating spontaneous inward currents; 2), provisions for a transient reduction in subplasma membrane [Ca2+], which regulates the open probability of a Ca2+-inhibitied nonselective cation conductance expressed by pacemaker ICCs; 3), modeling of Ca2+ dynamics within the constraints of an anatomical ICC “pacemaker unit”. Previous models, though capable of generating rhythmical ICC slow-wave-like depolarizations, have not included any of these elements. Furthermore, all of the established models, except that of Edwards and Hirst (12), assume that slow waves (or pacemaker potentials), and not UP depolarizations, are the basic ICC pacemaker event.
Our modeling framework was based on the Sanders pacemaker hypothesis (11,15), which proposes a complex intracellular Ca2+ handling mechanism to activate pacemaker currents. In constructing our model, a minimalist approach was used wherein components were included only if there was suitable justification. This method is juxtaposed against the approach of altering established mathematical cellular models to fit a desired framework. The risk of altering established models is that there could be intrinsic mechanisms that are neither necessary nor justifiable in the new framework. Consequently, by constructing the model from an elementary basis that is consistent with the biophysical mechanisms of the Sanders hypothesis, we have produced a model that is, we believe, the simplest and most accurate biophysical representation required to produce ICC subcellular pacemaker activity.
Here, we discuss the model's performance, validation simulation results, a comparison of our model to the original hypothesis, the results of the model parameter sensitivity analysis, and the model's limitations.
Physiological simulations
Results of the physiological numerical simulations show that the important aspects of pacemaker activity are depicted well by our model. Perhaps the most essential feature is the model's ability to produce spontaneously rhythmic membrane depolarizations (Fig. 3 B). This demonstrates that our model is capable of producing pacemaker activity, a property intrinsic to ICCs (11). Moreover, the UPs produced by our model have characteristics similar to those recorded experimentally (Table 4). Note that it is not actually possible to make a direct comparison between model simulations and experimentally recorded UP traces. This is because 1), experimentally recorded UPs are highly stochastic in nature, and 2), all experimentally recorded UPs are made from whole-cell or multiple-cell preparations, making it impossible to isolate the electrical behvior of a single pacemaker unit.
Another important feature of our model is that the activation of pacemaker currents is caused by depletion of subplasma membrane [Ca2+]. This result is important, because membrane depolarizations caused by the activation of a Ca2+-inhibited conductance have not been demonstrated previously, that we know of, in ICC mathematical models. Instead, investigators have invariably relied upon a Ca2+-activated conductance as a mechanism for generating transient inward currents and membrane depolarization, but there is no direct experimental evidence demonstrating the existence of a Ca2+-activated inward conductance in pacemaker ICCs (11). A Ca2+-inhibited nonselective cation conductance has been identified and characterized by ICC experiments (33).
Analysis of the pacemaker unit cytosolic [Ca2+] shows that there is an increase in [Ca2+] over the oscillatory cycle (Fig. 7). This result is comparable to spatially averaged images of intracellular [Ca2+] in ICC (48–52). Note that a direct comparison cannot be made between the experimentally recorded and numerically simulated Ca2+ traces. The reasons for this are that 1), the experimental recordings are a relative, not absolute, measure of intracellular [Ca2+], and 2), our mathematical model is only representative of pacemaker activity from a single pacemaker unit, whereas the experimental recordings represent whole-cell activity, where voltage-dependent Ca2+ currents may amplify cytosolic transients. Nonetheless, this result overcomes a seemingly paradoxical situation: the depletion of subplasma membrane Ca2+ required for INSCC activation while still producing an increase in cytosolic [Ca2+] over the oscillatory cycle, which is qualitatively similar to experimental observations.
Finally, our model demonstrates that ICC pacemaker activity is possible in the absence of IP3 oscillations. This result is important, because, despite the consensus that release of Ca2+ via IP3-operated ER stores is essential for ICC pacemaker activity (11,14,25), there remains controversy over the exact mechanism by which IP3R-operated Ca2+ release is initiated. Several investigators have suggested that Vm-dependent IP3 synthesis is responsible for regulating ER Ca2+ release (25), and indeed such a mechanism has been utilized in other ICC mathematical models (13,20). In our modeling framework, Ca2+ entry initiates ER Ca2+ release. The problem with the Vm-dependent IP3 synthesis mechanism is that [IP3] oscillations phase-locked to pacemaker activity have never been demonstrated experimentally in ICCs (11). This is coupled with the fact that the predominant IP3R isoform in ICCs is the Type-1 isoform (54), which is characterized by a high-Ca2+-gain, low-IP3-gain response (55). As a consequence, the ICC IP3R is more sensitive to changes in [Ca2+] in comparison to changes in [IP3]. Conversely, pacemaker frequency and intracellular [Ca2+] oscillations in ICCs are clearly dependent upon Ca2+ entry mechanisms (48–52), giving credibility to the Ca2+ entry hypothesis. Moreover, pacemaker activity simulated by our model is further support for the involvement of a Ca2+ entry mechanism.
Validation simulations
Voltage-clamp experiments were performed on our model to investigate the dependency of simulated pacemaker activity on membrane potential. Results of these simulations predict that pacemaker activity persists under voltage clamp (Fig. 8), a phenomenon that has been observed experimentally by multiple investigators (25,32,33,50). Simulations performed under increasingly depolarized clamp potentials show that there is a reduction in pacemaker frequency (Fig. 8). This is due to the overall reduction in the cytosolic Ca2+ load caused by a reduction in the magnitude of the inward Ca2+ currents, ICa and INSCC(Ca) (Fig. 8 E). Indeed, pharmacological agents that reduce intracellular Ca2+ have been shown to decrease UP activity in ICCs (7,9,10). However, experimental observations have also shown that membrane depolarization increases UP activity (9,56). Therefore, as model pacemaker frequency is dependent on cytosolic Ca2+ load, which in turn is dependent on Vm-dependent Ca2+ entry, these results suggest the possibility that the modeling framework, in its present form, is “missing” an inward Vm-dependent Ca2+ conductance. This is not entirely unexpected because, as previously stated, the present modeling framework is only representative of pacemaker activity for Vm near RMP (see also Limitations, below).
Numerical investigations were also undertaken to determine the influence that the mitochondria has on pacemaker activity. To determine this influence, we removed the effect of MCU Ca2+ uptake by collapsing the mitochondrial Ca2+ electrochemical gradient. Results of these simulations show that pacemaker activity is abolished, with prolonged simulation predicting hyperpolarization of the cell membrane. These results are consistent with experimental observations in the guinea pig gastric fundus, where mitochondrial Ca2+ uptake was inhibited (10).
Hypothesis comparison
Our UP model has a biophysical basis that encapsulates the central mechanisms postulated by the Sanders pacemaker hypothesis. These mechanisms, as discussed above, include the Vm-dependent entry of Ca2+ to initiate CICR, the importance of ER Ca2+ cycling to pacemaker activity, the inclusion of mitochondrial Ca2+ dynamics, and the localized depletion of subplasma membrane [Ca2+] to initiate pacemaker currents. However, there are several points of difference between the UP model and the Sanders pacemaking hypothesis. These differences include the addition of a second cytosolic subspace, the mechanism by which subplasma membrane [Ca2+] is depleted, and the addition of a repolarizing current in the form of an outward Na+ current. Each of these points of difference is discussed in turn below.
Addition of second cytosolic subspace
To account for the high Ca2+ activity in the region formed between the ER and mitochondria, a secondary cytosolic subspace was added to the modeling framework. Via this structure, the assumption of ion concentration homogeneity within each compartmental volume remains valid. As discussed above, this secondary cytosolic subspace is also consistent with the “hotspot theory” (29,30). This theory postulates that high [Ca2+] in the microdomain formed between the intracellular organelles is capable of activating the low-Ca2+-affinity MCU, an event which is not possible under normal cytosolic [Ca2+] oscillations.
Mechanism for CS1 depletion
The original hypothesis suggests that mitochondrial Ca2+ uptake is responsible for removing Ca2+ from S1, whereas our model predicts that CS1 depletion occurs by SERCA pump activation. Although mitochondrial Ca2+ uptake is a requisite for pacemaker activity (10,25,57), within our modeling framework we were unable to define a consistent set of parameter values that produced CS1 depletion via the MCU alone. This is primarily due to the fact that the MCU draws its Ca2+ from S2 and hence does not directly influence CS1. The issues associated with this mechanism are further compounded by the fact that, 1), the rate of intercytosolic subspace Ca2+ diffusion is limited, and 2), S2 is significantly smaller than S1 and thus would have little influence on its activity. These issues cannot be circumvented because, as previously stated, S2 Ca2+ accumulation is required for MCU activation.
If the MCU were to cause submembrane Ca2+ depletion, CS2 would have to be maintained at a lower level than CS1 for a prolonged period of time. This is so that Ca2+ could passively diffuse from S1 back to S2. The difficulty with this proposed mechanism is that mitochondrial Ca2+ uptake is a negative feedback process whereby MCU Ca2+ uptake causes a reduction in CS2, which in turn reduces the magnitude of the MCU Ca2+ flux (see Eq. 13). Furthermore, the MCU is a low-Ca2+-affinity conductance and thus would have negligible magnitude at low [Ca2+]. With all of these facts taken together, the MCU would not have the capacity to maintain the required low CS2 levels and hence could not possibly cause CS1 depletion.
In contrast, to consider the mechanism of CS1 depletion caused by the SERCA pump proteins we need to review the events directly after CICR. Ca2+ released into S2 will activate the MCU, which rapidly accumulates Ca2+ in the mitochondrial matrix. Simultaneously, the ER will sequester Ca2+ from the cytoplasm (or, in terms of the model, S1) to replenish Ca2+ stores. Note that at this point the bulk of the Ca2+ released from the ER now resides in the mitochondria. Therefore when Ca2+ is sequestered back into the ER there will be a net reduction in CS1, hence activating the pacemaker currents. Numerical simulations performed on our model provide proof of concept to this mechanism (Fig. 4). Note that this new mechanism does not invalidate the original hypothesis, because mitochondrial Ca2+ uptake is still necessary for pacemaker activity, as exemplified by the MCU inhibition numerical simulations (Fig. 9).
INa as a repolarizing conductance
The argument for the inclusion of a repolarizing conductance, in the form of INa, is based on enforcing charge conservation within the model. Let Iion denote the sum of all the plasma membrane conductances (i.e., Iion equals the sum of Eqs. 23 and 24). Consider the closed-form equation used in Edwards and Hirst (12) to represent UP depolarizations,
 |
(26) |
where A and B are time constants, and H is a scale factor. By differentiating Eq. 26 with respect to time, substituting it into Eq. 8, and rearranging, we obtain a closed-form expression for the Iion transient that is required to reproduce Eq. 26,
 |
(27) |
where 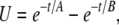 and
and
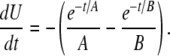 |
Using typical UP time constants of A = 0.434 s and B = 0.077 s (12) and setting 3HCm = 1, it can be seen that there are two distinct phases of net transmembrane ionic flux, 1), net ion influx, and 2), net ion efflux (Fig. 10). Based on the Sanders hypothesis, we can assume that net ionic influx can be attributed to the activation of INSCC. The mechanism for net ionic efflux is unclear, but it is likely that the trigger is not associated with altered [Ca2+], because Ca2+ entry via INSCC would restore submembrane [Ca2+] to original levels. Therefore, the only other possible repolarization triggers are Vm, whereby depolarization could activate the outward current, or increased [Na+] levels, caused by Na+ influx through INSCC.
FIGURE 10.

Trace of the aggregate plasma membrane current, Iion, required to reproduce a UP depolarization using the UP representation of Edwards and Hirst (12) (A = 0.434 s, B = 0.077 s, 3HCm = 1). Note the two distinct phases of transmembrane ionic flux that comprise UP depolarizations: net inward ion flux and net outward ion flux.
Consider the case of Vm as the primary repolarization mechanism. The most likely candidate conductances for such a mechanism would be an outward Vm-dependent K+ channel. Indeed, several different types of K+ channels have been identified in ICCs (32,58), and K+ conductances are necessary for maintaining RMP in an excitable cell (59). It should be appreciated, however, that the amplitude of UP depolarizations are very small, typically in the range of 0.5–10 mV (7,9). This means that the voltage sensor of an outward Vm-dependent current would have to be extremely sensitive to these small depolarizations to produce the fast UP repolarization rates. However, the kinetics of the K+ conductances identified from the aforementioned experimental studies show that these currents have negligible magnitude near RMP. Therefore, even though these conductances would eventually restore Vm depolarizations to original levels, the repolarization rate would not be fast enough to account for the UP half-width. As a result, K+ conductances, although important for ICC pacemaker activity, are probably not directly involved in UP repolarization. Conversely, a repolarization mechanism dependent on elevated intracellular [Na+] is not constrained by the small amplitude of UP depolarizations. This is because Na+ entry into the pacemaker unit is dependent only on the Vm-independent INSCC. Futhermore, an outward Na+ conductance provides a pathway for Na+ extrusion from the pacemaker unit. Taken altogether, we deemed a Na+-dependent outward conductance to be the most physiologically plausible option, and thus was the repolarization conductance implemented in the modeling framework.
We assume that the Na+-dependent outward conductance, denoted as INa, represents a Na+ dependent ion exchanger such as a sodium/calcium or sodium/potassium exchanger. However as the exact identity of INa is unknown, we cannot be certain of the conductance's functionality or kinetics. Therefore, we conservatively model INa as a Na+-ATPase pump that has the same functionality and kinetics as IPM (see Eqs. 5 and 6), the only difference being that INa is dependent on intracellular [Na+] rather than [Ca2+].
Note that as INa is dependent on [Na+], the inclusion of S1 [Na+], or NS1, as a model SV, is justified. Note also that S1 is the only compartmental volume where Na+ dynamics are tracked by the model. This is because our primary concern is determining the effect of Na+ on the plasma membrane, and all plasma membrane currents are regulated by S1 ion concentrations.
Limitations
Although our model is capable of reproducing many important features of pacemaker activity, it must be appreciated that the model incorporates assumptions and features that are approximations of reality. Here, we identify and discuss the main limiting factors of the model.
The foremost limiting factor of ICC biophysically based modeling is the lack of experimental data describing dynamics such as ion channel kinetics, intracellular ion concentrations, and metabolic pathways. This limitation has also been noted by other biophysically based ICC modeling investigators (20). Due to the scarcity of suitable modeling data, a majority of our model parameter values were based on data from other cell types. For those parameters for which analogous values did not exist in the literature, we fit their values using optimization techniques to reproduce characteristic UP features. However, the biophysical structure of the model means that as experimental data becomes available we can readily adapt the model to incorporate this new information.
Another limitation of the model is that it is only representative of pacemaker activity for Vm near RMP. As a result, certain Vm-dependent conductances that are important for whole-cell pacemaker activity, but have negligible magnitude near RMP, have been omitted from the modeling framework. Such conductances include the dihydropyridine-resistant Ca2+ current, IVDDR (8). Voltage-dependent Ca2+ entry via IVDDR has been suggested to organize the discharge of unitary potentials from the pacemaker units (11,12), accounting for the upstroke phase of the PPs (16,17). Other important omissions are the K+ channels, such as the Ba2+-sensitive inwardly rectifying K+ channels (32) and voltage-dependent Kv1.1 K+ channels (58), which are suggested to account for the repolarization phase of the PPs (32). Therefore, numerical simulations that are performed in the voltage window of these omitted conductances (∼>60 mV) do not take into account their activity, and hence these simulations are not an accurate representation of pacemaker activity.
SUMMARY
In this study, we introduce a mathematical model that is capable of reproducing ICC pacemaker activity on the subcellular spatial scale. Our goal for this project was to provide a biophysical basis for the complex mechanisms underlying GI pacemaker activity. This work is analogous to quantitative electrophysiological studies that have been performed on other organs, such as the heart. Future work will allow us to exploit the multiscale approach of biophysically based mathematical modeling to entrain individual UPs to reproduce whole-cell slow-wave depolarizations. The ultimate goal is to embed an entire biophysically based ICC model into anatomically accurate GI whole-organ topologies to study electrical function under healthy and pathological conditions.
The authors thank Prof. Sang Don Koh and Prof. Sean Ward (Physiology and Cell Biology Department, University of Nevada, Reno, Nevada) for their assistance with ICC physiology, and Prof. James Sneyd (Department of Mathematics, University of Auckland, Auckland, New Zealand) and Dr. Edmund Crampin (Bioengineering Institute, University of Auckland, Auckland, New Zealand) for providing assistance with mathematical modeling of biological systems.
This work was supported by the University of Auckland, the New Zealand Institute of Mathematics and its Applications, the Royal Society of New Zealand, the National Institutes of Health (R01 DK64775), and the Todd Foundation. Dr. Sanders was supported by National Institutes of Health grants DK41315 and DK40569 for his contributions.
APPENDIX A: MODEL EQUATION SUMMARY
The differential equations governing the model state variables are:
 |
(A1) |
 |
(A2) |
 |
(A3) |
 |
(A4) |
 |
(A5) |
 |
(A6) |
 |
(A7) |
where
 |
(A8) |
 |
(A9) |
 |
(A10) |
and
 |
(A11) |
where X and Y = S1, S2, ER, or MT.
The model plasma membrane currents are given as follows:
 |
(A12) |
 |
(A13) |
 |
(A14) |
and
 |
(A15) |
where Z = Ca or Na and
 |
(A16) |
and
 |
(A17) |
The model intracellular Ca2+ fluxes are
 |
(A18) |
 |
(A19) |
 |
(A20) |
 |
(A21) |
 |
(A22) |
and
 |
(A23) |
The IP3R rate constants are
 |
(A24) |
 |
(A25) |
and
 |
(A26) |
The IP3R slow variable, φ3 differential equation, and rate constants are
 |
(A27) |
 |
(A28) |
and
 |
(A29) |
Editor: Ron Elber.
References
- 1.Szurszewski, J. H. (1987). Electrical basis for gastrointestinal motility. In Physiology of the Gastrointestinal Tract, 2nd ed. L. R. Johnson, editor. Raven Press, New York. 383–422.
- 2.Tomita, T. (1981). Electrical activity (spikes and slow waves) in gastrointestinal smooth muscle. In Smooth Muscle: An Assessment of Current Knowledge. E. Bulbring, A. F. Brading, A. W. Jones, and T. Tomita, editors. University of Texas Press, Austin, TX. 127–156.
- 3.Smith, T. K., J. B. Reed, and K. M. Sanders. 1987. Origin and propagation of electrical slow waves in circular muscle of canine proximal colon. Am. J. Physiol. 252:C215–C224. [DOI] [PubMed] [Google Scholar]
- 4.Ward, S. M., A. J. Burns, S. Torihashi, and K. M. Sanders. 1994. Mutation of the proto-oncogene c-kit blocks development of interstitial cells and electrical rhythmicity in murine intestine. J. Physiol. 480:91–97. [DOI] [PMC free article] [PubMed] [Google Scholar]
- 5.Huizinga, J. D., L. Thuneberg, M. Kluppel, J. Malysz, H. B. Mikkelsen, and A. Bernstein. 1995. W/kit gene required for interstitial cells of Cajal and for intestinal pacemaker activity. Nature. 373:347–349. [DOI] [PubMed] [Google Scholar]
- 6.Langton, P., S. M. Ward, A. Carl, M. A. Norell, and K. M. Sanders. 1989. Spontaneous electrical activity of interstitial cells of Cajal isolated from canine proximal colon. Proc. Natl. Acad. Sci. USA. 86:7280–7284. [DOI] [PMC free article] [PubMed] [Google Scholar]
- 7.Edwards, F. R., G. D. Hirst, and H. Suzuki. 1999. Unitary nature of regenerative potentials recorded from circular smooth muscle of guinea-pig antrum. J. Physiol. 519:235–250. [DOI] [PMC free article] [PubMed] [Google Scholar]
- 8.Kim, Y. C., S. D. Koh, and K. M. Sanders. 2002. Voltage-dependent inward currents of interstitial cells of Cajal from murine colon and small intestine. J. Physiol. 541:797–810. [DOI] [PMC free article] [PubMed] [Google Scholar]
- 9.Kito, Y., H. Suzuki, and F. R. Edwards. 2002. Properties of unitary potentials recorded from myenteric interstitial cells of Cajal distributed in the guinea-pig gastric antrum. J. Smooth Muscle Res. 38:165–179. [DOI] [PubMed] [Google Scholar]
- 10.Beckett, E. A., Y. R. Bayguinov, K. M. Sanders, S. M. Ward, and G. D. Hirst. 2004. Properties of unitary potentials generated by intramuscular interstitial cells of Cajal in the murine and guinea-pig gastric fundus. J. Physiol. 559:259–269. [DOI] [PMC free article] [PubMed] [Google Scholar]
- 11.Sanders, K. M., S. D. Koh, and S. M. Ward. 2006. Interstitial cells of Cajal as pacemakers in the gastrointestinal tract. Annu. Rev. Physiol. 68:307–343. [DOI] [PubMed] [Google Scholar]
- 12.Edwards, F. R., and G. D. Hirst. 2003. Mathematical description of regenerative potentials recorded from circular smooth muscle of guinea pig antrum. Am. J. Physiol. Gastrointest. Liver Physiol. 285:G661–G670. [DOI] [PubMed] [Google Scholar]
- 13.Imtiaz, M. S., C. P. Katnik, D. W. Smith, and D. F. van Helden. 2006. Role of voltage-dependent modulation of store Ca2+ release in synchronization of Ca2+ oscillations. Biophys. J. 90:1–23. [DOI] [PMC free article] [PubMed] [Google Scholar]
- 14.van Helden, D. F., M. S. Imtiaz, K. Nurgaliyeva, P. von der Weid, and P. J. Dosen. 2000. Role of calcium stores and membrane voltage in the generation of slow wave action potentials in guinea-pig gastric pylorus. J. Physiol. 524:245–265. [DOI] [PMC free article] [PubMed] [Google Scholar]
- 15.Sanders, K. M., T. Ordog, S. D. Koh, and S. M. Ward. 2000. A novel pacemaker mechanism drives gastrointestinal rhythmicity. News Physiol. Sci. 15:291–298. [DOI] [PubMed] [Google Scholar]
- 16.Lee, H. K., and K. M. Sanders. 1993. Comparison of ionic currents from interstitial cells and smooth muscle cells of canine colon. J. Physiol. 460:135–152. [DOI] [PMC free article] [PubMed] [Google Scholar]
- 17.Kito, Y., S. M. Ward, and K. M. Sanders. 2005. Pacemaker potentials generated by interstitial cells of Cajal in the murine intestine. Am. J. Physiol. Cell Physiol. 288:C710–C720. [DOI] [PubMed] [Google Scholar]
- 18.Nickerson, D. P., and P. J. Hunter. 2006. The Noble cardiac ventricular electrophysiology models in CellML. Prog. Biophys. Mol. Biol. 90:346–359. [DOI] [PubMed] [Google Scholar]
- 19.Aliev, R. R., W. Richards, and J. P. Wikswo. 2000. A simple nonlinear model of electrical activity in the intestine. J. Theor. Biol. 204:21–28. [DOI] [PubMed] [Google Scholar]
- 20.Youm, J. B., N. Kim, J. Han, E. Kim, H. Joo, C. H. Leem, G. Goto, A. Noma, and Y. E. Earm, (2006). A mathematical model of pacemaker activity recorded from mouse small intestine. Philos. Transact. A Math. Phys. Eng. Sci. 364:1135–1154. [DOI] [PubMed] [Google Scholar]
- 21.Kito, Y., H. Fukuta, and H. Suzuki. 2002. Components of pacemaker potentials recorded from the guinea pig stomach antrum. Pflugers Arch. 445:202–217. [DOI] [PubMed] [Google Scholar]
- 22.Tsunoda, Y., E. L. Stuenkel, and J. A. Williams. 1990. Oscillatory mode of calcium signaling in rat pancreatic acinar cells. Am. J. Physiol. 258:C147–C155. [DOI] [PubMed] [Google Scholar]
- 23.Friel, D. D. 1995. Calcium oscillations in neurons. CIBA Found. Symp. 188:210–234. [DOI] [PubMed] [Google Scholar]
- 24.Kirkpatrick, S., C. D. Gelatt, and M. P. Vecchi. 1983. Optimization by simulated annealing. Science. 220:671–680. [DOI] [PubMed] [Google Scholar]
- 25.Ward, S. M., T. Ordog, S. D. Koh, S. A. Baker, J. Y. Jun, G. Amberg, K. Monaghan, and K. M. Sanders. 2000. Pacemaking in interstitial cells of Cajal depends upon calcium handling by endoplasmic reticulum and mitochondria. J. Physiol. 525:355–361. [DOI] [PMC free article] [PubMed] [Google Scholar]
- 26.Rizzuto, R., P. Bernardi, and T. Pozzan. 2000. Mitochondria as all-round players of the calcium game. J. Physiol. 529:37–47. [DOI] [PMC free article] [PubMed] [Google Scholar]
- 27.Montero, M., M. T. Alonso, E. Carnicero, I. Cuchillo-Ibanez, A. Albillos, A. G. Garcia, J. Garcia-Sancho, and J. Alvarez. 2000. Chromaffin-cell stimulation triggers fast millimolar mitochondrial Ca2+ transients that modulate secretion. Nat. Cell Biol. 2:57–61. [DOI] [PubMed] [Google Scholar]
- 28.Pinton, P., M. Brini, C. Bastianutto, R. A. Tuft, T. Pozzan, and R. Rizzuto. 1998. New light on mitochondrial calcium. Biofactors. 8:243–253. [DOI] [PubMed] [Google Scholar]
- 29.Pozzan, T., P. Magalhaes, and R. Rizzuto. 2000. The comeback of mitochondria to calcium signalling. Cell Calcium. 28:279–283. [DOI] [PubMed] [Google Scholar]
- 30.Gunter, T. E., and D. R. Pfeiffer. 1990. Mechanisms by which mitochondria transport calcium. Am. J. Physiol. 258:C755–C786. [DOI] [PubMed] [Google Scholar]
- 31.Szado, T., K. H. Kuo, K. Bernard-Helary, D. Poburko, C. H. Lee, C. Seow, U. T. Ruegg, and C. van Breemen. 2003. Agonist-induced mitochondrial Ca2+ transients in smooth muscle. FASEB J. 17:28–37. [DOI] [PubMed] [Google Scholar]
- 32.Koh, S. D., K. M. Sanders, and S. M. Ward. 1998. Spontaneous electrical rhythmicity in cultured interstitial cells of Cajal from the murine small intestine. J. Physiol. 513:203–213. [DOI] [PMC free article] [PubMed] [Google Scholar]
- 33.Koh, S. D., J. Y. Jun, T. W. Kim, and K. M. Sanders. 2002. A Ca2+-inhibited non-selective cation conductance contributes to pacemaker currents in mouse interstitial cell of Cajal. J. Physiol. 540:803–814. [DOI] [PMC free article] [PubMed] [Google Scholar]
- 34.Sneyd, J., K. Tsaneva-Atanasova, J. I. Bruce, S. V. Straub, D. R. Giovannucci, and D. I. Yule. 2003. A model of calcium waves in pancreatic and parotid acinar cells. Biophys. J. 85:1392–1405. [DOI] [PMC free article] [PubMed] [Google Scholar]
- 35.Sneyd, J., A. LeBeau, and D. I. Yule. 2000. Traveling waves of calcium in pancreatic acinar cells: model construction and bifurcation analysis. Physica D. 145:158–179. [Google Scholar]
- 36.Hodgkin, A. L., and A. F. Huxley. 1952. A quantitative description of membrane current and its application to conduction and excitation in nerve. J. Physiol. 117:500–544. [DOI] [PMC free article] [PubMed] [Google Scholar]
- 37.Lytton, J., M. Westlin, S. E. Burk, G. E. Shull, and D. H. MacLennan. 1992. Functional comparisons between isoforms of the sarcoplasmic or endoplasmic reticulum family of calcium pumps. J. Biol. Chem. 267:14483–14489. [PubMed] [Google Scholar]
- 38.Favre, C. J., J. Schrenzel, J. Jacquet, D. P. Lew, and K. H. Krause. 1996. Highly supralinear feedback inhibition of Ca2+ uptake by the Ca2+ load of intracellular stores. J. Biol. Chem. 271:14925–14930. [DOI] [PubMed] [Google Scholar]
- 39.Mogami, H., A. V. Tepikin, and O. H. Petersen. 1998. Termination of cytosolic Ca2+ signals: Ca2+ reuptake into intracellular stores is regulated by the free Ca2+ concentration in the store lumen. EMBO J. 17:435–442. [DOI] [PMC free article] [PubMed] [Google Scholar]
- 40.Higgins, E. R., M. B. Cannell, and J. Sneyd. 2006. A buffering SERCA pump in models of calcium dynamics. Biophys. J. 91:151–163. [DOI] [PMC free article] [PubMed] [Google Scholar]
- 41.Albrecht, M. A., S. L. Colegrove, and D. D. Friel. 2002. Differential regulation of ER Ca2+ uptake and release rates accounts for multiple modes of Ca2+-induced Ca2+ release. J. Gen. Physiol. 119:211–233. [DOI] [PMC free article] [PubMed] [Google Scholar]
- 42.Sneyd, J., K. Tsaneva-Atanasova, D. I. Yule, J. L. Thompson, and T. J. Shuttleworth. 2004. Control of calcium oscillations by membrane fluxes. Proc. Natl. Acad. Sci. USA. 101:1392–1396. [DOI] [PMC free article] [PubMed] [Google Scholar]
- 43.Gunter, T. E., D. I. Yule, K. K. Gunter, R. A. Eliseev, and J. D. Salter. 2004. Calcium and mitochondria. FEBS Lett. 567:96–102. [DOI] [PubMed] [Google Scholar]
- 44.Colegrove, S. L., M. A. Albrecht, and D. D. Friel. 2000. Quantitative analysis of mitochondrial Ca2+ uptake and release pathways in sympathetic neurons. Reconstruction of the recovery after depolarization-evoked [Ca2+]i elevations. J. Gen. Physiol. 115:371–388. [DOI] [PMC free article] [PubMed] [Google Scholar]
- 45.Colegrove, S. L., M. A. Albrecht, and D. D. Friel. 2000. a. Dissection of mitochondrial Ca2+ uptake and release fluxes in situ after depolarization-evoked [Ca2+] elevations in sympathetic neurons. J. Gen. Physiol. 115:351–370. [DOI] [PMC free article] [PubMed] [Google Scholar]
- 46.McHugh, J. M., and J. L. Kenyon. 2004. An Excel-based model of Ca2+ diffusion and fura 2 measurements in a spherical cell. Am. J. Physiol. Cell Physiol. 286:C342–C348. [DOI] [PubMed] [Google Scholar]
- 47.Wagner, J., and J. Keizer. 1994. Effects of rapid buffers on Ca2+ diffusion and Ca2+ oscillations. Biophys. J. 67:447–456. [DOI] [PMC free article] [PubMed] [Google Scholar]
- 48.Torihashi, S., T. Fujimoto, C. Trost, and S. Nakayama. 2002. Calcium oscillation linked to pacemaking of interstitial cells of Cajal: requirement of calcium influx and localization of TRP4 in caveolae. J. Biol. Chem. 277:19191–19197. [DOI] [PubMed] [Google Scholar]
- 49.Aoyama, M., A. Yamada, J. Wang, S. Ohya, S. Furuzono, T. Goto, S. Hotta, Y. Ito, T. Matsubara, K. Shimokata, S. R. Chen, Y. Imaizumi, and S. Nakayama. 2004. Requirement of ryanodine receptors for pacemaker Ca2+ activity in ICC and HEK293 cells. J. Cell Sci. 117:2813–2825. [DOI] [PubMed] [Google Scholar]
- 50.Liu, H. N., S. Ohya, S. Furuzono, J. Wang, Y. Imaizumi, and S. Nakayama. 2005. Co-contribution of IP3R and Ca2+ influx pathways to pacemaker Ca2+ activity in stomach ICC. J. Biol. Rhythms. 20:15–26. [DOI] [PubMed] [Google Scholar]
- 51.Park, K. J., G. W. Hennig, H. T. Lee, N. J. Spencer, S. M. Ward, T. K. Smith, and K. M. Sanders. 2006. Spatial and temporal mapping of pacemaker activity in interstitial cells of Cajal in mouse ileum in situ. Am. J. Physiol. Cell Physiol. 290:C1411–C1427. [DOI] [PubMed] [Google Scholar]
- 52.Lee, H. T., G. W. Hennig, N. W. Fleming, K. D. Keef, N. J. Spencer, S. M. Ward, K. M. Sanders, and T. K. Smith. (2007). Septal interstitial cells of Cajal conduct pacemaker activity to excite muscle bundles in human jejunum. Gastroenterology. 133:907–917. [DOI] [PMC free article] [PubMed] [Google Scholar]
- 53.Thomsen, L., T. L. Robinson, J. C. Lee, L. A. Farraway, M. J. Hughes, D. W. Andrews, and J. D. Huizinga. 1998. Interstitial cells of Cajal generate a rhythmic pacemaker current. Nat. Med. 4:848–851. [DOI] [PubMed] [Google Scholar]
- 54.Suzuki, H., H. Takano, Y. Yamamoto, T. Komuro, M. Saito, K. Kato, and K. Mikoshiba. 2000. Properties of gastric smooth muscles obtained from mice which lack inositol trisphosphate receptor. J. Physiol. 525:105–111. [DOI] [PMC free article] [PubMed] [Google Scholar]
- 55.Mak, D. O., S. McBride, and J. K. Foskett. 2001. Regulation by Ca2+ and inositol 1,4,5-trisphosphate (InsP3) of single recombinant type 3 InsP3 receptor channels. Ca2+ activation uniquely distinguishes types 1 and 3 InsP3 receptors. J. Gen. Physiol. 117:435–446. [DOI] [PMC free article] [PubMed] [Google Scholar]
- 56.Hirst, G. D., and S. M. Ward. 2003. Interstitial cells: involvement in rhythmicity and neural control of gut smooth muscle. J. Physiol. 550:337–346. [DOI] [PMC free article] [PubMed] [Google Scholar]
- 57.Ward, S. M., S. A. Baker, A. de Faoite, and K. M. Sanders. 2003. Propagation of slow waves requires IP3 receptors and mitochondrial Ca2+ uptake in canine colonic muscles. J. Physiol. 549:207–218. [DOI] [PMC free article] [PubMed] [Google Scholar]
- 58.Hatton, W. J., H. S. Mason, A. Carl, P. Doherty, M. J. Latten, J. L. Kenyon, K. M. Sanders, and B. Horowitz. 2001. Functional and molecular expression of a voltage-dependent K+ channel (Kv1.1) in interstitial cells of Cajal. J. Physiol. 533:315–327. [DOI] [PMC free article] [PubMed] [Google Scholar]
- 59.Hille, B. (2001). Ion Channels of Excitable Membranes, Sinauer, Sunderland, MA, ed. 3, 2001.