

Abstract
We have determined that adipocytes are a major site of expression of the transcript for the novel alcohol dehydrogenase (ADH), Adhfe1. Adhfe1 is unique in that the sequence of its encoded protein places it among the iron-activated ADHs. Western blot analysis reveals Adhfe1 encodes a 50 kDa cytoplasmic protein and immunocytochemical staining indicates mitochondrial localization. Adhfe1 transcript exhibits differentiation-dependent expression during in vitro brown and white adipogenesis. Unlike many adipocyte-enriched genes, however, Adhfe1 transcript expression in adipocytes is refractory to TNFα-mediated downregulation. However, use of pharmacological inhibitors reveals PI 3-kinase-mediated signals maintain the basal level of Adhfe1 transcript in 3T3-L1 adipocytes. Tissue profiling studies show Adhfe1 transcript is restricted to white and brown adipose tissues, liver, and kidney. In comparison to C57BL/6 mice, Adhfe1 transcript is downregulated 40% in white adipose tissue of ob/ob obese mice. Further characterization of Adhfe1 should yield new insights into adipocyte function and energy metabolism.
Keywords: adipocyte, adipose tissue, 3T3-L1, differentiation, adipogenesis, iron-activated, alcohol dehydrogenase, metabolism, TNFα, obesity
INTRODUCTION
NAD+ or NADP+-dependent alcohol dehydrogenases (ADHs) comprise an enzyme superfamily whose members have been demonstrated to have wide substrate specificities as well as various and extensive metabolic functions [9, 30, 31, 46, 54]. ADHs of higher organisms have been broadly classified as the medium-chain dehydrogenases/reductases (MDRs) [30, 45] and the short-chain dehydrogenase/reductases (SDRs) [48]. Two main types of MDR enzyme families are designated, based on whether zinc is present at the active site [31]. Human ADH genes are NAD+-dependent zinc-containing medium-chain enzymes and comprise five classes of seven genes total, clustered at chromosome 4 [30, 31, 45, 46, 82]. Likewise, SDRs encompass many distinct enzyme activities; these are related to mammalian prostaglandin dehydrogenases/carbonyl reductases and use a distinct catalytic mechanism from MDRs [30, 48]. In addition to the MDR and SDR enzyme families, a unique type of ADH has been recognized, designated “iron-activated”. Z. mobilis ADH2 was identified as the first such ADH in 1983 when it was demonstrated to be activated by ferrous ions [5, 44, 63]. Shortly thereafter, S. cerevisiae ADH4 [78] and E. coli propanediol oxidoreductase [6] were noted to share a significant degree of amino acid identity with Z. mobilis ADH2. Although this new type of ADH lacked homology with any other previously known ADHs [29], they were demonstrated to utilize ethanol, as well as number of other alcohols, as substrate(s) [6]. In the intervening years, a number of additional microbial enzymes of this iron-activated enzyme type have been described [11, 32, 50, 54, 73, 83]. Despite the nomenclature of “iron-activated” ADHs, these enzymes are variously activated by a range of divalent cations. It was presumed until recently that the iron-activated ADHs were restricted to microbes. However, in 2002 a cDNA for a putative iron-activated ADH, designated ADHFE1, was cloned by Mao and coworkers from a human fetal brain cDNA library [12]. Initial Northern blot analysis indicated that ADHFE1 transcript was expressed predominantly in adult liver and PCR-based detection indicated somewhat widespread expression in various fetal tissues [12]. The ADHFE1 protein sequence was described as lacking homology with MDRs or SDRs but did possess a conserved G-X-G-X-X-G NAD(H) fingerprint motif, a motif characteristic of the category I ADP binding βαβ folds of dinucleotide binding proteins [12, 77], including ADHs. The enzymatic activity of ADHFE1 remains to be investigated, however it possesses from 21–38% overall protein identity with various iron-activated microbial ADHs. A key distinction of the ADHFE1 protein sequence versus that of microbial iron-activated ADHs is the presence of an insert of 13 amino acid residues within its putative iron-binding region. ADHFE1 also lacks the second of the three conserved histidine residues at the iron-binding region [12]. For the microbial iron-activated ADHs it is these three histidine residues that are thought to be involved in metal binding [29]. These features indicate that human ADHFE1 and its homologs in other species, despite their similarity to iron-activated microbial ADHs, may be of a unique nature in regard to possible enzymatic activities, catalytic mechanism, expression pattern, and function.
The primary metabolic role of white adipose tissue (WAT) adipocytes is the storage of excess energy as triglyceride and mobilizing these to meet the energy demands of the organism. Additionally, adipose tissue is now recognized as an endocrine organ with synthesis and secretion of a number of soluble factors, some of which are adipocyte-derived, including leptin, resistin, and a variety of cytokines including TNFα [4, 7, 19, 35]. Adipose tissue is heterogeneous in nature in regard to cell types present. Adipocytes comprise roughly two-thirds of the cells found in adipose tissue. The remaining cell population of adipose tissue, collectively referred to as the stromal-vascular fraction comprised of endothelial cells, nerve cells, macrophages, fibroblast-like interstitial cells, preadipocytes, and likely other as yet to be identified cell types. In adipose tissue development mature adipocytes are thought to be formed by differentiation of preadipocyte precursors present in adipose tissue [3, 10, 17, 18, 40]. This process is accompanied by upregulation of genes that encode molecules central to adipogenesis and adipocyte function including those critical in lipogenesis, lipolysis, lipid transport, and hormone signaling [53]. For the past decades, in vitro preadipocyte cell lines such as 3T3-L1 have been extensively used to define genes central the adipocyte phenotype [16, 17]. A variety of in vitro and in vivo studies have determined that the peroxisome proliferator-activated receptor γ (PPARγ) a member of the ligand activated steroid hormone receptor family, is a master transcriptional regulator of the adipogenic program [15, 41, 55–57, 80], and has also illustrated the important contribution of the CCAAT/enhancer-binding protein (C/EBP) family of transcriptional regulators to adipogenesis [2, 58, 72, 79, 80]. However, recent intensive dissection of the adipocyte transcriptome by DNA oligonucleotide microarrays and other approaches has revealed that a number of additional signaling networks and protein families are likely involved in the regulation and/or maintenance of adipocyte differentiation and function [39, 43, 59, 64]. Furthermore, microarray assessments have revealed that some adipocyte-expressed genes are particularly enriched in the 3T3-L1 in vitro model of adipogenesis as compared to adipogenesis as it occurs in vivo [65]. Thus in regard to the discovery and characterization of new adipocyte-expressed genes, such distinctions between in vitro and in vivo adipogenesis have highlighted the importance of using approaches aimed at the identification of genes that are expressed in adipocytes in vivo.
We conducted differential screening of a WAT cDNA library to identify genes expressed in adipose tissue adipocytes but absent from the non-adipocyte stromal-vascular cell population of adipose tissue. We report herein the identification and characterization of murine Adhfe1 as new adipocyte-enriched gene. The unique nature of the encoded Adhfe1 protein among all known mammalian ADHs, our novel observation of expression of Adhfe1 in adipocytes in vivo, taken with the very limited study to date of human ADHFE1, led us to carry out a detailed assessment of expression and regulation of this gene in adipocytes and adipose tissue.
METHODS
Adipocyte Differentiation
3T3-L1 cells (American Type Culture Collection, Manassas, VA) were propagated in DMEM supplemented with 10% calf serum. For differentiation, 3T3-L1 cells were treated at two days post-confluence with DMEM supplemented with 10% FBS in the presence of the adipogenic inducers 0.5 mM methylisobutylxanthine (MIX) and 1 μM dexamethasone for 48 h. Adipogenic agents were then removed, and growth of cultures continued in DMEM containing 10% FBS. At five days post-induction of differentiation, adipocyte conversion had occurred in approximately 90% of the cells, as judged by lipid accumulation and cell morphology.
For differentiation of brown preadipocytes obtained from C.R. Kahn (Joslin Diabetes Foundation, Harvard Medical School, Boston, MA), the method was as previously described [34, 36]. Cells were cultured to confluence in DMEM with 10% FBS, 20 nM insulin and 1 nM triiodotyronine (differentiation medium per Kahn and colleagues [36]). Confluent cells were incubated in differentiation medium supplemented with 0.5 mM MIX, 0.5 μM dexamethasone, and 0.125 mM indomethacin for 48 h and medium was replaced with differentiation medium and was replenished every two days.
Cell Culture Treatments
For treatments of 3T3-L1 adipocytes with TNFα, cells were incubated with TNFα for indicated dose and time points. For studies of regulation by insulin, 3T3-L1 adipocytes were first cultured for 16 h in serum-free DMEM with 0.5% BSA. Cultures were then replenished with serum-free DMEM containing 0.5% BSA supplemented with the indicated concentration of insulin for 36 h. For treatment with various pharmacological inhibitors, after serum-starvation for 6 h, 3T3-L1 adipocytes were cultured in serum-free conditions supplemented with either 50 μM PD98059, 20 μM SB203580, 50 μM LY294002, 1 μM rapamycin (Sigma-Aldrich, St. Louis, MO), or DMSO vehicle for an additional 17 h. For assessment of time and dose response studies of Adhfe1 transcript regulation by ethanol, 3T3-L1 adipocytes were exposed to 50 mM or 100 mM of ethanol for 6, 12, 24, 48, or 72 h or 1 mM through 100 mM (1, 10, 25, 50, 100 mM) ethanol for 24, 48, or 72 h.
RNA Preparation and Northern Blot Analysis
RNA was purified using TriZol Reagent (Invitrogen Corp.) according to manufacturer’s instruction. For studies of Adhfe1 expression in murine tissues, 8 wk old C57BL/6 or ob/ob male mice were utilized, with all animal treatments conducted with the approval of the Medical University of Ohio Institutional Animal Care and Use Committee. Fractionation of whole adipose tissue into adipocyte fraction and stromal-vascular fraction was via collagenase digestion and differential centrifugation, as previously described [33, 34]. For Northern blot analysis, 5 μg of RNA was fractionated in 1% agarose-formaldehyde gels in MOPS buffer and transferred to Hybond-N membrane (GE Healthcare, Piscataway, NJ). Blots were hybridized in ExpressHyb solution (BD Biosciences Clontech, Palo Alto, CA) with 32P-labeled murine cDNA probes as indicated. After washing, membranes were exposed at −80°C to Kodak Biomax film with a Kodak Biomax intensifying screen or to a phosphorimager screen. For quantitative assessments, to correct for variation in mass of RNA per gel lane, the same blot was hybridized with a probe for 36B4 transcript, which encodes the acidic ribosomal phosphoprotein PO, a commonly employed internal control [38]. The ratio of expression signal for Adhfe1 transcript to 36B4 transcript for each sample was determined using a Typhoon 8600 PhosphorImager and ImageQuant software (GE Healthcare). Statistical analyses were conducted using single factor ANOVA.
DNA Array Hybridization
For array analysis, arrays contained ~400 inserts of a subtracted ob/ob adipose tissue library that we had previously generated with PCR-Select cDNA Subtraction kit (BD Biosciences Clontech) for use in another project and that we have found to be a good source of adipocyte-enriched cDNAs. Filter arrays were prepared by PCR amplification of cDNA inserts directly from the arrayed bacterial stocks of the cDNA library using a nested primer set provided with the PCR-Select cDNA Subtraction kit. After denaturing the PCR products by incubation in 0.6 N NaOH, DNA was spotted onto Hybond-N+ nylon membranes (GE Healthcare) and membranes neutralized with 0.5 M Tris-HCl (pH 7.5), followed by fixation to the membrane by UV-cross-linking. After prehybridization at 65°C for 1 h in 5 ml ExpressHyb solution containing 50 μl of 20X SSC and 50 μg of salmon sperm DNA, duplicate arrays were hybridized overnight at 65°C. Hybridization probes were reverse-transcribed 32P-labeled cDNAs were synthesized from 8 μg of total RNA from murine stromal-vascular fraction or the adipocyte fraction of adipose tissue of C57BL/6 mice. Post-hybridization, filters were subjected to four incubations in low-stringency wash solution (2X SSC and 0.5% SDS) at 65°C for 20 min each and two 20 min incubations in high-stringency wash solution (0.2X SSC and 0.5% SDS) at 65°C and membranes were exposed at −80°C to Kodak BioMax film with a Kodak BioMax intensifying screen.
Murine Adhfe1 Expression Constructs
Expression constructs for Adhfe1 were generated by PCR amplification of coding sequences using a murine I.M.A.G.E clone, GenBank accession number BC_026584 as template. For preparation of a murine Adhfe1 expression construct, in which a C-terminal HA epitope tag was fused to the Adhfe1 coding sequence, a 5′ PCR primer incorporating the first ATG sequence (designated M1) (5′-ATTCATGCTAGCATGGCTGCAGCTGCACGCGCT-3′) was used. A second version of this expression construct was generated by making a 5′ PCR primer that lacked the initial ATG but incorporated the second in-frame ATG (designated M2) (5′-GCATGCTAGCATGGCTGTCTCAAATATTAGATATGGAGCAG-3′). For generation of both the M1 and M2 constructs, the 3′ PCR primer utilized incorporated a C-terminal HA tag followed by a stop codon (5′-GGCAGCGGCCGCTTAAAGAGCGTAATCTGGAACATCGTATGGGTAGTACAGTTTCAT GGATGCTTC-3′). In these instances, a 5′ Nhe I sites and a 3′ Not I site were incorporated into respective primers to facilitate directional cloning into the pcDNA3.1 vector (Invitrogen Corp.).
Western Blot Analysis of Adhfe1 Protein Expression
For in vitro transcription and translation, we utilized an Adhfe1 PCR product or HA tagged Adhfe1 expression constructs (described above) as template. For the former case, the 5′ PCR primer included a sequence for T7 polymerase priming using the 5′ primer (5′-CTTATCGAAATTAATACGACTCACTATAGGGCTGCCATGGCTGCAGCTGCAC-3′) and a C-terminal HA tag with the 3′ primer (5′-GGCAGCGGCCGCTTAAAGAGCGTAATCTGGAACATCGTATGGGTAGTACAGTTTCAT GGATGCTTC-3′); the BC_026584 Adhfe1 clone was used as PCR template. A TNT Quick Coupled kit (Promega Corp.) was utilized for in vitro transcription and translation. For reactions using the PCR product as template, 20 cycles of PCR were conducted using the above-indicated primers and 2.5 μl of this reaction, or a negative control reaction without DNA, was used as template for coupled in vitro transcription and translation. Reactions were incubated at 30oC for 90 min at which time 1 μl of the respective reaction was analyzed on 8% SDS-PAGE, followed by overnight transfer to Immobilon PVDF membrane (Millipore Corp.) For signal detection, membranes were blocked by 1 h incubation in 5% nonfat milk/0.5% Tween 20 in PBS and membranes were then incubated with a 1:4000 dilution of anti-HA primary antibody (Santa Cruz Biotechnology) for 1 h followed by three 10 min washes. Secondary antibody was goat anti-mouse at a dilution of 1:4000 for 1 h followed by three 10 min washes. All washes were in 0.5% Tween 20 in PBS. Signal was visualized using the SuperSignal detection system (Pierce Biotechnology, Rockford, IL).
For protein expression in COS cells, cells were transfected with the indicated HA tagged Adhfe1 expression constructs or empty pcDNA3.1 vector using Lipofectamine 2000 reagent, according to manufacturer instructions (Invitrogen Corp.). Cells were harvested at 48 h post-transfection by lysis in TNN(+) buffer (10 mM Tris pH 8.0, 120 mM NaCl, 0.5% NP-40, 1 mM EDTA, supplemented with a protease inhibitor cocktail). Lysates were incubated on ice for 30 min with intermittent vortexing, supernatant collected via centrifugation, and protein content determined (Bio-Rad Laboratories). 30 μg of protein was fractionated on 8% SDS-PAGE, followed by Western blot analysis as described above.
Immunocytochemistry and Intracellular Localization Studies
For immunostaining studies, COS cells were plated on coverslips and transfected with HA tagged full-length Adhfe1 in pcDNA3.1 vector using Lipofectamine 2000. 48 h after transfection, cells were incubated in growth medium containing 50 nM MitoTracker CMX Ros (Invitrogen Corp.) for 45 min. Cells were then washed twice with PBS and fixed with 100% ice-cold methanol for 10 min., washed again with PBS followed by incubation in 0.1% BSA in PBS for 30 min at room temperature. After blocking, cells were incubated with monoclonal (1:100, Covance Research Products, Inc.) or polyclonal HA (1:200, Covance Research Products, Inc.) primary antibody in 0.1 % BSA in PBS for 1.5 hours. Cells were then washed with 0.1% BSA in PBS three times and incubated with Alexafluor 568-conjugated goat anti-mouse secondary antibody (1:800, Invitrogen Corp.) or FITC-conjugated goat anti-rabbit secondary antibody (1:200, Bio-Rad), as indicated. In some instances, following immunostaining, cells were washed with dH2O and incubated with 10 nM DAPI (Invitrogen Corp.) for 10 min. to stain nuclei. Coverslips were mounted on glass slides and cells were observed at 400X using a Nikon Eclipse E800 fluorescence microscope equipped with a digital camera and image acquisition and merging was performed with Image-Pro Plus software (Media Cybernetics, Carlsbad, CA).
RESULTS
Differential Screening for Genes Induced during In Vivo Adipogenesis Identifies Adhfe1 as a New Adipocyte-Expressed Transcript
To identify genes present in adipocytes within adipose tissue but absent from the stromal vascular component of adipose tissue, we differentially screened ~400 clones of an adipose tissue cDNA library using reverse-transcribed probes derived from murine stromal-vascular fraction of adipose tissue and adipose tissue adipocyte RNA. Signal intensities were visually compared to identify genes enriched in adipocytes and inserts of differentially expressed cDNA clones were sequenced. Of the library clones screened we found that 13% showed enriched (~ a greater than 5-fold higher signal) in the adipocyte fraction vs. the stromal vascular fraction, 9% were similarly enriched for signal in the stromal-vascular fraction, and 50% showed essentially similar signal strength with the adipocyte fraction and stromal-vascular fraction reverse-transcribed probes. Signals for 29% of the library clones were not appreciably different from background levels, and thus their differential expression was unable to be determined. In addition to the identification several clones for a number of well-known adipocyte marker genes such as aFABP and SCD1, we identified a sequence for a novel ADH, Adhfe1. A portion of the results of cDNA array hybridization is shown in Figure 1A, wherein arrows indicate differentiatial signals for Adhfe1. Two cDNA library clones for Adhfe1 were found on the filter array. One of these contained sequence for a 3′ untranslated region of Adhfe1 corresponding to nucleotides 1458–1608 of the NM_175236 GenBank reference sequence for Adhfe1. The second cDNA clone contained sequences from 1407–1625 of the NM_175236 sequence, corresponding to the extreme C-terminus of the Adhfe1 protein and a portion of the 3′ untranslated region. Northern blot analysis using the insert from the second clone as probe confirmed expression of Adhfe1 transcript in adipocytes and lack of signal in cells of the stromal-vascular fraction of adipose tissue, Figure 1B. The Adhfe1 transcript evidenced an adipocyte-enriched expression similar to that of stearoyl Co-A desaturase 1 (SCD1), a well-characterized adipocyte gene [47]. Of interest is that the single species of transcript of approximately 2 kb that we detect for Adhfe1 by Northern blot analysis differs considerably in length from the 3,108 bases in the NM_175236 sequence. A possible explanation for this is the use of alternate multiple polyadenylation signals; several consensus AATAAA polyadenylation signals are present within the NM_175236 3′ untranslated region at a positions predicted to result in an Adhfe1 transcript size consistent with that we detect by Northern blot analysis.
Figure 1. Differential Screening Identifies Enrichment of Adhfe1 in Adipose Tissue Adipocytes.
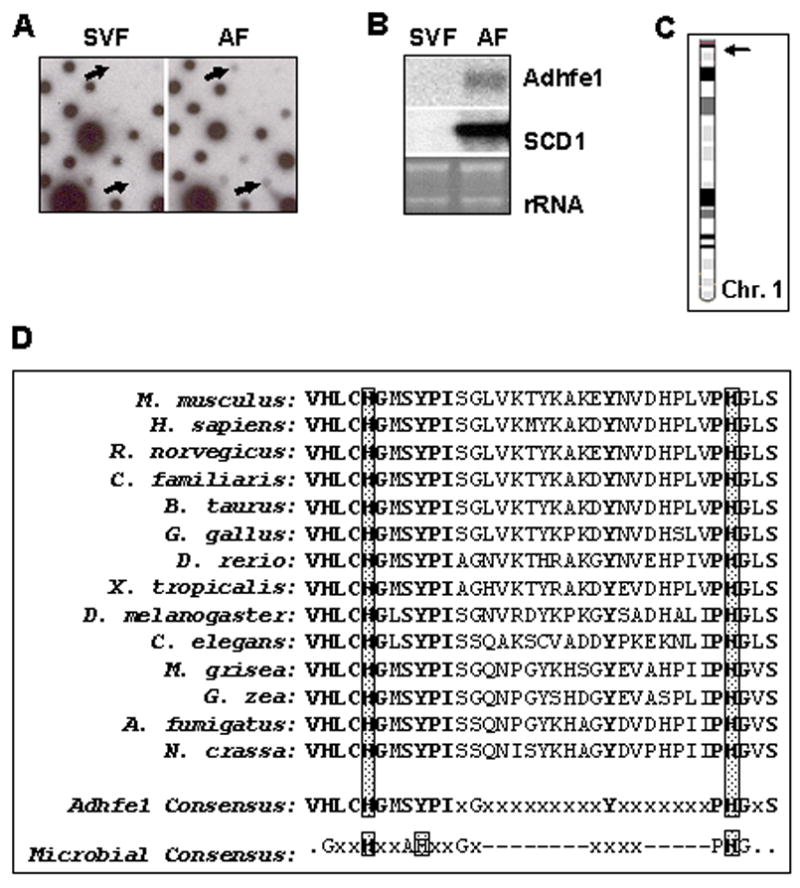
A: Initial dot-blot differential screening. An adipose tissue cDNA library was hybridized with reverse-transcribed probes from stromal-vascular fraction (SVF) and adipocyte fraction (AF) RNA of C57BL/6 mice. The arrows indicate position of Adhfe1 signal on the dot-blot. B: Validation of differential screening by Northern blot analysis. Northern blot analysis shows Adhfe1 and SCD1 level in SVF and AF. The EtBr staining of rRNA is shown as a gel loading control. Northern blot is representative of n=2. C: Chromosomal location of mouse Adhfe1. The mouse Adhfe1 gene (arrow) is located on mouse chromosome 1 A2. D: Amino acid alignment of the proposed iron-binding motif. The microbial consensus indicates the iron-binding motif of microbial iron-activated ADHs postulated by Bairoch and coworkers [23]. The multiple alignment was generated with DS Gene version 1.5 (Accelrys Inc.) using the Clustal W algorithm. Invariant amino acids are shown in bold and histidine residues in the conserved iron-binding motif are boxed. The GenBank sequence data for each listed species is: M. musculus, NP_780445; H. sapiens, NP_653251; R. norvegicus, NP_001020594; C. familiaris, XP_849448; B. taurus, XP_584372; G. gallus, XP_424090; D. rerio, NP_996969; X. tropicalis, NP_989277; D. melanogaster, NP_477209; C. elegans, NP_496764; M. grisea, XP_361350; G. zea, XP_389421; A. fumigatus, XP_749583; N. crassa, XP_323397.
Because the Adhfe1 sequence(s) we cloned was for a partial cDNAs corresponding to just several hundred nucleotides of mostly 3′ untranslated region, we used sequence information in the NCBI Unigene database to design PCR primer pairs and cloned a cDNA for the complete open reading frame of Adhfe1 from murine WAT. Although several full-length Adhfe1 cDNAs were available as through I.M.A.G.E. clone collections, none of these originated from adipose tissue and we thought it important to confirm the sequence of the Adhfe1 transcript as it occurs in WAT. Sequencing of an RT-PCR product corresponding to the Adhfe1 open reading frame verified that it was identical to the Adhfe1 open reading frame of the NCBI GenBank reference sequence, accession number NM_175236. Use of the information present in the Ensembl database (www.ensembl.org) indicates that the Adhfe1 gene consists of 15 exons spanning 29 kb. In silico evidence indicates that the smallest exon, exon 5, undergoes alternate splicing, this event does not alter the encoded Adhfe1 protein. The Adhfe1 gene is present on murine chromosome 1, Figure 1C.
Murine Adhfe1 is comprised of 465 amino acids with a calculated molecular mass of 49,937 Da and a pI of 7.55 with start and stop codons at nucleotides 15 and 1412 of the NM_175236 Adhfe1 transcript sequence, respectively. The full-length protein sequence of murine Adhfe1 possesses 90% amino acid identity with the human protein, 98% with the rat protein, and 85% with that of chicken. Moreover, this protein sequence is well-conserved in invertebrates with an overall ~60% amino acid identity with D. melanogaster and ~50% for C. elegans. It also evidences conservation in plants and fungi with ~50% identity between murine and M. grisea (rice) Adhfe1 and ~50% identity between murine and N. crassa Adhfe1. As previously described for human ADHFE1 [12], murine Adhfe1 contains the NAD(H) binding fingerprint motif of G-X-G-X-X-G [77], at amino acid residues 318–323 and has no evident homology with the MDR or SDR ADHs. Our protein sequence analyses of murine Adhfe1 using ProSite [23] and InterPro [42] databases confirm that, as described by Mao and coworkers for human ADHFE1 [12], it appears to be the first and to date only known member of the iron-activated ADH family that has been identified in higher organisms. The amino acid sequence at the putative iron-binding region of Adhfe1 present across a number of vertebrate, invertebrate, and microbial species is shown in Figure 1D. The lower portion indicates a consensus sequence for this region with amino acid residues that evidence absolute conservation across all listed species of Adhfe1 depicted in bold typeface. However, only a subset of these amino acid residues are conserved between the putative iron-binding region of Adhfe1 and the type of amino acids found at the signature iron-binding region of the microbial iron-activated ADHs, shown just below the Adhfe1 consensus sequence, Figure 1D. This raises the possibility that while the overall amino acid sequence of Adhfe1 very closely resembles that of the iron-activated ADHs from microbes, it has also diverged in that it possesses significant sequence differences, and thus likely functional distinctions, from the microbial iron-activated ADHs.
Adhfe1 Encodes a Novel 50 kDa Protein and Evidences Mitochondrial Localization
To assess the size of the Adhfe1 primary translation product, we carried out coupled in vitro transcription and translation with a PCR product for Adhfe1, wherein a synthetic T7 polymerase priming site was present 5′ to the beginning to the Adhfe1 5′ untranslated sequence and an HA tag was present in frame at the C-terminus of the Adhfe1 open reading frame. Western analysis in Figure 2A shows that this reaction template resulted in a major ~50 kDa protein species (lane 2, asterisk), a mass in good agreement with that of the predicted primary amino acid sequence of Adhfe1. In addition, we noted the presence of a second slightly smaller protein species in these reactions (lane 2, arrow). Examination of the 5′ region of the Adhfe1 nucleotide sequence indicates that in addition to the presumed initiator methionine, which is the first ATG present at position 15 of the NM_175236 sequence, there are several in-frame ATGs shortly thereafter. To test the hypothesis that the smaller protein species derived from use of the second in-frame ATG at position 153, we engineered two mammalian expression constructs for Adhfe1. One of these, designated Adhfe1-(M1), encompassed the first ATG and remaining Adhfe1 sequence thereafter. The second construct, designated Adhfe1-(M2), lacked the first ATG and encompassed the second in-frame ATG. 3′ HA tagged versions of these two constructs were used as template for in vitro transcription and translation. Lanes 3 and 4 of Figure 2A indicated that use of Adhfe1-(M1) as template generated two protein species of a molecular mass consistent with that found when the Adhfe1 PCR product template was used. Adhfe1-(M2) generated a protein species whose mass is consistent with that of the smaller of the two protein species observed when Adhfe1-(M1) was utilized as template. This product is a similar mass as that of the faintly present smaller protein band that was observed when the Adhfe1 PCR product template was used to program the in vitro transcription and translation reaction. This suggests that initiation of translation at the second in-frame ATG was likely responsible for the generation of the minor Adhfe1 protein species, a form that would lack the 46 N-terminal amino acids. We also assessed the size of the Adhfe1 protein upon ectopic expression of HA tagged Adhfe1 via transfection of COS cells. Adhfe1-(M1) expression in cells gives rise to protein products of the same mass found upon in vitro transcription and translation (asterisk and arrow, Figure 2B) and raises the possibility that Adhfe1 may be represented by two protein species in mammalian cells. As anticipated from the in vitro transcription and translation data (Figure 2B), Adhfe1-(M2) expression generates only the smaller of the two protein species. Prior to the availability of an Adhfe1 antibody it is not possible to know if two Adhfe1 protein species are present endogenously. However our observations raise the possibility that this may be the case; as such there may be distinctions between the functions of the respective proteins. In addition the observation that the molecular mass found for the Adhfe1 protein upon expression in mammalian cells is the same as that of the Adhfe1 primary translation product suggests that the Adhfe1 protein does not undergo those types of post-translational modifications, such as glycosylation, that would result in a significant alterations in the mass of the primary translation product.
Figure 2. Murine Adhfe1 is a 50 kDa Protein with Mitochondrial Localization.
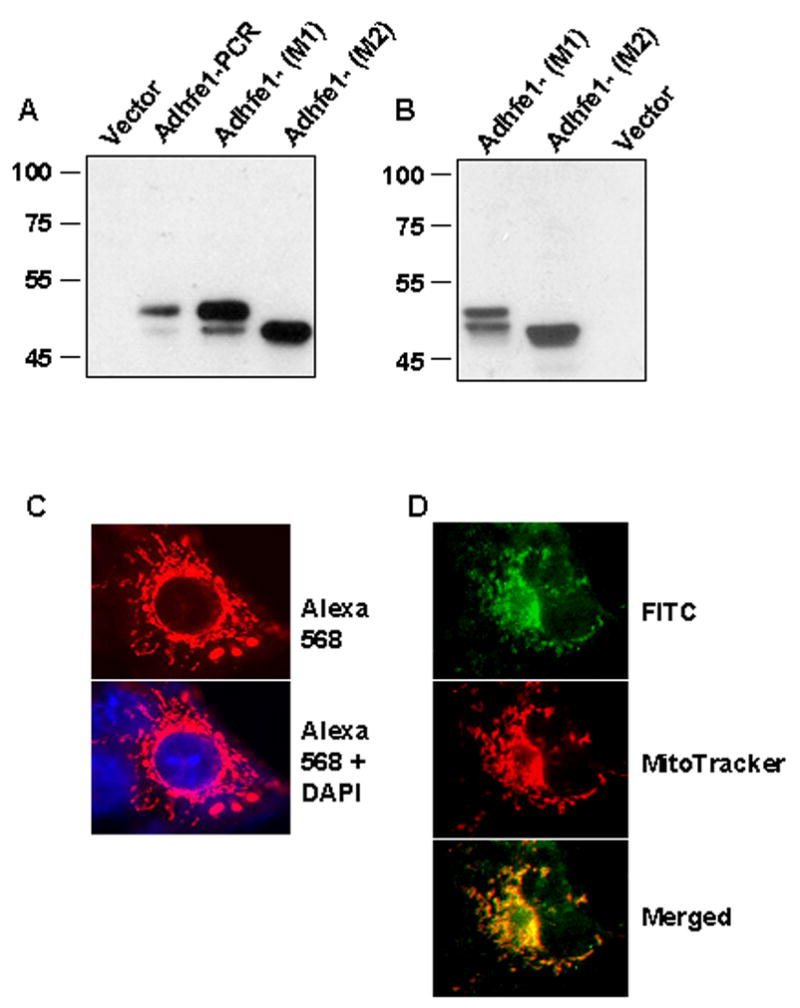
A: In vitro transcription and translation of Adhfe1. Adhfe1 PCR product and Adhfe1 expression constructs with sequence starting at the first ATG (M1) or lacking the first ATG and starting at the second ATG (M2) were transcribed and translated as described under “Materials and Methods” with empty vector used as a negative control. The in vitro translation products were analyzed by Western blot using anti-HA primary antibody. Asterisk indicates major Adhfe1 protein species and the arrow indicates minor Ahdfe1 protein species that is attributed to translation from second ATG when the M1 construct was used as template. B: Expression of Adhfe1 protein. COS cells were transfected with empty pcDNA3.1 vector or a HA tagged Adhfe1 constructs and analyzed by Western blot using anti-HA primary antibody. C: Localization of Adhfe1 protein. COS cells were transfected with HA-tagged Adhfe1construct. Immunostaining was carried out with anti-HA primary antibody and AlexaFluor 586-conjugated secondary antibody, resulting in a red signal (top panel). The lower panel shows merged image from AlexaFluor 586 and DAPI nuclear staining. D. Adhfe1 Localizes to Mitochondria. COS cells were transfected with an HA-tagged Adhfe1construct. Immunostaining was carried out with anti-HA primary antibody and FITC-conjugated secondary antibody resulting in a green signal for Adhfe1 (top panel). Middle panel shows MitoTracker CMX Ros staining, visualized as red signal and the lower panel the merged image where yellow signal indicates overlap of Adhfe1 and MitoTracker staining. Protein expression studies are representative of n=2.
We next determined the subcellular distribution of Adhfe1 protein. Full length HA-tagged Adhfe1 was expressed in COS cells by transient transfection and subjected to immuncytochemical staining utilizing an anti-HA antibody. As shown by the photomicrographs in Figure 2C, we detected signal for Adhf1 in a discrete pattern in the cytoplasm that resembled mitochondrial staining. To better assess the possibility of mitochondrial localization for Adhfe1, we utilized the mitochondrial specific molecular probe, MitoTracker CMX Ros. These results are shown in Figure 2D, where the Adhfe1 is detected by a FITC-labeled secondary antibody, and is thus green, and the MitoTracker signal is red. When assessed individually, the staining pattern of Adhfe1 is highly similar with that of MitoTracker. The localization of Adhfe1 to mitochondria is, moreover, apparent in the merged image where co-localization of the Adhfe1 and MitoTracker is observed as yellow signal.
Differentiation-Dependent Expression of Adhfe1 in White and Brown Adipogenesis
The presence of Adhfe1 transcript in the adipocyte component of adipose tissue and its absence from the stromal-vascular population, the latter of which contains adipocyte precursors and a number of other cell types, raised the possibility that Adhfe1 is a differentiation-dependent gene whose expression emerges as preadipocytes differentiate into mature adipocytes. We conducted studies to further assess the expression and regulation of this gene in adipogenesis using the well-established 3T3-L1 in vitro model of white adipogenesis and a model for in vitro brown adipogenesis developed by Kahn and colleagues [36]. The Northern blot analysis in Figure 3A shows the level of Adhfe1 transcript in a time course of 3T3-L1 adipose conversion from the preadipocyte stage (P) and at daily intervals through 7 days. Adhfe1 transcript is first detected at 3 days post-onset of the differentiation program and reaches a maximal level by day 6. The emergence of Adhfe1 during adipogenesis is preceded by maximal upregulation of the master adipogenic transcription factor PPARγ, and parallels that of two well-characterized adipocyte marker transcripts, SCD1 and adipocyte fatty acid binding protein (aFABP). We also assessed the response of the Adhfe1 transcript level in 3T3-L1 preadipocytes to the individual components of the adipogenic differentiation cocktail, dexamethasone and MIX. Northern blot analysis data in Figure 3B indicates that, as we note for SCD1 and aFABP, treatment with either dexamethasone or MIX alone for 48 h followed by assay at 5 days post-induction failed to result in emergence of Adhfe1 transcript. This suggests that Adhfe1 transcript expression is tightly tied to adipogenesis, rather than being merely a gene that is upregulated by one of the individual components of the standard adipogenic cocktail. In addition, assessment of Adhfe1transcript level, employing various hormones, growth factors, cytokines and other agents, failed to result in the expression of detectable levels of Adhfe1 transcript in 3T3-L1 preadipocytes (data not shown). We also determined if Adhfe1 transcript level in 3T3-L1 adipocytes was responsive to addition of ethanol to the culture media. Time and dose response studies revealed that exposure to nanomolar through millimolar range of ethanol failed to alter the Adhfe1 transcript level, data not shown. Lastly, we addressed the expression of Adhfe1 transcript in an in vitro model of brown adipogenesis, Figure 3C, reveals upregulation of Adhfe1 occurs during the conversion of brown preadipocytes to mature brown adipocytes; here effective brown adipocyte differentiation is evidenced by expression of two brown adipocyte markers, Cidea and uncoupling protein 1 (UCP1). These in vitro findings suggest that expression of Adhfe1 is tightly tied to the adipocyte phenotype and that it performs a function required by both white and brown adipocytes.
Figure 3. Upregulation of Adhfe1 is Closely Tied to White and Brown Adipogenesis.
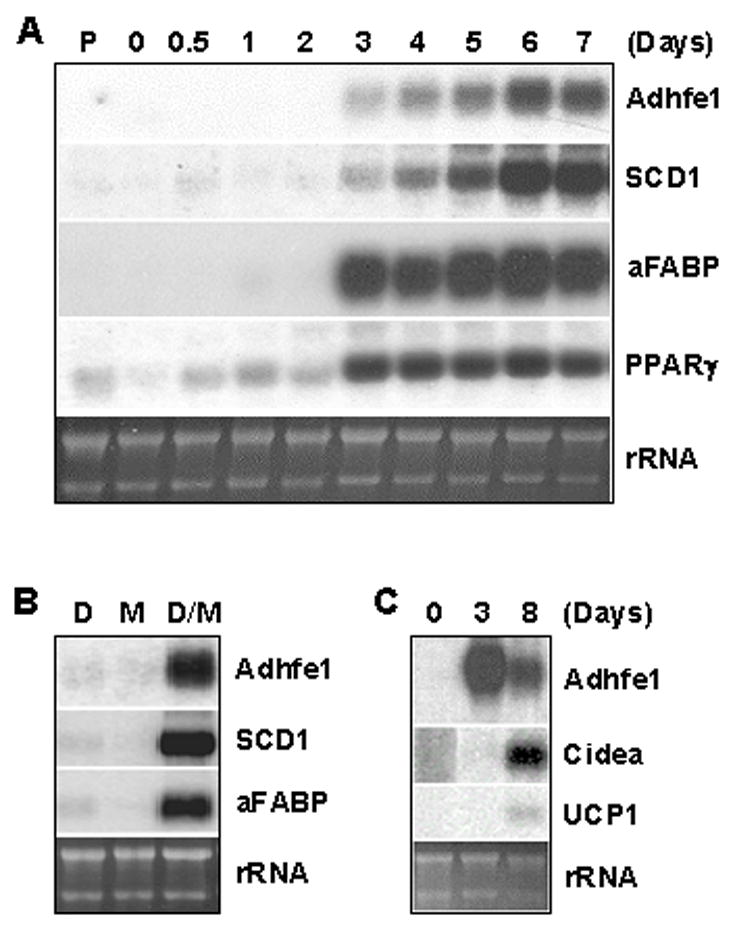
A: Adhfe1 upregulation during 3T3-L1 differentiation. 5 μg of total RNA from 3T3-L1 preadipocytes (P), confluent 3T3-L1 cells before induction of adipogenesis (day 0) and indicated time points after induction of adipogenesis were analyzed by Northern blot using Adhfe1, SCD1, aFABP, and PPARγ cDNA probes. B: Regulation of Adhfe1 transcript expression. Post-confluent 3T3-L1 cells were treated with 1 μM dexamethasone (D), 0.5 mM MIX (M), or 1 μM dexamethasone and 0.5 mM MIX (D/M) for 48 h and harvested at day 5. Northern blot analysis was performed with murine Adhfe1, SCD1, and aFABP probes. C: Adhfe1 transcript expression in brown adipogenesis. Brown preadipocytes were differentiated as described in “Materials and Methods” at confluence (day 0). Brown adipocytes were harvested at 3 and 8 days and Northern blot analysis was performed with murine Adhfe1, Cidea, and UCP1 probes. For A-C, the EtBr staining of rRNA is shown as a gel loading control. Northern blots are representative of n=2.
Adhfe1 Transcript Expression in 3T3-L1 Adipocytes is Refractory to Regulation by TNFα or Insulin and Involves PI 3-Kinase-Mediated Signals
To begin to investigate the signals that might regulate Adhfe1 transcript level in adipocytes, we treated 3T3-L1 adipocytes with an agent closely tied to adipocyte function and phenotype, TNFα [22, 52, 61, 62]. Treatment of preadipocytes with TNFα inhibits adipogenic conversion [71, 81] and treatment of adipocytes results in what has been termed "dedifferentiation" [70, 71, 75]. Exposure of adipocytes to TNFα has long been known to promote adipocyte lipolysis [66, 70]; this can be partly attributed to TNFα-mediated inhibition of LPL activity, which was first noted two decades ago [1, 8, 51]. The dedifferentiated phenotype that results from TNFα treatment has been ascribed, at least in part, to the TNFα-mediated transcriptional downregulation of the master adipocyte transcription factor PPARγ and thus the subsequent loss of PPARγ-mediated transactivation of select adipocyte genes [81]. TNFαhas also been demonstrated to downregulate the adipogenic transcription factor C/EBPα [27, 67]. That the effects of this cytokine are of a global nature is evidenced by the comprehensive oligonucleotide microarray assessments transcriptional response of 3T3-L1 adipocytes to TNFα by Lodish and coworkers, with major large scale and rapid effects reported [60]. Results of these studies led to the overall conclusion that TNFα treatment of adipocytes resulted in decreased expression of many adipocyte-abundant genes with concomitant selective induction of preadipocyte genes.
Given the central role for TNFα in adipocyte gene expression, metabolism and physiology, we next used Northern blot analysis to examine time and dose-dependent effects of TNFα on Adhfe1 transcript level in 3T3-L1 adipocytes. To ensure that the TNFα treatment regimen was effective in our hands the identical blot was also probed for detection of transcripts previously demonstrated to be downregulated by TNFα treatment of 3T3-L1 adipocytes; PPARγ, adipose triglyceride lipase (ATGL), and resistin [14, 34, 81, 84]. Figure 4A shows a time course assessment of transcript levels in untreated 3T3-L1 adipocytes (0) through 48 h of TNFα treatment. As expected, a rapid and robust downregulation of PPARγ, ATGL, resistin, and SCD1 is noted within 12 h of TNFα exposure. Given the large proportion of adipocyte-abundant transcripts that DNA oligonucleotide microarray studies have indicated are TNFα-responsive in 3T3-L1 adipocytes [60–62], we were rather surprised to find that Adhfe1 transcript level was refractory to alteration by TNFα treatment. Exposure of 3T3-L1 adipocytes to nanomolar through micromolar concentrations of TNFα for 24 h (Figure 4B) was consistent with data in Figure 4A in that while ATGL, resistin, and SCD1 were responsive to TNFα, Adhfe1 transcript level was not altered by either low or high concentrations of TNFα. These data place Adhfe1 in a novel subset of adipocyte-enriched genes that is refractory to the effects of TNFα. In addition, robust expression of Adhfe1 transcript persisted in spite of a marked TNFα-mediated downregulation of PPARγ, suggesting that expression of Adhfe1 in adipocytes is not solely dependent on PPARγ transcriptional signals. This raises the possibility that perhaps a unique set of transcriptional signals may underlie the differentiation-dependent upregulation of Adhfe1 in adipogenesis as well as the maintenance of its transcript level in the mature adipocyte.
Figure 4. Adhfe1 Transcript Level in 3T3-L1 Adipocytes is Refractory to TNFα-Mediated Effects.
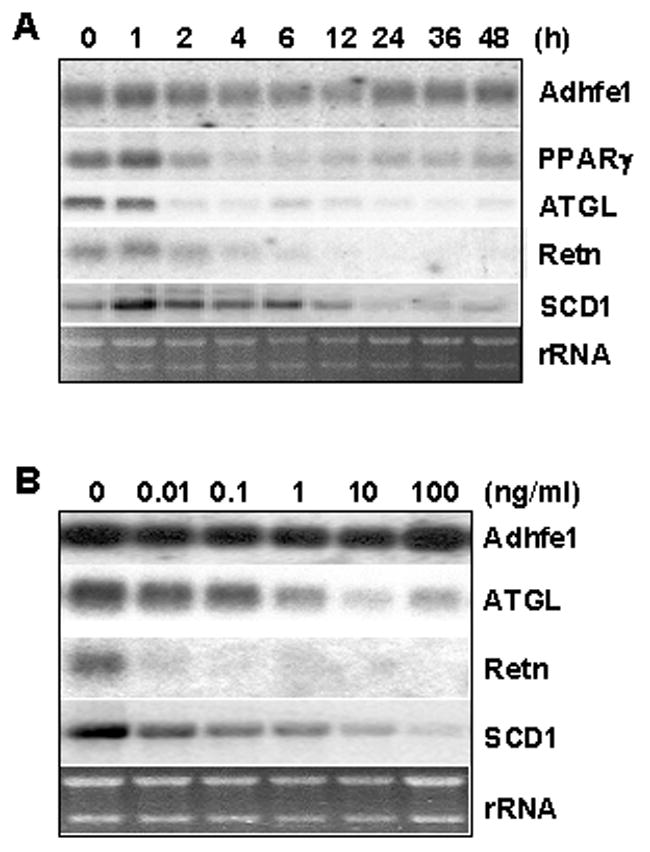
A: 3T3-L1 adipocytes were treated with 10 ng/ml of TNFα for the indicated time points. 5 μg of total RNA was analyzed by Northern blot using Adhfe1, PPARγ, ATGL, and resistin (Retn), and SCD1 probes. B: 3T3-L1 adipocytes were treated with indicated dose of TNFα for 24 h and Adhfe1, ATGL, resistin (Retn), and SCD1 expression were analyzed by Northern blot. For A and B, the EtBr staining of rRNA is shown as a gel loading control. Northern blots are representative of n=2.
Given that we failed to demonstrate an effect of TNFα on Adhfe1 gene expression level in adipocytes, we screened a number of other hormones and cytokines in an effort to elucidate the possible signals underlying control of Adhfe1 transcript expression in 3T3-L1 adipocytes. We first assessed the effect of insulin, a key signaling molecule in adipocyte metabolism, on levels of endogenous Adhfe1 in 3T3-L1 adipocytes. Adipocytes were exposed to nanomolar through micromolar concentrations of insulin for 36 h under serum-free culture conditions and the level of Adhfe1 transcript assessed by Northern blot. Data in Figure 5A demonstrates that as previously reported, ATGL transcript is downregulated by insulin [34] and in contrast Adhfe1 transcript level is refractory to insulin treatment. We also assessed the response of Adhfe1 transcript in 3T3-L1 adipocytes to dexamethasone, IL-6, lipopolysaccharide, glucose, forskolin, isoproterenol, and FBS; none of these agents resulted in demonstrable alterations of Adhfe1 transcript level (data not shown). Lastly, to gain insight into the signals underlying adipocyte expression of Adhfe1, we treated 3T3-L1 adipocytes with set of specific pharmacological inhibitors for various intracellular signaling pathways and determined their impact on endogenous Adhfe1 transcript level by Northern blot analysis. As shown in Figure 5B, the level of Adhfe1 transcript in 3T3-L1 adipocytes was not altered by exposure to either a p44/42 MAP kinase inhibitor PD98059, a p38 MAP kinase pathway inhibitor SB203580, nor a p70 S6 kinase inhibitor rapamycin. In contrast, endogenous Adhfe1 transcript was markedly decreased upon incubation of 3T3-L1 adipocytes with LY294002, an inhibitor of PI 3-kinase. Neither ATGL nor 36B4 transcript levels are altered by these agents, this indicates a selective response of the Adhfe1 transcript to LY294002. Figure 5C shows assessment of the LY294002 effects in triplicate independent cell cultures.
Figure 5. Regulation of Adhfe1 Transcript in 3T3-L1 Adipocytes by PI 3-kinase Pathway.
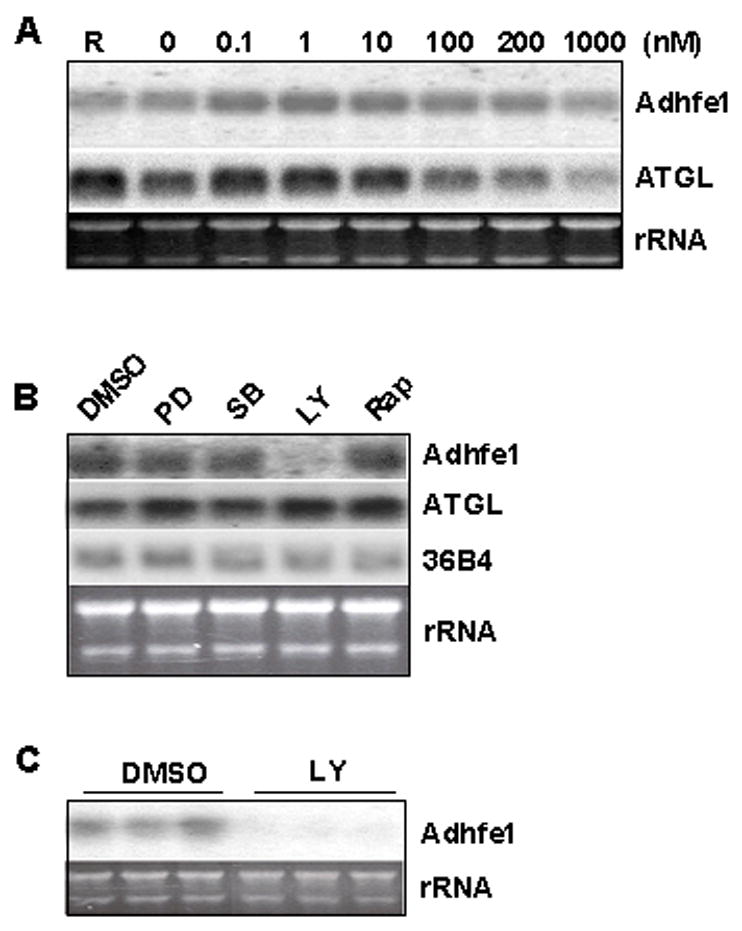
A: No effect of insulin on Adhfe1 transcript in 3T3-L1 adipocytes. 3T3-L1 adipocytes were incubated in regular growth medium (R) or in serum-free medium for 16 h, at which time serum-free cultures were further incubated with the indicated concentration of insulin for 36 h. 5 μg of total RNA was analyzed by Northern blot using Adhfe1 and ATGL probes. B: Downregulation of Adhfe1 by PI 3-kinase inhibitor. 3T3-L1 adipocytes were serum starved for 6 h and treated for 17 h with DMSO vehicle, PD98059 (PD, 50 μM), SB203580 (SB, 20 μM), LY294002 (LY, 50 μM), and rapamycin (Rap, 1 μM). 5 μg of total RNA was analyzed by Northern blot using Adhfe1, ATGL, and 36B4 probes. C: Validation of Adhfe1 downregulation through PI 3-kinase pathway. 3T3-L1 adipocytes were serum starved for 6 h and treated for 17 h with DMSO vehicle (DMSO) or 50 μM of LY294002 (LY). 5 μg of total RNA was analyzed by Northern blot using Adhfe1 probe. For A-C, the EtBr staining of rRNA is shown as a gel loading control. Northern blots are representative of n=2 for A and B, and the study in C was carried out in triplicate, as shown.
Expression of Adhfe1 Transcript in Wild Type and ob/ob Murine Tissues
To garner further information on the in vivo tissue-specific expression pattern of Adhfe1 we used Northern blot analysis on a wide panel of murine tissues including subcutaneous WAT. Figure 6A indicates that Adhfe1 transcript is highly restricted in expression in that it is only detected in adipose tissue, kidney, heart, and liver; four tissues commonly regarded as highly metabolically active. We also observe that the level of Adhfe1 transcript found in 3T3-L1 adipocytes is of a similar magnitude as that in subcutaneous WAT. However, Adhfe1 transcript is non-detectable in lung, brain, spleen, intestine, thymus, stomach, seminferous tubules, muscle and testis; the signal in the testes lane is a hybridization artifact. We also compared Adhfe1 transcript level in brown adipose tissue (BAT) and three distinct WAT depots, subcutaneous, epididymal and retroperitoneal, shown in Figure 6B and found that Adhfe1 transcript is highest in BAT, but is also readily detected in each of the three WAT depots. These data suggests, as did the in vitro adipogenesis data of Figure 3, that expression of Adhfe1 may be fundamental to the phenotype of both the white and brown adipocyte. In addition to expression of Adhfe1 under ad libitum conditions, above, we also assessed regulation of Adhfe1 transcript level in WAT and BAT of C57BL/6 mice in response to fasting and refeeding and failed to find regulation by this type of nutritional manipulation (data not shown). It has been described that many adipose-expressed genes show dysregulated expression in obesity, often with obese adipose tissue evidencing a downregulation of such genes [39, 64]. We used the ob/ob genetic model of murine obesity to determine if Adhfe1 transcript expression was dysregulated in obesity. Quantitative Northern blot assessment and the accompanying graphical representation of the Adhfe1 transcript level (Figure 7) reveals a statistically significant reduction of 40% and 30% in the level of Adhfe1 transcript in ob/ob adipose tissue and ob/ob kidney, respectively, but not in liver.
Figure 6. Adipose Tissue is a Primary Site of Adhfe1 Expression in vivo.
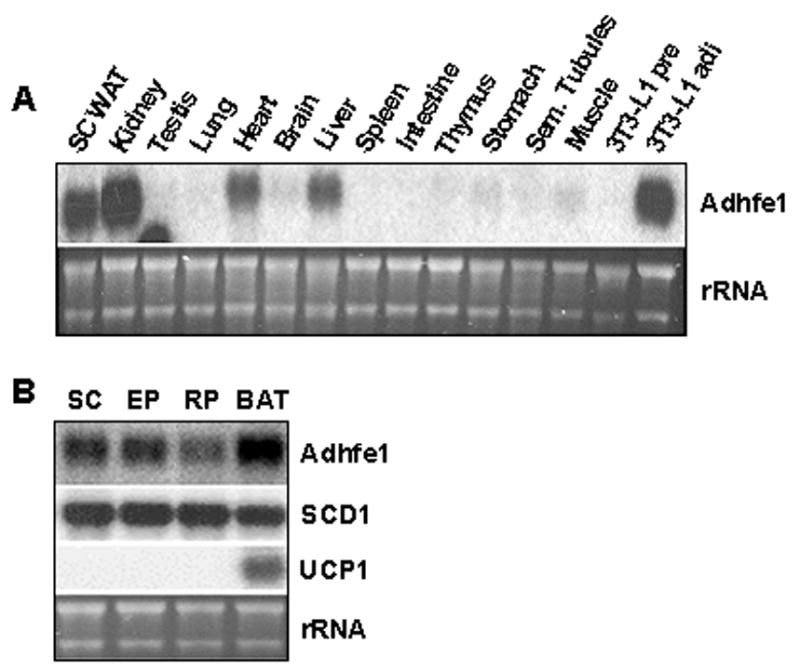
A: Adhfe1 transcript level in a panel of murine tissues. 5 μg of total RNA from indicated mouse tissues were analyzed by Northern blot using murine Adhfe1 cDNA probe. SC WAT, subcutaneous adipose tissue; and Sem. Tubules, seminiferous tubules. Note: the signal in the testis lane is a hybridization artifact. B: Expression of Adhfe1 in adipose tissue. Subcutaneous (SC), epididymal (EP), retroperitoneal (RP) white adipose tissues, and brown adipose tissue (BAT) RNA were isolated from 8 wk old wild type C57BL/6 mouse and subjected to Northern blot analysis using Adhfe1, SCD1, and UCP1 probes. For A and B, the EtBr staining of rRNA is shown as a gel loading control. Northern blots are representative of n=2.
Figure 7. Dysregulation of Adhfe1 Transcript Level in a Murine Obesity Model, ob/ob.
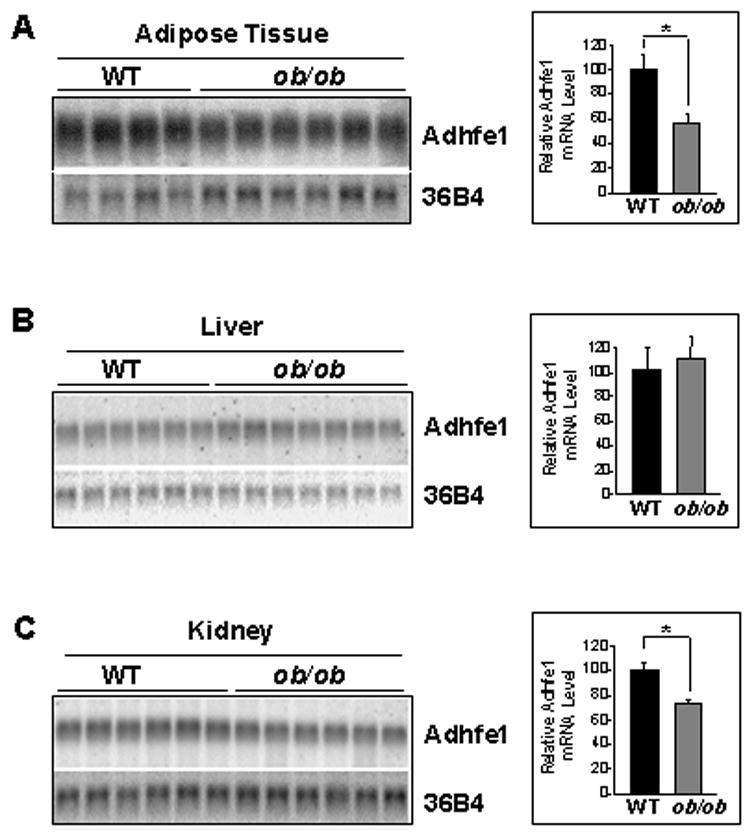
Subcutaneous adipose tissue (A), liver (B), and kidney (C) RNA were isolated from 8 wk old wild type C57BL/6 (WT) and ob/ob mice and subjected to Northern blot hybridization for Adhfe1 and 36B4 levels, quantitated by phosphorimager analysis, and Adhfe1 transcript level for each sample normalized against its 36B4 control. Data represent relative Adhfe1 level mean ± S.D. from multiple individual wild type mice (n=4 for adipose tissue, n=6 for liver and kidney) or multiple individual ob/ob mice (n=6 for adipose tissue and kidney, n=7 for liver) and were analyzed by single factor ANOVA (*, p<0.001).
DISCUSSION
Our studies herein clearly indicate that expression of Adhfe1 transcript is tightly linked to the phenotype of the mature adipocyte both in vivo and in vitro. Moreover, its expression is differentiation-dependent in white and brown adipogenesis, and it demonstrates highly enriched tissue expression in adipose tissue and other highly metabolically active tissues. Our observation of Adhfe1 transcript dysregulation in obese adipose tissue and obese kidney suggests that the putative metabolic pathways wherein Adhfe1 functions are among those that are altered in obesity. However, unlike the high percentage of adipose-enriched transcripts that are effectively downregulated upon TNFα exposure, the level of Adhfe1 transcript is non-responsive to this cytokine, at least in regard to the 48 h time frame we assessed. We present evidence, however, that the Adhfe1 transcript is not merely a constitutively expressed gene that is unaffected by intracellular signals, in that a highly effective downregulation of Adhfe1 transcript is noted within 17 h of treatment with the PI 3-kinase inhibitor LY294002. The PI 3-kinase pathway, via activation of the PDK1 kinase [68], is known to impact a range of intracellular responses to govern cell survival, cell proliferation, actin polymerization, and membrane ruffling, among others [49]. PI 3-kinase plays a key role in insulin signaling and is blunted in tissues of type 2 diabetics [28]. Among its actions are the regulation of glucose transporter function [26] and in mediating the transcriptional response to insulin [74]. Ample evidence exists confirming the function of one of the downstream effectors of PI 3-kinase, Akt/PKB [68], in the metabolic effects of insulin [76]. In the specific case of ethanol metabolism, studies in rat liver indicate that chronic ethanol intake impairs insulin signaling by disrupting Akt/PKB membrane association [20]. As such, it may be of interest that our studies demonstrate that PI 3-kinase signaling is key to maintaining basal Adhfe1 transcript level when assessed in 3T3-L1 adipocytes. However, our studies in 3T3-L1 adipocytes indicated that insulin was unable to modulate levels of Adhfe1 transcript; thus the effects we note for LY294002 are likely not related to insulin-initiated signals. In addition to PDK1 phosphorylation leading to activation of Akt/PKB, PDK1 has also been demonstrated to phosphorylate SGK, PKCζ, PKCδ, p21-activated kinase, p90 ribosomal S6 kinase and p70 S6 kinase [68]. While our observation that rapamycin treatment did not alter basal Adhfe1 transcript level indicates that p70 S6 kinase is not involved in maintenance of basal Adhfe1 transcript level, the exact signals in the extra- and intra-cellular environment that regulate Adhfe1 transcription in adipose tissues, heart, liver and kidney remain to be elucidated.
We have discovered the expression of the transcript for an atypical ADH in adipose tissue, however, the expression of the “classic” ADHs in adipose tissues have to date not been systematically addressed. Limited information exists regarding adipose tissue ADH activities; the literature is sporadic in nature and for the most reported more than a decade ago. A positive histochemical ADH reaction was observed in liver and BAT, but not in WAT, and likewise ADH activity was detected biochemically in BAT, but not WAT [37]. This led to the suggestion that an ethanol-metabolizing enzyme present in BAT may be related to the ethanol-induced increases in the oxidative capacity of BAT [24], or that BAT may metabolize ethanol for thermogenesis [37]. A retrospective study in humans observed that chronic alcohol intake might cause an emergence of brown fat within the WAT around the aorta and carotid arteries [25]. Thus while the interplay between the various classes of ADHs present in adipose tissue remains to be determined, it may be of interest to note here that among the various adipose depots we examined the highest level of Adhfe1 transcript is found in BAT, as such Adhfe1 might have a role in BAT energy metabolism.
Studies on the metabolic consequences of alcohol intake in humans have revealed that it can result in a substantial alteration of whole-body lipid and energy balance. The effects of alcohol on lipid metabolism are complex and depend on the amount consumed, pattern of drinking, genetic variations in ADH genes [21], and lifestyle factors [69]. In regard to the possible impact of the metabolic products of ethanol on adipocyte function, fatty acid ethyl esters can be found incorporated in the membrane preparations of isolated adipocytes [13] and as such may contribute to altered adipocyte metabolism and function. While not yet empirically addressed, a speculation is that such esters might possibly disrupt the function of the adipocyte lipid droplet, for example by altering accessibility to the lipolytic action of hormone sensitive lipase. Thus, overall, there is ample data that demonstrates the ability of alcohol and its metabolites to impact whole body energy metabolism and likewise adipose tissue function. The relationship between the expression of the atypical ADH Adhfe1 in adipocytes and adipocyte pathophysiology or alcohol metabolism is not currently known. Future work will be aimed at discovering the substrate specificity and metabolic functions of this unique adipocyte-enriched member of the ADH superfamily.
Acknowledgments
This work was supported by NIDDK/NIH grant 5R21DK064992 to C.M. Smas.
Abbreviations
- ADH
alcohol dehydrogenase
- MDR
medium-chain dehydrogenases/reductases
- SDR
short-chain dehydrogenases/reductases
- WAT
white adipose tissue
- MIX
methylisobutylxanthine
- PPAR
peroxisome proliferator-activated receptor
- C/EBP
CCAAT/enhancer-binding protein
- SCD1
stearoyl Co-A desaturase 1
- aFABP
adipocyte fatty acid binding protein
- UCP1
uncoupling protein 1
- ATGL
adipose triglyceride lipase
- BAT
brown adipose tissue
Footnotes
Publisher's Disclaimer: This is a PDF file of an unedited manuscript that has been accepted for publication. As a service to our customers we are providing this early version of the manuscript. The manuscript will undergo copyediting, typesetting, and review of the resulting proof before it is published in its final citable form. Please note that during the production process errors may be discovered which could affect the content, and all legal disclaimers that apply to the journal pertain.
References
- 1.Beutler B, Mahoney J, Le Trang N, Pekala P, Cerami A. J Exp Med. 1985;161:984–95. doi: 10.1084/jem.161.5.984. [DOI] [PMC free article] [PubMed] [Google Scholar]
- 2.Birkenmeier EH, Gwynn B, Howard S, Jerry J, Gordon JI, Landschulz WH, et al. Genes Dev. 1989;3:1146–56. doi: 10.1101/gad.3.8.1146. [DOI] [PubMed] [Google Scholar]
- 3.Boone C, Mourot J, Gregoire F, Remacle C. Reprod Nutr Dev. 2000;40:325–58. doi: 10.1051/rnd:2000103. [DOI] [PubMed] [Google Scholar]
- 4.Bradley RL, Cleveland KA, Cheatham B. Recent Prog Horm Res. 2001;56:329–58. doi: 10.1210/rp.56.1.329. [DOI] [PubMed] [Google Scholar]
- 5.Conway T, Sewell GW, Osman YA, Ingram LO. J Bacteriol. 1987;169:2591–7. doi: 10.1128/jb.169.6.2591-2597.1987. [DOI] [PMC free article] [PubMed] [Google Scholar]
- 6.Conway T, Ingram LO. J Bacteriol. 1989;171:3754–9. doi: 10.1128/jb.171.7.3754-3759.1989. [DOI] [PMC free article] [PubMed] [Google Scholar]
- 7.Coppack SW. Proc Nutr Soc. 2001;60:349–56. doi: 10.1079/pns2001110. [DOI] [PubMed] [Google Scholar]
- 8.Cornelius P, Enerback S, Bjursell G, Olivecrona T, Pekala PH. Biochem J. 1988;249:765–9. doi: 10.1042/bj2490765. [DOI] [PMC free article] [PubMed] [Google Scholar]
- 9.Danielsson O, Atrian S, Luque T, Hjelmqvist L, Gonzalez-Duarte R, Jornvall H. Proc Natl Acad Sci U S A. 1994;91:4980–4. doi: 10.1073/pnas.91.11.4980. [DOI] [PMC free article] [PubMed] [Google Scholar]
- 10.Darlington GJ, Ross SE, MacDougald OA. J Biol Chem. 1998;273:30057–60. doi: 10.1074/jbc.273.46.30057. [DOI] [PubMed] [Google Scholar]
- 11.de Vries GE, Arfman N, Terpstra P, Dijkhuizen L. J Bacteriol. 1992;174:5346–53. doi: 10.1128/jb.174.16.5346-5353.1992. [DOI] [PMC free article] [PubMed] [Google Scholar]
- 12.Deng Y, Wang Z, Gu S, Ji C, Ying K, Xie Y, et al. DNA Seq. 2002;13:301–6. doi: 10.1080/1042517021000011636. [DOI] [PubMed] [Google Scholar]
- 13.DePergola G, Kjellstrom C, Holm C, Conradi N, Pettersson P, Bjorntorp P. Alcohol Clin Exp Res. 1991;15:184–9. doi: 10.1111/j.1530-0277.1991.tb01853.x. [DOI] [PubMed] [Google Scholar]
- 14.Fasshauer M, Klein J, Neumann S, Eszlinger M, Paschke R. Biochem Biophys Res Commun. 2001;288:1027–31. doi: 10.1006/bbrc.2001.5874. [DOI] [PubMed] [Google Scholar]
- 15.Forman BM, Tontonoz P, Chen J, Brun RP, Spiegelman BM, Evans RM. Cell. 1995;83:803–12. doi: 10.1016/0092-8674(95)90193-0. [DOI] [PubMed] [Google Scholar]
- 16.Green H, Kehinde O. Cell. 1975;5:19–27. doi: 10.1016/0092-8674(75)90087-2. [DOI] [PubMed] [Google Scholar]
- 17.Gregoire FM, Smas CM, Sul HS. Physiol Rev. 1998;78:783–809. doi: 10.1152/physrev.1998.78.3.783. [DOI] [PubMed] [Google Scholar]
- 18.Gregoire FM. Exp Biol Med (Maywood) 2001;226:997–1002. doi: 10.1177/153537020122601106. [DOI] [PubMed] [Google Scholar]
- 19.Havel PJ. Curr Opin Lipidol. 2002;13:51–9. doi: 10.1097/00041433-200202000-00008. [DOI] [PubMed] [Google Scholar]
- 20.He L, Simmen FA, Mehendale HM, Ronis MJ, Badger TM. J Biol Chem. 2006;281:11126–34. doi: 10.1074/jbc.M510724200. [DOI] [PubMed] [Google Scholar]
- 21.Hines LM, Stampfer MJ, Ma J, Gaziano JM, Ridker PM, Hankinson SE, et al. N Engl J Med. 2001;344:549–55. doi: 10.1056/NEJM200102223440802. [DOI] [PubMed] [Google Scholar]
- 22.Hotamisligil GS. Int J Obes Relat Metab Disord. 2000;24(Suppl 4):S23–7. doi: 10.1038/sj.ijo.0801497. [DOI] [PubMed] [Google Scholar]
- 23.Hulo N, Bairoch A, Bulliard V, Cerutti L, De Castro E, Langendijk-Genevaux PS, et al. Nucleic Acids Res. 2006;34:D227–30. doi: 10.1093/nar/gkj063. [DOI] [PMC free article] [PubMed] [Google Scholar]
- 24.Huttunen P, Kortelainen ML. Pharmacol Biochem Behav. 1988;29:53–7. doi: 10.1016/0091-3057(88)90272-9. [DOI] [PubMed] [Google Scholar]
- 25.Huttunen P, Kortelainen ML. Eur J Appl Physiol Occup Physiol. 1990;60:418–24. doi: 10.1007/BF00705030. [DOI] [PubMed] [Google Scholar]
- 26.Ishiki M, Klip A. Endocrinology. 2005;146:5071–8. doi: 10.1210/en.2005-0850. [DOI] [PubMed] [Google Scholar]
- 27.Jain R, Police S, Phelps K, Pekala PH. Biochem J. 1999;338(Pt 3):737–43. [PMC free article] [PubMed] [Google Scholar]
- 28.Jiang G, Zhang BB. Front Biosci. 2002;7:d903–7. doi: 10.2741/A820. [DOI] [PubMed] [Google Scholar]
- 29.Jornvall H, Persson B, Jeffery J. Eur J Biochem. 1987;167:195–201. doi: 10.1111/j.1432-1033.1987.tb13323.x. [DOI] [PubMed] [Google Scholar]
- 30.Jornvall H, Danielsson O, Hjelmqvist L, Persson B, Shafqat J. Adv Exp Med Biol. 1995;372:281–94. doi: 10.1007/978-1-4615-1965-2_34. [DOI] [PubMed] [Google Scholar]
- 31.Jornvall H, Nordling E, Persson B. Chem Biol Interact. 2003;143–144:255–61. doi: 10.1016/s0009-2797(02)00242-9. [DOI] [PubMed] [Google Scholar]
- 32.Kessler D, Leibrecht I, Knappe J. FEBS Lett. 1991;281:59–63. doi: 10.1016/0014-5793(91)80358-a. [DOI] [PubMed] [Google Scholar]
- 33.Kim JY, Tillison K, Smas CM. Biochem Biophys Res Commun. 2005;326:36–44. doi: 10.1016/j.bbrc.2004.10.200. [DOI] [PubMed] [Google Scholar]
- 34.Kim JY, Tillison K, Lee JH, Rearick DA, Smas C. Am J Physiol Endocrinol Metab. 2006;16:16. doi: 10.1152/ajpendo.00317.2005. [DOI] [PubMed] [Google Scholar]
- 35.Kim S, Moustaid-Moussa N. J Nutr. 2000;130:3110S–3115S. doi: 10.1093/jn/130.12.3110S. [DOI] [PubMed] [Google Scholar]
- 36.Klein J, Fasshauer M, Klein HH, Benito M, Kahn CR. Bioessays. 2002;24:382–8. doi: 10.1002/bies.10058. [DOI] [PubMed] [Google Scholar]
- 37.Kortelainen ML, Huttunen P, Hirvonen J. Alcohol. 1991;8:151–4. doi: 10.1016/0741-8329(91)91324-u. [DOI] [PubMed] [Google Scholar]
- 38.Laborda J. Nucleic Acids Res. 1991;19:3998. doi: 10.1093/nar/19.14.3998. [DOI] [PMC free article] [PubMed] [Google Scholar]
- 39.Liang CP, Tall AR. J Biol Chem. 2001;276:49066–76. doi: 10.1074/jbc.M107250200. [DOI] [PubMed] [Google Scholar]
- 40.MacDougald OA, Mandrup S. Trends Endocrinol Metab. 2002;13:5–11. doi: 10.1016/s1043-2760(01)00517-3. [DOI] [PubMed] [Google Scholar]
- 41.Mueller E, Drori S, Aiyer A, Yie J, Sarraf P, Chen H, et al. J Biol Chem. 2002;277:41925–30. doi: 10.1074/jbc.M206950200. [DOI] [PubMed] [Google Scholar]
- 42.Mulder NJ, Apweiler R, Attwood TK, Bairoch A, Bateman A, Binns D, et al. Nucleic Acids Res. 2005;33:D201–5. doi: 10.1093/nar/gki106. [DOI] [PMC free article] [PubMed] [Google Scholar]
- 43.Nadler ST, Attie AD. J Nutr. 2001;131:2078–81. doi: 10.1093/jn/131.8.2078. [DOI] [PubMed] [Google Scholar]
- 44.Neale AD, Scopes RK, Kelly JM, Wettenhall RE. Eur J Biochem. 1986;154:119–24. doi: 10.1111/j.1432-1033.1986.tb09366.x. [DOI] [PubMed] [Google Scholar]
- 45.Nordling E, Jornvall H, Persson B. Eur J Biochem. 2002;269:4267–76. doi: 10.1046/j.1432-1033.2002.03114.x. [DOI] [PubMed] [Google Scholar]
- 46.Nordling E, Persson B, Jornvall H. Cell Mol Life Sci. 2002;59:1070–5. doi: 10.1007/s00018-002-8487-6. [DOI] [PMC free article] [PubMed] [Google Scholar]
- 47.Ntambi JM, Miyazaki M. Prog Lipid Res. 2004;43:91–104. doi: 10.1016/s0163-7827(03)00039-0. [DOI] [PubMed] [Google Scholar]
- 48.Oppermann U, Filling C, Hult M, Shafqat N, Wu X, Lindh M, et al. Chem Biol Interact. 2003;143–144:247–53. doi: 10.1016/s0009-2797(02)00164-3. [DOI] [PubMed] [Google Scholar]
- 49.Osaki M, Oshimura M, Ito H. Apoptosis. 2004;9:667–76. doi: 10.1023/B:APPT.0000045801.15585.dd. [DOI] [PubMed] [Google Scholar]
- 50.Petersen DJ, Welch RW, Walter KA, Mermelstein LD, Papoutsakis ET, Rudolph FB, et al. Ann N Y Acad Sci. 1991;646:94–8. doi: 10.1111/j.1749-6632.1991.tb18567.x. [DOI] [PubMed] [Google Scholar]
- 51.Price SR, Olivecrona T, Pekala PH. Arch Biochem Biophys. 1986;251:738–46. doi: 10.1016/0003-9861(86)90384-x. [DOI] [PubMed] [Google Scholar]
- 52.Qi C, Pekala PH. Proc Soc Exp Biol Med. 2000;223:128–35. doi: 10.1046/j.1525-1373.2000.22318.x. [DOI] [PubMed] [Google Scholar]
- 53.Rajala MW, Scherer PE. Endocrinology. 2003;144:3765–73. doi: 10.1210/en.2003-0580. [DOI] [PubMed] [Google Scholar]
- 54.Reid MF, Fewson CA. Crit Rev Microbiol. 1994;20:13–56. doi: 10.3109/10408419409113545. [DOI] [PubMed] [Google Scholar]
- 55.Rosen ED, Sarraf P, Troy AE, Bradwin G, Moore K, Milstone DS, et al. Mol Cell. 1999;4:611–7. doi: 10.1016/s1097-2765(00)80211-7. [DOI] [PubMed] [Google Scholar]
- 56.Rosen ED, Walkey CJ, Puigserver P, Spiegelman BM. Genes Dev. 2000;14:1293–307. [PubMed] [Google Scholar]
- 57.Rosen ED, Spiegelman BM. J Biol Chem. 2001;276:37731–4. doi: 10.1074/jbc.R100034200. [DOI] [PubMed] [Google Scholar]
- 58.Rosen ED, Hsu CH, Wang X, Sakai S, Freeman MW, Gonzalez FJ, et al. Genes Dev. 2002;16:22–6. doi: 10.1101/gad.948702. [DOI] [PMC free article] [PubMed] [Google Scholar]
- 59.Ross SE, Erickson RL, Gerin I, DeRose PM, Bajnok L, Longo KA, et al. Mol Cell Biol. 2002;22:5989–99. doi: 10.1128/MCB.22.16.5989-5999.2002. [DOI] [PMC free article] [PubMed] [Google Scholar]
- 60.Ruan H, Hacohen N, Golub TR, Van Parijs L, Lodish HF. Diabetes. 2002;51:1319–36. doi: 10.2337/diabetes.51.5.1319. [DOI] [PubMed] [Google Scholar]
- 61.Ruan H, Miles PD, Ladd CM, Ross K, Golub TR, Olefsky JM, et al. Diabetes. 2002;51:3176–88. doi: 10.2337/diabetes.51.11.3176. [DOI] [PubMed] [Google Scholar]
- 62.Ruan H, Lodish HF. Cytokine Growth Factor Rev. 2003;14:447–55. doi: 10.1016/s1359-6101(03)00052-2. [DOI] [PubMed] [Google Scholar]
- 63.Scopes RK. FEBS Lett. 1983;156:303–6. doi: 10.1016/0014-5793(83)80517-1. [DOI] [PubMed] [Google Scholar]
- 64.Soukas A, Cohen P, Socci ND, Friedman JM. Genes Dev. 2000;14:963–80. [PMC free article] [PubMed] [Google Scholar]
- 65.Soukas A, Socci ND, Saatkamp BD, Novelli S, Friedman JM. J Biol Chem. 2001;276:34167–74. doi: 10.1074/jbc.M104421200. [DOI] [PubMed] [Google Scholar]
- 66.Souza SC, Palmer HJ, Kang YH, Yamamoto MT, Muliro KV, Paulson KE, et al. J Cell Biochem. 2003;89:1077–86. doi: 10.1002/jcb.10565. [DOI] [PubMed] [Google Scholar]
- 67.Stephens JM, Pekala PH. J Biol Chem. 1992;267:13580–4. [PubMed] [Google Scholar]
- 68.Storz P, Toker A. Front Biosci. 2002;7:d886–902. doi: 10.2741/storz. [DOI] [PubMed] [Google Scholar]
- 69.Suter PM. Crit Rev Clin Lab Sci. 2005;42:197–227. doi: 10.1080/10408360590913542. [DOI] [PubMed] [Google Scholar]
- 70.Torti FM, Dieckmann B, Beutler B, Cerami A, Ringold GM. Science. 1985;229:867–9. doi: 10.1126/science.3839597. [DOI] [PubMed] [Google Scholar]
- 71.Torti FM, Torti SV, Larrick JW, Ringold GM. J Cell Biol. 1989;108:1105–13. doi: 10.1083/jcb.108.3.1105. [DOI] [PMC free article] [PubMed] [Google Scholar]
- 72.Umek RM, Friedman AD, McKnight SL. Science. 1991;251:288–92. doi: 10.1126/science.1987644. [DOI] [PubMed] [Google Scholar]
- 73.Walter KA, Bennett GN, Papoutsakis ET. J Bacteriol. 1992;174:7149–58. doi: 10.1128/jb.174.22.7149-7158.1992. [DOI] [PMC free article] [PubMed] [Google Scholar]
- 74.Wang D, Sul HS. J Biol Chem. 1998;273:25420–6. doi: 10.1074/jbc.273.39.25420. [DOI] [PubMed] [Google Scholar]
- 75.Weiner FR, Shah A, Smith PJ, Rubin CS, Zern MA. Biochemistry. 1989;28:4094–9. doi: 10.1021/bi00435a070. [DOI] [PubMed] [Google Scholar]
- 76.Whiteman EL, Cho H, Birnbaum MJ. Trends Endocrinol Metab. 2002;13:444–51. doi: 10.1016/s1043-2760(02)00662-8. [DOI] [PubMed] [Google Scholar]
- 77.Wierenga RK, De Maeyer MCH, Hol WGJ. Biochemistry. 1985;24:1346–1357. [Google Scholar]
- 78.Williamson VM, Paquin CE. Mol Gen Genet. 1987;209:374–81. doi: 10.1007/BF00329668. [DOI] [PubMed] [Google Scholar]
- 79.Wu Z, Xie Y, Bucher NL, Farmer SR. Genes Dev. 1995;9:2350–63. doi: 10.1101/gad.9.19.2350. [DOI] [PubMed] [Google Scholar]
- 80.Wu Z, Rosen ED, Brun R, Hauser S, Adelmant G, Troy AE, et al. Mol Cell. 1999;3:151–8. doi: 10.1016/s1097-2765(00)80306-8. [DOI] [PubMed] [Google Scholar]
- 81.Xing H, Northrop JP, Grove JR, Kilpatrick KE, Su JL, Ringold GM. Endocrinology. 1997;138:2776–83. doi: 10.1210/endo.138.7.5242. [DOI] [PubMed] [Google Scholar]
- 82.Yoshida A, Hsu LC, Yasunami M. Prog Nucleic Acid Res Mol Biol. 1991;40:255–87. doi: 10.1016/s0079-6603(08)60844-2. [DOI] [PubMed] [Google Scholar]
- 83.Youngleson JS, Lin FP, Reid SJ, Woods DR. FEMS Microbiol Lett. 1995;125:185–91. doi: 10.1111/j.1574-6968.1995.tb07356.x. [DOI] [PubMed] [Google Scholar]
- 84.Zhang B, Berger J, Hu E, Szalkowski D, White-Carrington S, Spiegelman BM, et al. Mol Endocrinol. 1996;10:1457–66. doi: 10.1210/mend.10.11.8923470. [DOI] [PubMed] [Google Scholar]