Abstract
Although many viruses have been crystallized and the protein capsid structures have been determined by X-ray crystallography, the nucleic acids often can not be resolved. This is especially true for RNA viruses. The lack of information about the conformation of DNA/RNA greatly hinders our understanding of the assembly mechanism of various viruses. Here we combine a coarse-grain model and a Monte Carlo method to simulate the distribution of viral RNA inside the capsid of Cowpea Chlorotic Mottle Virus (CCMV). Our results show that there is very strong interaction between the N-terminal residues of the capsid proteins, which are highly positive-charged, and the viral RNA. Without these residues, the binding energy disfavors the binding of RNA by the capsid. The RNA forms a shell close to the capsid with the highest densities associated with the capsid dimers. These high-density regions are connected to each other in the shape of a continuous net of triangles. The overall icosahedral shape of the net overlaps with the capsid subunit icosahedral organization. Medium density of RNA is found under the pentamers of the capsid. These findings are consistent with experimental observations.
Keywords: CCMV, RNA coarse-grain model, Monte Carlo, Poisson Boltzmann Equation, electrostatic potential, simulation
Introduction
Cowpea chlorotic mottle virus (CCMV) is a member of the Bromoviridae family and alphavirus-like superfamily of viruses. There are three members in the bromovirus group: CCMV, bromo mosaic virus, and broad bean mottle virus. The protein capsid of CCMV is about 28 nm in diameter size and icosahedral shaped. Each capsid is formed by 180 identical copies of protein subunits of 190 amino acids. The genome of CCMV exists in the form of four single-stranded, positive-sense RNA, but the four segments are encapsulated into three structurally similar particles. RNA 1 (3171 nucleotides in length) and RNA 2 (2774 nucleotides), which encode proteins involved for viral RNA replication, are separately packaged into different particles. RNA 3 (2173 nucleotides) and RNA 4 (824 nucleotides, a sub-genomic RNA encoding the coat protein) are packaged together into a third particle1. All three virions are required to establish infection of a plant cell.
CCMV is an ideal system for studying protein-protein and protein-RNA interactions that are important in the assembly, stability and disassembly of icosahedral viruses 2,3. It has been used as a model system for viral assembly ever since it was first demonstrated that purified RNA and coat protein can reassemble in vitro to produce infectious virions 4–8. The crystal structure of CCMV has been determined to 3.2 Å by x-ray crystallography 9. The CCMV capsid displays a T = 3, quasi-symmetry with 12 pentamers and 20 hexamers as capsomers. All CCMV coat protein subunits adopt the canonical β-barrel fold, with residues 27–49 and 179–190 extending from the barrel at the amino and carboxyl termini and playing major roles in the formation of particle quaternary structure. Residues 1–26 in CCMV are not visible in the electron density map. This region has 6 Arg and 3 Lys residues, and it has been shown that the capsid does not bind RNA without these residues 3. Mutagenesis studies on these basic residues have suggested that the binding of RNA is non-specific in bromoviruses, because any of these basic residues can be mutated without affecting the binding with RNA significantly 10,11. This implies that the protein-RNA interaction is dominated by electrostatic interactions. The conformations of the first 26 residues have been studied extensively by modeling and NMR 12–17. The conclusion is that there is an ensemble of conformations rapidly converting from α-helix to extended conformations.
The crystal structure of CCMV has provided the best structural information so far on RNA positioning within the capsid 18. A significant amount of density was observed under the quasi-three fold axes, which can be attributed to the N-terminal residues and some of the interacting RNA. Although most of the density cannot be resolved, Trp47 clearly stacks onto two consecutive RNA bases with a well-resolved protein-RNA boundary. In earlier studies, three short fragments of RNA (selection of base is arbitrary) have been modeled per asymmetric unit 9. The total length is 600 nucleotides, and corresponds to about 20% of the total viral RNA (vRNA) content in the capsid. This provides a good starting point for simulating the overall organization of the vRNA as well as the interaction between vRNA and the protein capsid. Later by comparing the density maps of the empty and vRNA-filled capsids using Cryo Electron Microscopy (Cryo-EM) and image reconstruction, it has been found that in CCMV, vRNA packs against the interior surface of the virion shell, with little or no density attributable to RNA found in the center of the virion 19. The vRNA appears to adopt an ordered conformation at each of the quasi-three fold axes, and weaker density exists at each of the five-fold axes. No sequence-specific interaction can be identified. This is true for all three types of virions assembled in vitro. Detailed modeling of the overall organization of the tertiary or secondary structure of the CCMV vRNA has not appeared in literature.
Similar features have been observed in other spherical viruses. For a review of RNA-protein interaction in spherical viruses, see reference 18. For satellite tobacco necrosis virus (STNV) 20 and satellite tobacco mosaic virus (STMV) 21, the vRNA is found to be in close association with the inner capsid surface. Up to 72% of vRNA can be accounted for in the case of STNV from a low resolution neutron diffraction study 20. Two motifs can be distinguished with RNA localized at the 2-fold axes. Instead of forming a homogeneous layer, the vRNA was found to take on the shape of a continuous network on the close inside of capsid. Bacteriophages have been subject to extensive crystallographic studies, and the crystal structure of bacteriophage MS2 capsid has been solved by X-ray diffraction 22. Initially no RNA was found in the crystal structure, but subsequently a hairpin operator was used in the crystallization process and was observed to form specific base-dependent RNA-protein interactions 23,24. Specific nucleotides in the hairpin loop and a bulged purine interact with the MS2 capsid at the quasi-two-fold axis, and this motif involved in RNA-binding is strongly conserved in all other crystallized RNA bacteriophages 25,26. A more recent cryo-EM study with MS2 revealed that more vRNA can bind to the coat protein dimer 27. Additional densities attributable to vRNA were also observed to form an icosahedral network around the 3-fold and 5-fold axes.
In this work, we combine a coarse-grain model of RNA and a Monte Carlo approach to simulate the distribution of vRNA under the electrostatic potential field of the protein capsid of CCMV. The electrostatic potential was solved using the APBS software package 28 on the Blue Horizon machine of the San Diego Supercomputer Center. Our results show that there is very strong interaction between the highly positive-charged N-terminal residues of the protein capsid and vRNA. Without these residues, the binding energy disfavors the binding of vRNA by the protein capsid. The vRNA forms a shell close to the inner side of the capsid with most of the density close to the capsid protein dimer interface. A continuous net of triangles was observed along the icosahedral surface close to the inner side of the capsid, in similar fashion to the recent cryo-EM result for bacteriophage MS2 27.
Models and Methods
The coordinates of the crystal structure of CCMV 9 were downloaded from the Protein Data Bank (pdb ID: 1CWP). The missing N-terminal residues were added using Sybyl (Tripos Inc., St. Louis, MO) according to conformations from previous theoretical and NMR studies of a peptide representing the N-terminal residues of CCMV coat protein 12–17. The N-terminal was acetylated according to literature 29,30. The structure was further optimized while fixing the residues in the crystal structure using NAMD 31. The three RNA fragments in the structure were also included and kept fixed. The CHARMM27 force field 32 was used in the optimization.
The complete CCMV capsid was generated using the transformation matrices provided in the 1CWP pdb entry. The charges and radii of atoms in the PQR file required by APBS 28 were taken from CHARMM27 force field. The electrostatic potential of the protein capsid was solved by APBS using 92 nodes (729 processors) in Blue Horizon in the San Diego Supercomputer Center. Each dimension was divided into 9 pieces, and the whole system was divided into 729 cubic regions. Each cube was then solved by a single processor adaptively in a 81 × 81 ×81 grid. Each processor required 300 MB memory, compared to 3 GB of memory for a sequential solver. The overlap factor was set at 0.1, and the fine grid size was 0.45 Å. The counterion concentration was set at 150 mM for both negative and positive charges. The dielectric constant was 2 for the solute, and 78.54 for the solvent.
There are several Lys/Arg residues in the N-terminal region that are close to each other. It is well known that the protonation state of charged residues can change depending on their local environment. In the free capsid without RNA it is certain that some of the Lys/Arg residues in the N-terminal have to be deprotonated in order for the capsid assembly to happen. However, in the complete virus the N-terminal residues are in close contact to the massively negatively-charged RNA. Presumably the negative charged RNA will stabilize the protonated state of the Lys/Arg residues. Because here we simulate the state that both the capsid and RNA are present, all the Lys/Arg residues in the N-terminal region were treated as positively charged when the electrostatic potential was solved.
In the coarse-grain RNA model in this study, each RNA nucleotide was treated as an isolated sphere. No connection was enforced between RNA spheres. This is necessary to speed up the convergence of the simulation. A diameter of 7.5 Å and a charge of −0.25e were assigned to each RNA sphere. The diameter of 7.5 Å is approximately the size of a sphere occupying the average molecular volume per nucleotide in tRNA and ribosome RNA. It also matches well with the average distance between contacting bases in the ribosome. The charge of −0.25e for nucleotides has been extensively used in nucleic acid simulations to mimic the effects of counterions and solvent. And a recent study on the electrostatic potential of a 70S ribosome showed that these parameters reproduced the potential very well compared with the full atom model using APBS33. The reduced charge may have a theoretical basis in the ion-condensation theory 34.
Monte Carlo (MC) simulation was adapted to find the distribution of vRNA with low energy. The 0.45 Å grid of the electrostatic potential field solved by APBS was down-sampled to a 2.5 Å grid for use in the simulation. A matching solvent-accessibility grid map was calculated from the coordinates of capsid, and used in the simulation to indicate the accessibility of each grid point Those nucleotides modeled in the crystal structure were kept as part of capsid in the MC simulation in order to preserve these positions, however, they were not included when only the capsid electrostatic potential surface property was evaluated. The number of RNA spheres was set at 2400 in the MC simulation. If the RNA in the crystal structure was considered (600), the total number was 3000, which matches the average length of RNA encapsulated by each CCMV viral particle.
The energy function used in the MC simulation was simply the electrostatic energy of all the RNA spheres:
| (1) |
where qi is the charge of RNA sphere i (−0.25e), φ is the electrostatic potential of the protein capsid plus the pre-existing nucleotides in the crystal structure at the grid position occupied by RNA sphere i. ε is the dielectric constant (a value of 4 is used), rij is the distance between sphere i and j, and c is a constant (332.056 if q is in electron units, r is in Å and E is in kcal/mol). The first term in the energy expression corresponds to the potential energy of all RNA spheres in the electrostatic potential of the capsid, and the second term is the repulsion energy between these RNA spheres. Note that no other apolar forces energy term is included, because electrostatic energy is expected to dominate in such highly charged molecules. The steric exclusion was enforced by a hard sphere model.
The initial positions of the RNA spheres were generated randomly inside the capsid in such a way that grid positions that do not overlap with pre-existing spheres can be occupied by a moving sphere. In one MC step, only the position of one of the RNA spheres is changed. Therefore, only the energy terms involving the moved sphere need to be calculated for the energy change. As a result the summation is not required for every step. Using the Metropolis sampling convention, a random number p1 (0≤p1≤1) is generated when a move is generated. Assuming the energy change associated with this move is ΔE, then the following probability is calculated:
| (2) |
where R is the universal gas constant, and T is the temperature (set at 300 K in this study). If p1 <= p2, the move is accepted; otherwise, the move is rejected. Note that the move is always accepted when ΔE ≤ 0 using this formulation.
The electrostatic potential surface was visualized using OpenDX software (formerly IBM Data Explorer, now open source at http://www.opendx.org). A chemistry module written by Gillilan and Wood 35 was used to show the molecule on top of the potential surface. The molecular rendering was prepared using VMD 1.8 36.
Results and Discussion
The CCMV capsid is assembled from 180 chemically identical coat proteins. Each asymmetric unit consists of three subunits, with each of them in a little different environment. Figure 1 shows the overall shape of the CCMV capsid centered on the pentamer (figure 1a) and hexamer (figure 1b). The color coding is in convention with reference 9, with blue, red and green representing subunit A, B and C, respectively. Five A subunits form a flat pentamer as shown in Figure 1a, while three B and three C subunits form a flat hexamer as shown in Figure 1b. The curvature of the icosahedral capsid appears in the interfaces of these pentamers and hexamers, where the interaction of dimers occurs. Inter-penetrating interactions between subunits are visible from these figures, as the carboxyl terminus of each subunit invades neighboring subunits. For more description on the subunit interaction in CCMV capsid, see reference 9.
Figure 1.
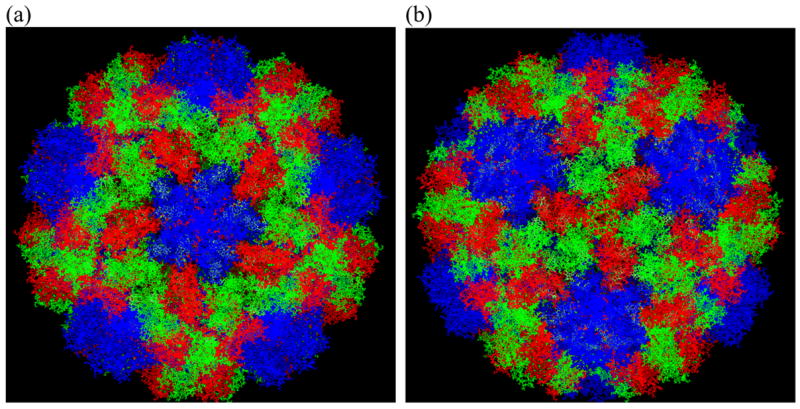
The overall shape of the CCMV capsid viewed from outside. Subunits A, B and C are colored in blue, red and green, respectively according to convention 9. Pentamers (a) and hexamers (b) can be seen at the center of the images. Images were prepared using VMD 36.
The electrostatic potential of the CCMV capsid was solved adaptively in parallel using 729 processors in Blue Horizon in the San Diego Supercomputer Center. Figure 2 shows the +1 kT/e and −1 kT/e iso-surfaces of the electrostatic potential viewed from outside (figure 2a) and inside (figure 2b). The missing N-terminal residues and the modeled nucleotides were not included here. The hexamers and pentamers are easy to identify from the outside view. The potential of the capsid is mainly negative outside and positive inside, however, positive potential can be found outside and negative potential inside.
Figure 2.
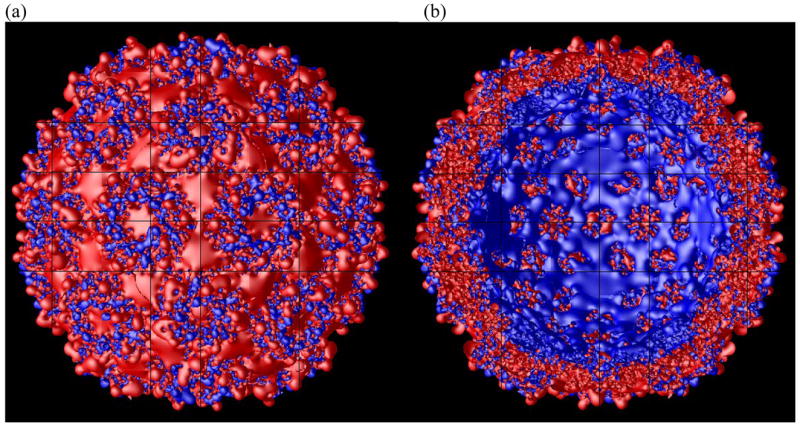
The +1 kT/e (blue) and −1 kT/e (red) iso-surface of the CCMV capsid viewed from outside (a) and inside (b).
Figure 3 shows the potential surface mapped on the solvent-accessible surface of the capsid. The N-terminal residues were included, but the nucleotides were not.
Figure 3.
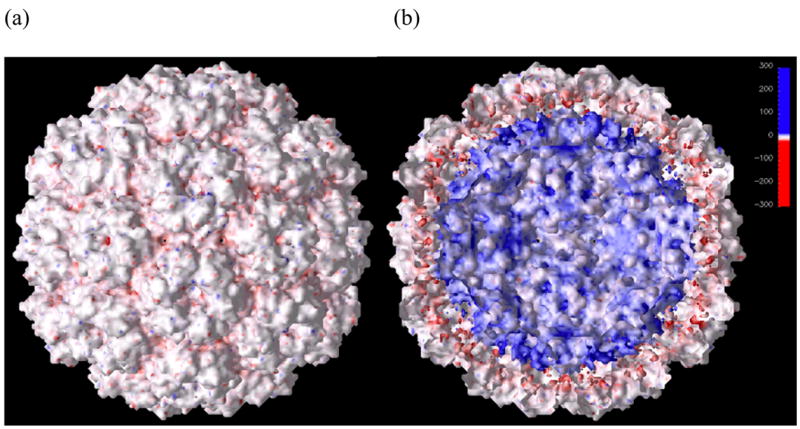
The electrostatic potential mapped on the solvent-accessible molecular surface of the capsid viewed from outside (a) and inside (b). The color bar is the same for both images.
Monte Carlo simulation was run using a coarse-grain RNA model, in which each nucleotide was treated as a sphere with a −0.25e charge and 7.5 Å radius. The electrostatic potential was down-sampled to a 120 × 120 × 120 grid (2.5 Å). The overall size of the grid used in the simulation was barely more than the dimension of the capsid itself. Because the RNA spheres were confined inside of the capsid, this has no effect on where the spheres could go. The modeled nucleotides in the crystal structure were treated as part of the capsid. Both the cases with and without the missing N-terminal residues were considered in order to evaluate the role of these highly positively charged residues.
We started with the case without the missing N-terminal residues. Figure 4 shows the energy of the system during a 10,000,000 step MC run. It is clear that the system reached equilibrium in about 3 million steps. The initial conformation of the RNA spheres in Figure 4 was generated by randomly placing spheres close to the capsid. We also tried to place the spheres close to the center of the capsid in the initial conformation, and all the spheres moved close to the capsid quickly in the simulation (data not shown). To determine the driving force for the energy change, we turned off the electrostatic potential field of the capsid in the simulation. Without the electrostatic potential field, there was little change in energy in the MC simulation while starting from the same initial conformation for the RNA spheres (Figure 5). Hence, the initial energy decrease seen in Figure 4 is the result of RNA spheres moving to optimal positions with favorable electrostatic energy in the potential field of the capsid. On the other hand, the RNA spheres try to avoid each other to minimize the repulsion between the like charges. However, the repulsion energy in the initial conformation was very close to the optimal value in Figure 5.
Figure 4.
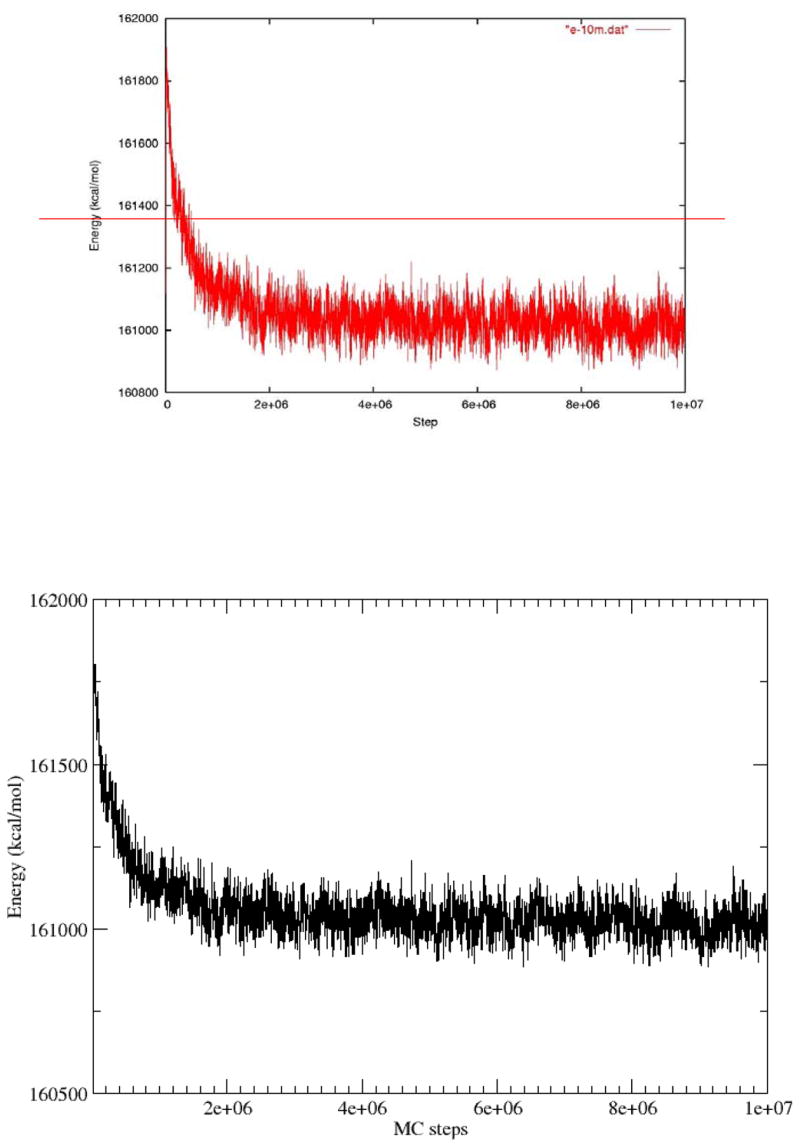
The energy plot versus simulation steps in a 10 million step MC run.
Figure 5.
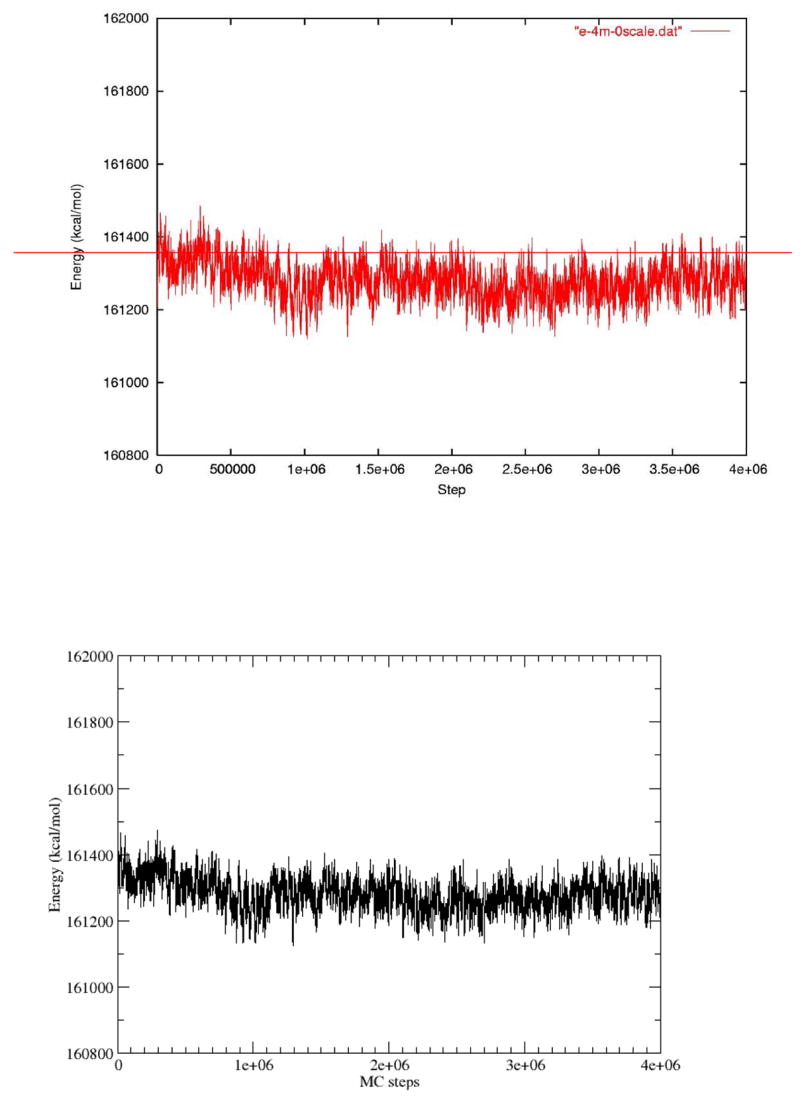
The energy plot versus steps in the simulation with the electrostatic field of the capsid turned off.
Figure 6 shows the stereo-view of the distribution of RNA spheres with optimal energy from 10 million steps of MC run viewed from inside (a) and outside (b) of the capsid. The RNA spheres from the simulation are shown in red, and the pre-existing RNA nucleotides are shown in orange with each sphere representing the phosphorus atom in the nucleotide. The capsid is also shown in a line model. When viewed from outside, part of the capsid was stripped to make the RNA spheres clearer.
Figure 6.
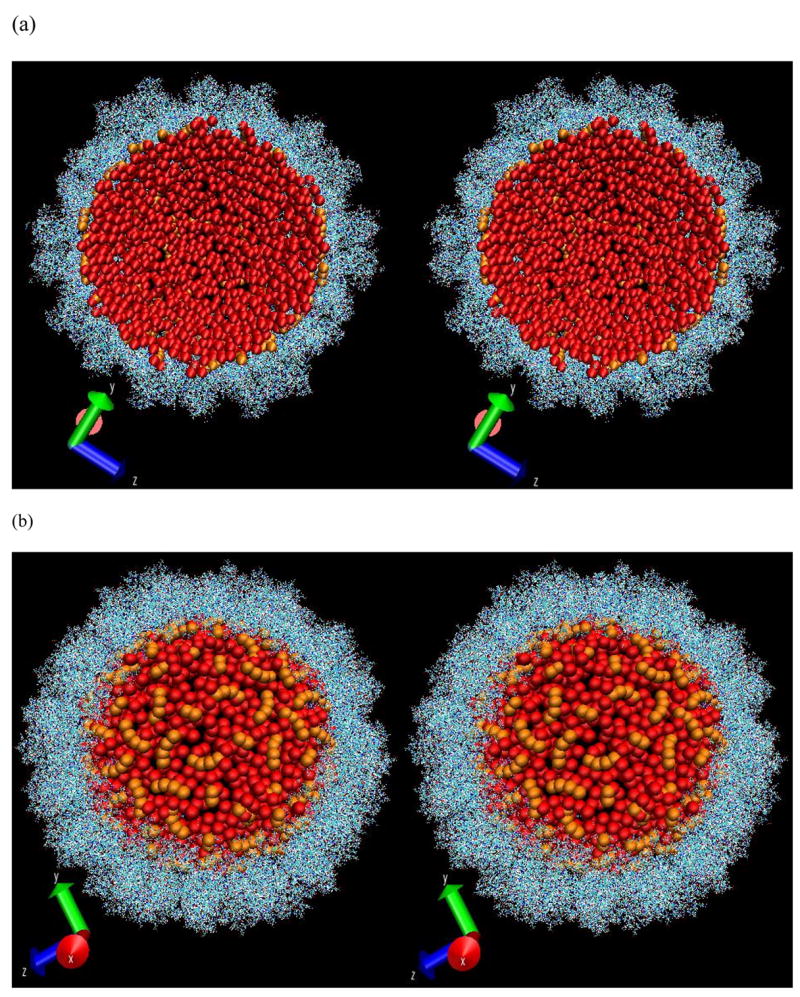
The stereo-view of the distribution of RNA spheres (in red) from the final conformation with optimal energy as viewed from inside (a) and outside (b). The pre-existing RNA nucleotides are shown in orange. The capsid is shown in a line model. Part of the capsid in (b) was stripped to show the RNA more clearly.
The most significant feature of the distribution of RNA spheres from this simulation was that the RNA forms a shell under the capsid, consistent with X-ray and cryo-EM studies 9,19. Although the repulsion energy between the RNA spheres due to their like charges dominated the total energy as evidenced by Figure 4 and 5, it is clear that the RNA spheres do adjust their positions in the electrostatic potential field of the capsid. No special pattern was observed in this case, presumably due to the lack of the N-terminal residues in the simulation. These residues are expected to interact strongly with the viral RNA.
To evaluate the impact of the missing N-terminal residues, these residues were built into the capsid asymmetric unit using Sybyl (Tripos Inc., St. Louis, MO). NMR studies on a synthetic pentacosapeptide containing the first 25 residues of CCMV capsid has shown that there is a conformation ensemble consisting of helical structures rapidly converting to more extended states 15. At 10°C, a significant population in the conformation ensemble had helical conformation between residues 9 and 17. Secondary structure prediction had a similar conclusion 14. Therefore, in choosing the conformations, a random conformation was chosen for each residue except residues 9 to 17, which were built as an alpha-helix. For subunit A, residues 26–41 were also missing in the crystal structure, and they were built using conformations from subunit B and C. Up to 20 rounds of different conformations were built and further optimization was conducted on each conformation.
Each set of conformations was first energy-minimized using the CHARMM27 force field 32 in NAMD 31. During the minimization, only the newly-built residues were allowed to move. The modeled nucleotides were also present and fixed in the optimization. The set with the lowest energy was then chosen to run 100 ps constant temperature molecular dynamics. Only newly built residues were allowed to move, as in the case of minimization. The final conformation was energy minimized and used to construct the complete capsid. Figure 7a shows the final conformation after these optimization steps. Part of the helix initially built for residues 7–17 was lost during the optimizations. In the final conformation, residues 1–6 are mostly buried, consistent with experimental results that the protein-RNA interface is located in the region 8–25 37,38. In figure 7b the three subunits were superimposed to show the difference of the conformation of the newly built residues. The conformation of subunit A is significantly different from subunits B and C, while the later two are very similar. Presumably it is because the local environment is more different for subunit A compared with subunits B and C (subunit A forms pentamers, while subunits B and C together form hexamers). The other reason might be that subunit A has more flexible residues than the other two subunits during optimization steps.
Figure 7.
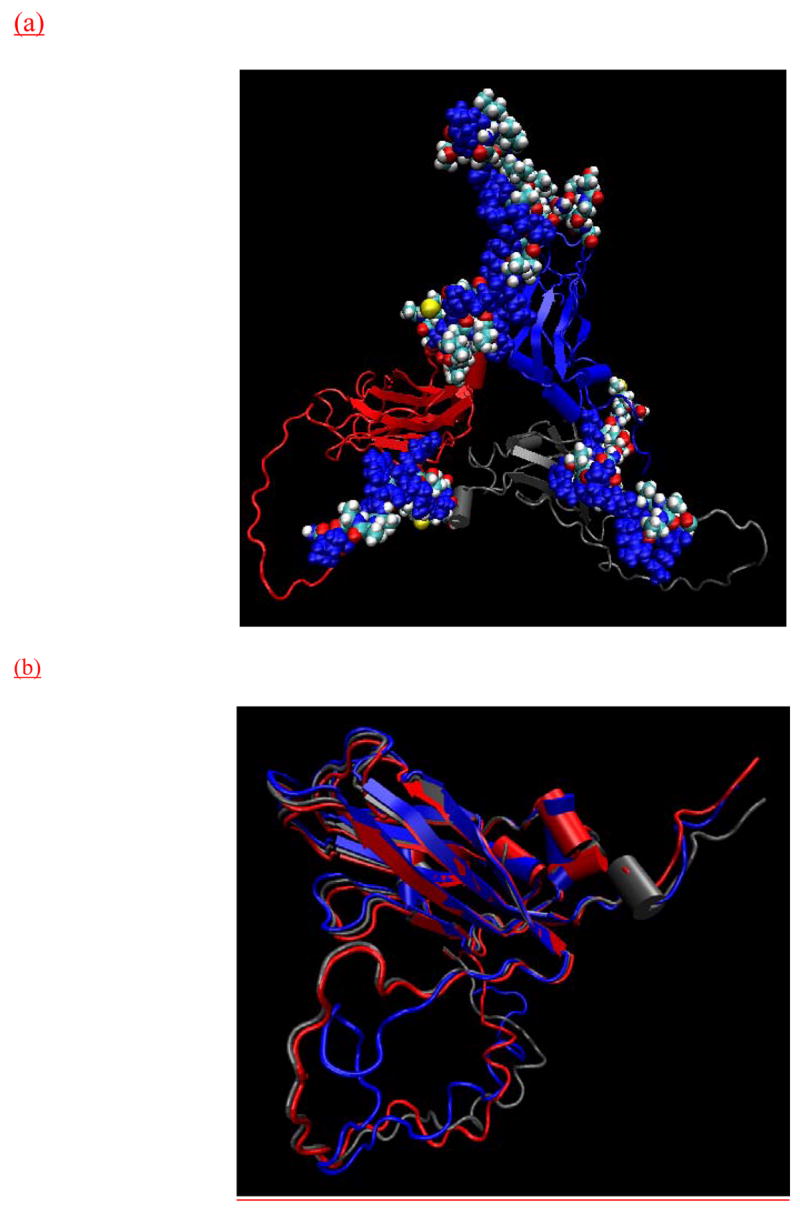
The missing N-terminal residues that were built in the current study. (a) The vdW representation of newly built residues. The basic residues (Lys and Arg) were colored in blue. The pre-existing residues in the crystal structure were also shown in cartoon with subunit A in blue, subunit B in red, and subunit C in gray. (b) The three subunits were superimposed to show the difference on the conformation of the newly built residues. The color of the subunits are the same as in (a).
The iso-potential surface of the complete CCMV capsid is significantly different from the one without the highly positively charged N-terminal residues. As seen in inside view in Figure 8(b), the +5 kT/e iso-surface consists of a series of connected bumps. This is evident on the edge. The interface between the bumps has the shape of hexagons and pentagons, obviously reflecting the capsomers’ composition. Because of the heavy positive charges on those N-terminal residues, the electrostatic potential inside the capsid becomes much stronger.
Figure 8.
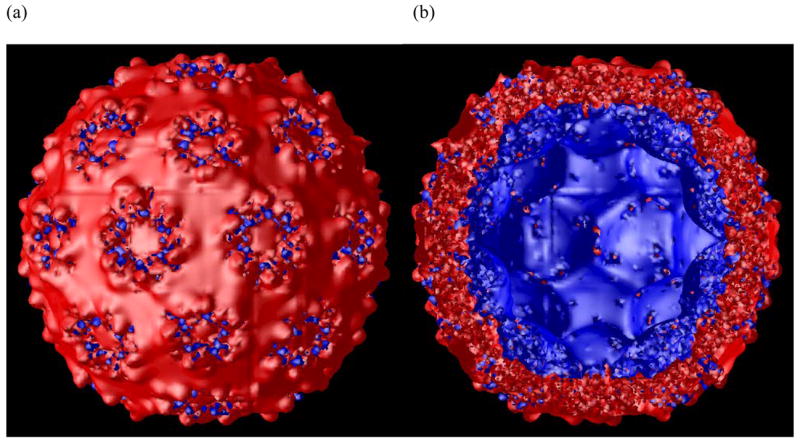
The −1 kT/e (red) and +5 kT/e (blue) iso-potential surface of the complete CCMV capsid with missing N-terminal residues built on, as viewed from outside (a) and inside (b) of the capsid.
When using the complete capsid in the MC simulation, it took a much longer time to converge because of too many rejected tries. The equilibration needed 7 million steps (data not sown). Figure 9 shows the radial distribution of the spheres from 5 million steps of MC simulation after the system reached equilibration. As a comparison, the radial distribution of the capsid including the added N-terminal residue atoms are also shown in figure 9. Figure 10 shows the distribution of the RNA spheres with the best energy from the MC simulation using the complete CCMV capsid.
Figure 9.
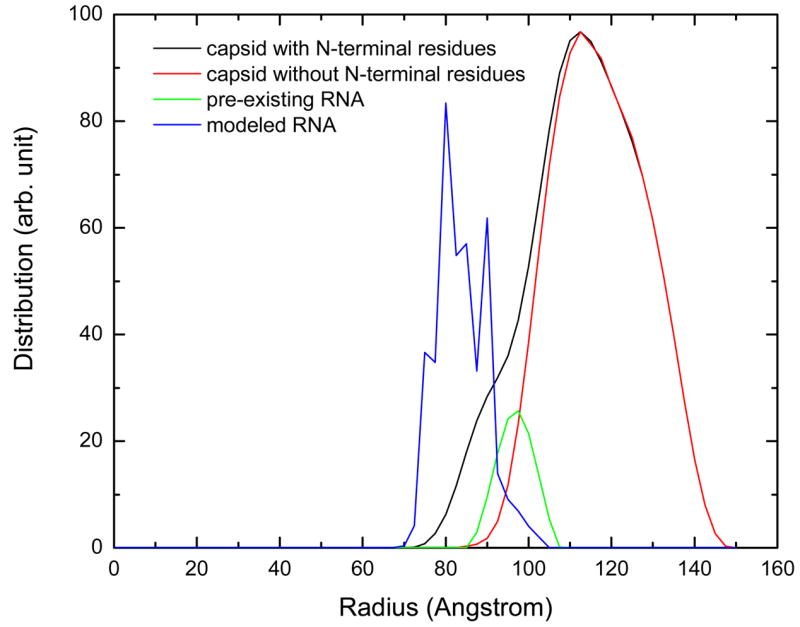
The radial distribution of the RNA spheres during the 5 million steps of MC simulation after equilibration. The radial distributions of pre-existing RNA and the capsid with and without the added N-terminal residue atoms were also shown.
Figure 10.
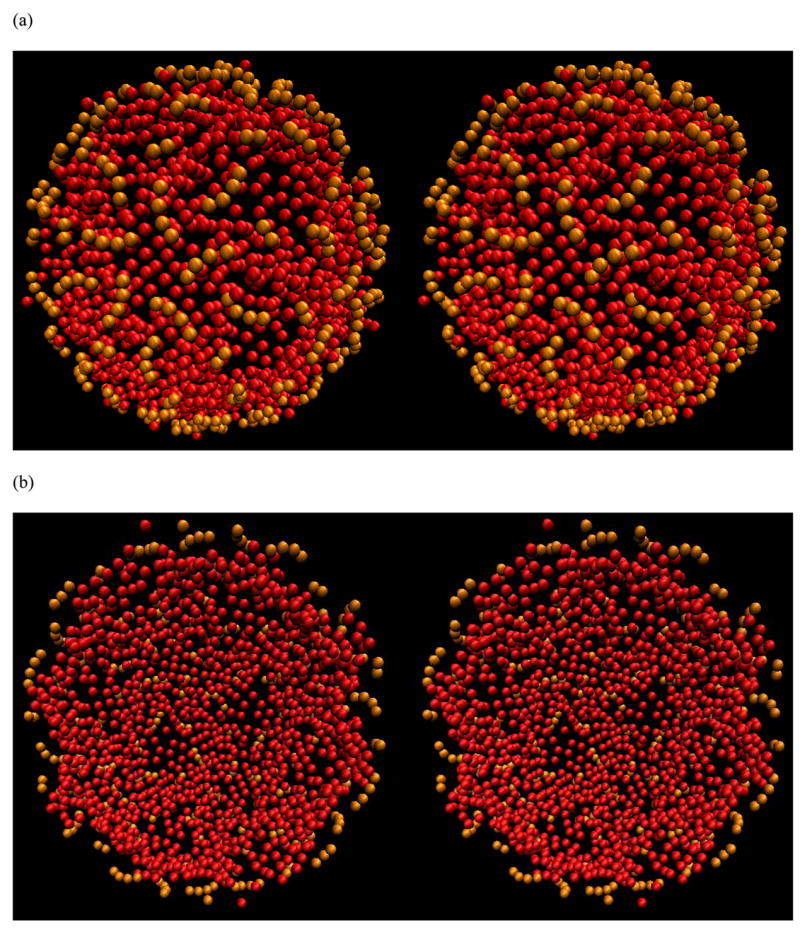
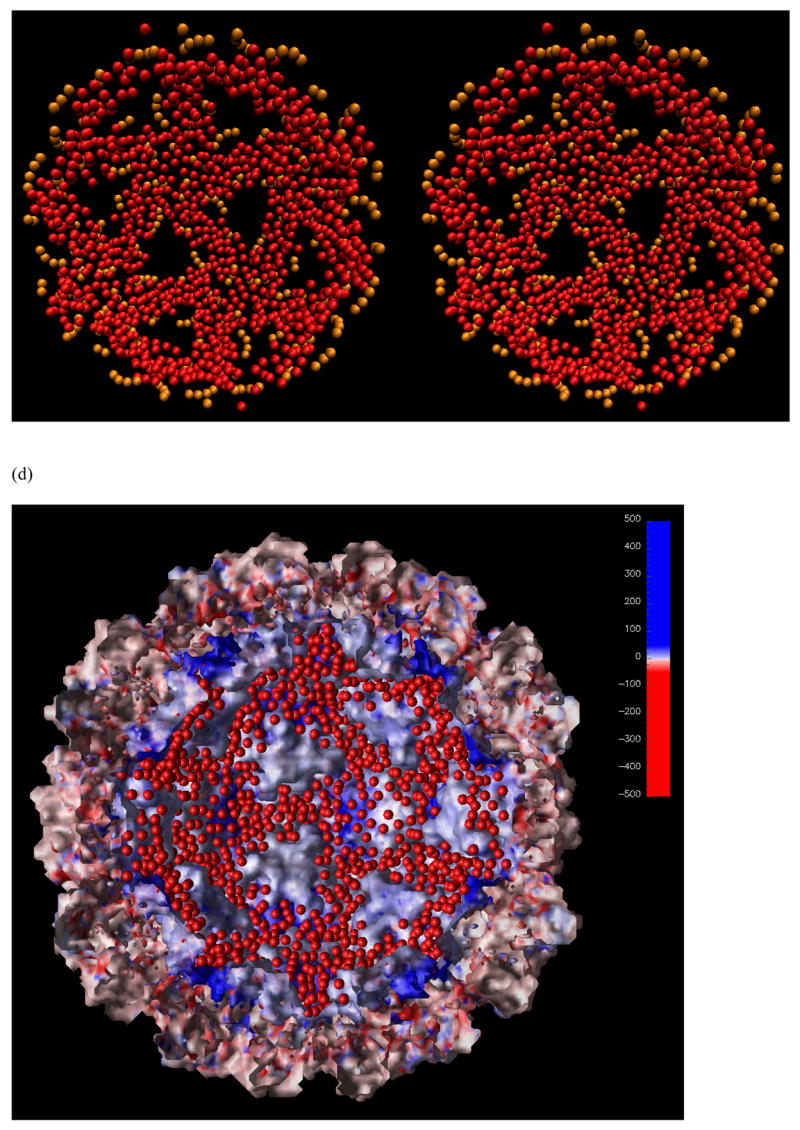
The stereo-view of the distribution of RNA spheres (in red) from a MC simulation using the complete CCMV capsid with all missing N-terminal residues included. For clarity, only half of the shell is shown. (a) Viewed from outside. The pre-existing RNA in the crystal structure is shown in orange color. (b) Same as in (a) except viewed from inside. (c) Viewed from inside with spheres closer than 80 Å to the center of the capsid removed for clarity. Five triangles are connected together to form a pentagon or star shape at the center. The density of spheres is lower in the pentagon region. (d) The RNA spheres showed in (c) along with the solvent-accessible surface electrostatic potential map. The image was generated using OpenDX with the Chemistry module developed by Gillilan and Wood 35.
It still holds true that the RNA spheres form a shell close to the inner side of the capsid as in the case of the capsid without the highly positively charged N-terminal residues. However, the spheres now show a more structured distribution. Not a single sphere was found in the center of the capsid, clearly due to the strong interaction between the RNA spheres and the electrostatic potential of the capsid. Only a single layer of spheres was found in some places (Figure 10a and b). This became clearer when this single layer of spheres (closer than 80 Å to the center of the capsid) was removed in Figure 10c. The heavily populated regions form the shape of many triangles, in agreement with the observation by cryo-EM on bacteriophage MS2 27. In addition, five of these triangles encircle a pentagon or star shape. Medium density of spheres was found under the pentagon.
The overall triangle distribution of the RNA spheres formed an icosahedral shape that overlaps with the capsid subunit organization as shown in Figure 10d. It was evident that the distribution of the RNA spheres complemented the ditches on the inside face of the capsid. The reason may be two fold: First, opposite charges on the inside face of the capsid (mainly formed by the highly positively charged N-terminal residues) and the RNA spheres tend to attract each other; On the other hand, the repulsion by like charges on the RNA spheres also force a shell distribution, even with the electrostatic field turned off, as demonstrated in Figure 5. The density of RNA spheres under the pentamers was due to the fact that the N-terminal residues were clustered lower in elevation (closer to the capsid surface) than the hexamers. In our current model, no linear connection was enforced on the RNA spheres. It was not clear whether a better model would change the distribution or not, especially the uniform layer of the RNA spheres that were closer than 80 Å to the center of the capsid and were removed in Figure 10c. These RNA spheres are probably more likely move to the edges of the triangles.
The N-ternimal residues were missing in the crystal structure, indicating they are flexible in nature. In our modeling of the CCMV capsid, the conformations of the added N-terminal residues were fixed during the MC simulation. Therefore, the local conformation might be dependent on the choice of our conformation of the added residues. However, since electrostatic interaction is long-range, different conformation will not change the distribution of viral RNA by much. Furthermore, the conformations of these N-ternimal residues are largely restricted by the position of the RNA fragments present in the crystal structure during the optimization.
Using the conformations of RNA spheres obtained in the MC simulation, the binding energies of the viral RNA to the capsid were calculated using APBS 28 for both the incomplete and complete capsid. The RNA spheres and the pre-existing RNA nucleotides were merged together to form the complete RNA. This gave an unfavorable 9800 kcal/mol for the capsid without the N-terminal residues, or 54.5 kcal/mol for binding to each capsid protein subunit. For the complete capsid with N-terminal residues, the binding energy is a favorable −482000 kcal/mol, or −268 kcal/mol for each subunit. Only electrostatic energy was considered here. This result can be explained by the total charges of the capsid. The missing N-terminal residues carry a total charge of +1620e. The net charge of the complete capsid is only +720e, and it becomes −900e without these N-terminal residues. Considering that the RNA is heavily negatively charged, it is reasonable that the binding energy does not favor the binding of RNA by the capsid missing the N-terminal residues, as they are both negatively charged overall. In vitro biochemical experiments are consistent with these results 3.
There are some important implications from this work. First, in our current coarse-grain model the RNA spheres are not connected, however, they are found to cluster on the edges of many triangles despite their like charges. This indicates strong interaction between RNA and the capsid, especially those N-terminal residues that were not resolved in the crystal structure. Another implication is that the local interaction between the RNA and the capsid protein might be sequence non-specific, because no distinction is made between different bases. Although the RNA has a shell distribution and forms triangles on the icosahedral surface, this does not indicate that the RNA has any such tertiary structure alone. As our simulation result suggests, there is very strong interaction between the RNA and the capsid. Upon binding to the capsid, it is possible that the RNA first undergoes “unfolding” to assume the shape, in which the electrostatic interaction between the RNA and the capsid is optimal. The majority of plant and animal viruses have basic N-terminal residues in their capsids, and it is very likely that the viral RNA would have similar distribution inside the capsid according to our model. However, such distribution does not require strictly that the capsid has heavily postive-charged residues, as evidenced in the case of bateriophage MS2 27. Finally, the current model cannot identify any non-electrostatic local interaction, such as base-stacking, between the RNA and the capsid. This will require a more detailed RNA model than the one we are using currently.
Another fact we need to consider is, the Poisson-Boltzmann mean-field theory is not accurate for highly charged systems, such as the one we are considering. However, there is no experimental evidence for specific roles of the counterions in the capsid-RNA interface. As an approximation to the charge condensation theory 34, we used reduced charge for the RNA spheres in our simulation.
Acknowledgments
This work was supported in part by NIH, NSF, the NSF Center for Theoretical Biological Physics, NBCR, the W.M. Keck Foundation, and Accelrys Inc.
References
- 1.Loeschfries LS, Hall TC. J Gen Virol. 1980;47:323–332. [Google Scholar]
- 2.Fox JM, Johnson JE, Young MJ. Seminars in Virology. 1994;5:51–60. [Google Scholar]
- 3.Zhao XX, Fox JM, Olson NH, Baker TS, Young MJ. Virology. 1995;207:486–494. doi: 10.1006/viro.1995.1108. [DOI] [PubMed] [Google Scholar]
- 4.Bancroft JB, Hiebert E. Virology. 1967;32:354–356. doi: 10.1016/0042-6822(67)90284-x. [DOI] [PubMed] [Google Scholar]
- 5.Bancroft JB, Wagner GW, Bracker CE. Virology. 1968;33:146–149. doi: 10.1016/0042-6822(68)90126-8. [DOI] [PubMed] [Google Scholar]
- 6.Bancroft JB, Bracker CE, Wagner GW. Virology. 1969;38:324–335. doi: 10.1016/0042-6822(69)90374-2. [DOI] [PubMed] [Google Scholar]
- 7.Hiebert E, Bancroft JB, Bracker CE. Virology. 1968;34:492–508. doi: 10.1016/0042-6822(68)90069-x. [DOI] [PubMed] [Google Scholar]
- 8.Hiebert E, Bancroft JB. Virology. 1969;39:296–311. doi: 10.1016/0042-6822(69)90050-6. [DOI] [PubMed] [Google Scholar]
- 9.Speir JA, Munshi S, Wang GJ, Baker TS, Johnson JE. Structure. 1995;3:63–78. doi: 10.1016/s0969-2126(01)00135-6. [DOI] [PMC free article] [PubMed] [Google Scholar]
- 10.Choi YG, Rao AL. Virology. 2000;275:207–217. doi: 10.1006/viro.2000.0513. [DOI] [PubMed] [Google Scholar]
- 11.Lee SK, Hacker DL. Virology. 2001;286:317–327. doi: 10.1006/viro.2001.0979. [DOI] [PubMed] [Google Scholar]
- 12.Vriend G, Hemminga MA, Verduin BJM, de Wit JL, Schaafsma TJ. FEBS Lett. 1981;134:167–171. [Google Scholar]
- 13.Vriend G, Verduin BJM, Hemminga MA, Schaafsma TJ. FEBS Lett. 1982;145:49–52. [Google Scholar]
- 14.Vriend G, Verduin BJM, Hemminga MA. J Mol Biol. 1986;191:453–460. doi: 10.1016/0022-2836(86)90140-3. [DOI] [PubMed] [Google Scholar]
- 15.van der Graaf M, Vanmierlo CPM, Hemminga MA. Biochemistry. 1991;30:5722–5727. doi: 10.1021/bi00237a013. [DOI] [PubMed] [Google Scholar]
- 16.van der Graaf M, Scheek RM, van der Linden CC, Hemminga MA. Biochemistry. 1992;31:9177–9182. doi: 10.1021/bi00153a009. [DOI] [PubMed] [Google Scholar]
- 17.van der Spoel D, Feenstra KA, Hemminga MA, Berendsen HJC. Biophys J. 1996;71:2920–2932. doi: 10.1016/S0006-3495(96)79493-6. [DOI] [PMC free article] [PubMed] [Google Scholar]
- 18.Bink HHJ, Pleij CWA. Archiv Virol. 2002;147:2261–2279. doi: 10.1007/s00705-002-0891-6. [DOI] [PubMed] [Google Scholar]
- 19.Fox JM, Wang GJ, Speir JA, Olson NH, Johnson JE, Baker TS, Young MJ. Virology. 1998;244:212–218. doi: 10.1006/viro.1998.9107. [DOI] [PubMed] [Google Scholar]
- 20.Bentley GA, Lewit-Bentley A, Liljas L, Skoglund U, Roth M, Unge T. J Mol Biol. 1987;194:129–141. doi: 10.1016/0022-2836(87)90722-4. [DOI] [PubMed] [Google Scholar]
- 21.Larson SB, Koszelak S, Day J, Greenwood A, Dodds JA, McPherson A. Nature. 1993;361:179–182. doi: 10.1038/361179a0. [DOI] [PubMed] [Google Scholar]
- 22.Valegard K, Liljas L, Fridborg K, Unge T. Nature. 1990;345:36–41. doi: 10.1038/345036a0. [DOI] [PubMed] [Google Scholar]
- 23.Valegard K, Murray JB, Stockley PG, Stonehouse NJ, Liljas L. Nature. 1994;371:623–626. doi: 10.1038/371623a0. [DOI] [PubMed] [Google Scholar]
- 24.Valegard K, Murray JB, Stonehouse NJ, vandenWorm S, Stockley PG, Liljas L. J Mol Biol. 1997;270:724–738. doi: 10.1006/jmbi.1997.1144. [DOI] [PubMed] [Google Scholar]
- 25.Golmohammadi R, Fridborg K, Bundule M, Valegard K, Liljas L. Structure. 1996;4:543–554. doi: 10.1016/s0969-2126(96)00060-3. [DOI] [PubMed] [Google Scholar]
- 26.Liljas L, Fridborg K, Valegard K, Bundule M, Pumpens P. J Mol Biol. 1994;244:279–290. doi: 10.1006/jmbi.1994.1729. [DOI] [PubMed] [Google Scholar]
- 27.Koning R, van den Worm S, Plaisier JR, van Duin J, Pieter Abrahams J, Koerten H. J Mol Biol. 2003;332:415–422. doi: 10.1016/s0022-2836(03)00846-5. [DOI] [PubMed] [Google Scholar]
- 28.Baker NA, Sept D, Joseph S, Holst MJ, McCammon JA. Proc Natl Acad Sci USA. 2001;98:10037–10041. doi: 10.1073/pnas.181342398. [DOI] [PMC free article] [PubMed] [Google Scholar]
- 29.Allison RF, Janda M, Ahlquist P. Virology. 1989;172:321–330. doi: 10.1016/0042-6822(89)90134-7. [DOI] [PubMed] [Google Scholar]
- 30.Allison RF, Janda M, Ahlquist P. J Virol. 1988;62:3581–3588. doi: 10.1128/jvi.62.10.3581-3588.1988. [DOI] [PMC free article] [PubMed] [Google Scholar]
- 31.Kale L, Skeel R, Bhandarkar M, Brunner R, Gursoy A, Krawetz N, Phillips J, Shinozaki A, Varadarajan K, Schulten K. J Comput Phys. 1999;151:283–312. [Google Scholar]
- 32.MacKerell AD, Bashford D, Bellott M, Dunbrack RL, Evanseck JD, Field MJ, Fischer S, Gao J, Guo H, Ha S, Joseph-McCarthy D, Kuchnir L, Kuczera K, Lau FTK, Mattos C, Michnick S, Ngo T, Nguyen DT, Prodhom B, Reiher WE, Roux B, Schlenkrich M, Smith JC, Stote R, Straub J, Watanabe M, Wiorkiewicz-Kuczera J, Yin D, Karplus M. J Phys Chem B. 1998;102:3586–3616. doi: 10.1021/jp973084f. [DOI] [PubMed] [Google Scholar]
- 33.Trylska J, Konecny R, Tama F, Brooks CL, III, McCammon JA. Biopolymers. 2004;74:423–431. doi: 10.1002/bip.20093. [DOI] [PubMed] [Google Scholar]
- 34.Lau AWC, Pincus P. Phys Rev E 2002. 2002;66:041501–041514. doi: 10.1103/PhysRevE.66.041501. [DOI] [PubMed] [Google Scholar]
- 35.Gillilan R, Wood F. Computer Graphics. 1995;29:55–62. [Google Scholar]
- 36.Humphrey W, Dalke A, Schulten K. J Mol Graph. 1996;14:33–38. doi: 10.1016/0263-7855(96)00018-5. [DOI] [PubMed] [Google Scholar]
- 37.Sgro JY, Jacrot B, Chroboczek J. Eur J Biochem. 1986;154:69–76. doi: 10.1111/j.1432-1033.1986.tb09360.x. [DOI] [PubMed] [Google Scholar]
- 38.Sacher R, Ahlquist P. J Virol. 1989;63:4545–4552. doi: 10.1128/jvi.63.11.4545-4552.1989. [DOI] [PMC free article] [PubMed] [Google Scholar]


