

Abstract
The discovery of the tumor-inhibitory properties of asparaginase (ASNase) began in the early 1950s with the observation that guinea pig serum-treated lymphoma-bearing mice underwent rapid and often complete regression. About 4000 cases of acute lymphoblastic leukemia (ALL) are diagnosed very year in the US and many more through out the world. The majority of these cases are in children and young adults, making ALL the most common form of malignancy in these age groups. The treatment protocols of ALL are complex and use 6–12 drugs. Consequently, the improvement in the protocol design has improved significantly the success rate for long-term event-free survival in the past 20–30 years, which is now approximately 75% for patients afflicted with the higher risk ALL features and just above this percentage for patients with standard or good features. Despite this success, approximately 15% of patients die from ALL, making leukemic relapse the most common cause of treatment failure in pediatric oncology. ASNases have been the cornerstone of ALL therapies since the late 1970s. Native or pegylated L-asparaginase (ASNase or PEG-ASNase) are highly specific for the deamination of L-asparagine (Asn) to aspartic acid and ammonia. Depletion of Asn leads to a nutritional deprivation and inhibition of protein biosynthesis, resulting in apoptosis in T-lymphoblastic leukemias, which require Asn from external sources. The reactions of the host exposed to repeated ASNase treatments as well as the up-regulation of the mammalian enzymes to overcome the ASN-depletion toxic condition are of significant importance and may make us relearn the lessons on this important antileukemic drug.
Keywords: acute lymphoblastic leukemia, asparaginase, enzymatic activity, pegylation, antibodies, asparagine, glutamine, pharmacokinetics, pharmacodynamics
Introduction
The aims of this article are to:
1) Review the mechanism of action of this class of protein inhibitor drugs, asparaginases (ASNase) as anti-leukemia drugs,
2) Review the clinical results and current use of ASNase from the published literature,
3) Present the population pharmacokinetic and pharmacodynamic studies on ASNase,
4) Present a pharmacological model for ASNase efficacy,
5) Review the principles of cellular and host resistance to ASNase, and
6) Inform the clinical oncologist on the latest of the pharmacology literature of ASNase formulations in newly diagnosed and relapsed acute lymphoblastic leukemia (ALL) patients.
In these efforts, we admit that there are many limitations and unanswered questions, especially in the comparisons of the various ASNase formulations available around the world.
History of L-asparaginase
Despite the successful treatment of pediatric acute lymphoblastic leukemia (ALL) in recent years, 10%–25% of the ALL patients relapse early, quite a few while on maintenance therapy (30 months from induction). Then, their long-term outcome becomes problematic and uncertain. Pharmacological attempts to improve the treatment of relapsed patients have not been very successful, probably because of multiple genomic problems and acquired drug resistance, which can be manifested either as leukemia blast or host resistance.
Among the drugs used as the cornerstone of combination protocols in the treatment of leukemias are the bacterial enzyme L-asparaginase (ASNase). The first discovery of the tumor-inhibitory properties of ASNase was 50 years ago, with the observation that guinea-pig serum treated lymphoma-bearing mice (particularly 6C3HED) underwent rapid and often complete regression (Kidd 1953). In the 1960s, and continuing research in this field, Broome reported that ASNase activity in guinea-pig serum was responsible for the anti-lymphoma effects (Broome 1961, 1963). Inhibition of incorporation of L-asparagine (Asn), which caused alterations in protein and nucleic acid metabolism of the 6C3HED lymphoma cells by the guinea pig containing ASNase, was found to be responsible for the tumor growth inhibition (Sobin and Kidd 1966a, 1966b). The final proof that ASNase was the tumor-inhibitory agent of guinea pig serum was furnished by other investigators who isolated the enzyme to homogeneity as judged by immunoelectrophoresis and demonstrated that it was strongly inhibitory to lymphoma tumors (Yellin and Wriston 1966). Moreover, Mashburn and Wriston and others, found that Escherichia coli yielded preparations that inhibited tumors, but other bacterial ASNases were either less active or completely inactive (Mashbur and Wriston 1964; Broome 1965). Subsequently, the native E. coli ASNase was then developed as a drug for use in patients.
Biochemistry and mechanism of action of ASNase
Enzymes are the ideal catalysts for a given substrate, much more efficient and specific in their reaction characteristics than any man-made catalyst. However, when enzymes are used as drugs they have unique disadvantages, such bacterial protein purity and limited pharmacokinetic (PK) distribution in a mammalian system (mostly in the central compartment of the plasma volume), and they are often immunogenic to the host. These bacterial proteins must be purified extensively to eliminate toxic reactions and to minimize immune reactions, and they have limited biodistribution and rapid elimination from circulation (Capizzi and Holcenberg 1993). Despite these problems, native E. coli and Erwinia ASNase have made major contributions in the treatment outcome of ALL patients (Ertel et al 1979).
E. coli was shown to possess two enzymes, one expressed constitutively (EC1, Km = 5 mM) and another induced by anaerobiosis (EC2, Km 12.5 μM); only the latter was tumor inhibiting (Schwartz et al 1966). L-asparaginase (L-asparagine amidohydrolase, EC3.5.1.1) is an enzyme, which catalyzes the hydrolysis of L-asparagine into L-asparatic acid and ammonia (Figure 1). Tumor-inhibitory enzymes have been isolated from a number of other bacteria (such as Erwinia carotovora or Erwinia chrysanthemi), notably because of their use in the clinic (Wade et al 1968). Despite the low Km of EC2 it was found early on that it was necessary for the enzyme to persist sufficiently long in the circulation of the recipient animal for effective anti-tumor action. Consequently, multiple doses of native ASNase are administered in a time- and dose-dependent manner. Highly purified E. coli ASNase (EC2) became available to the pharmaceutical industry, and although striking remissions were reported in many of these patients with ALL who received the enzyme-drug, these remissions proved to be relatively short-lived with a median of 122 days of survival (Sobin and Kidd 1965; Oettgen et al 1967; Broome 1981). At about that time there was a clear understanding that ASNase was attacking neoplastic cells on the nutritional requirement caused by the lack of Asn. Then, the idea was introduced of combining this agent with the newly discovered cytosine arabinoside (ara-C) and 6-mercaptopurine (6-MP) or thioguanine (6-TG) and daunomycin with vinca alkaloids to achieve 50-day cures in mice (Broome 1981; Burchenal and Karnofsky 1970). General nutritional deprivation, or Asn depletion, after ASNase treatment led to significant changes in the absolute pool sizes, especially of ATP, UTP, and CTP. Fluctuations were found depending on the elapsed time after the nutritional perturbations occurred. Depletion of the growth medium by 1 hour of guinea pig ASNase action, led to considerable inhibition of the conversion of exogenous uridine to CTP by the cells. A series of experiments indicated that in 6C3HED lymphoma cells, the uridine nucleotide pool, which provided the immediate precursors to RNA, behaves as a small compartment in rapid equilibrium with exogenously supplied nucleosides (Goody and Ellem 1975). Glutaminase-asparaginase from Pseudomonas 7A appears to have four subunits with a molecular weight of 36 kDa +/− 0.5 kDa by sedimentation equilibrium and 34 kDa by amino acid analysis. Analytic sedimentation equilibrium of the native enzyme showed a molecular weight of 140 kDa +/− 3.3 kDa with no signs of association or dissociation, or polymerization (Holcenberg and Teller 1976; Chabner and Loo 1996). Similar molecular weight is determined for E. coli ASNase (134 kDa), which maintains a significant glutaminase activity.
Figure 1.
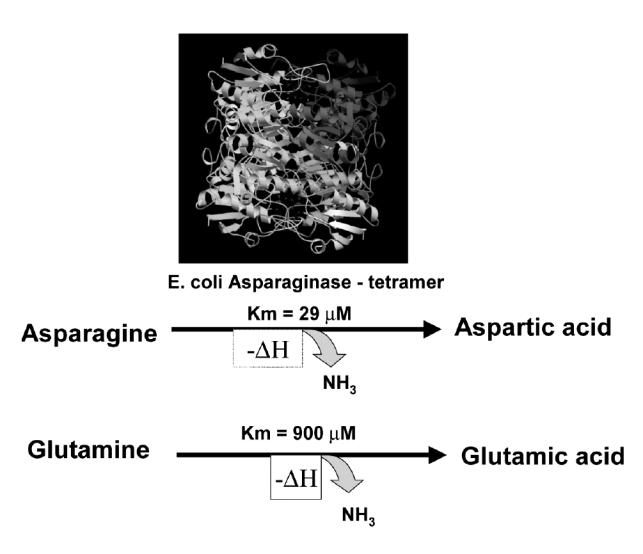
Asparaginase deaminates both asparagine and glutamine.
More on the mechanism of action of ASNase
As stated earlier, ASNase owes its antileukemic effect to the rapid and almost complete conversion of circulating Asn concentrations to aspartic acid and ammonia. Although Asn is not an essential amino acid, the thymus, and T-cell types of leukemia that lack this amino acid lead these cells to depend on extracellular sources of Asn for their protein synthesis. The serum contains a steady-state level of approximately 50 μM Asn. This amount of amino acid is derived from ingested nutrients and from de novo biosynthesis in the liver through the catalysis of aspartic acid and ammonia (from glutamine, Gln) by the mammalian enzyme asparagine synthetase (AS) (Avramis et al 2002; Panosyan et al 2004). One of the forms of drug resistance to this class of antileukemic agents is the upregulation of AS in the liver as well as in the leukemia cells, the net result of which is sufficient levels of Asn in circulation for protein synthesis. Elevated serum Asn levels are correlated with higher rates of events in children with relapsed ALL (Gaynon 2005; Jarrar et al 2006).
The side-effects of chemotherapy are many. However, the greatest shortcoming of the ALL treatment is its lack of efficacy in all patients. However, even in the higher risk ALL patients, of the patients who relapsed within 12 months of the completion of their primary therapy, about 75% achieved second remission by switching to the use of pegylated (PEG)-ASNase (Gaynon 2005; Jarrar et al 2006). This is in accord with the previously published studies in relapsed ALL patients where weekly PEG-ASNase was successful in re-inducing patients above 90% if they maintained elevated trough serum ASNase enzymatic activity levels (Abshire et al 2000; Hawkins et al 2004). Therefore, in Ab(–) patients, PEG-ASNase may still provide an advantage in inducing second complete responses (CRs). Conversely, delayed depletion of Asn and Gln for any biochemical or dosing reason, can cause the rebounding of these amino acids and the survival of the, now moderately or robustly, drug-resistant leukemia blasts.
The proof of principle of the usefulness of native ASNase was provided in 1979 when Ertel at al (1979) reported the first major study treating relapsed ALL with single agent E. coli ASNase (Figure 2). This study demonstrated clearly the unique ability of the drug used as a monotherapy to re-induce complete responses in relapsed ALL patients in a dose-response manner. The dose escalation of the drug demonstrated that 6000 IU/m2 was the therapeutic dose to achieve approximately 60% re-induction complete remission without severe toxicity (Ertel et al 1979). The major limitation to the use of ASNase was the clinical hypersensitivity, which developed in 3% to 78% of patients treated with the native forms of the enzyme (Khan and Hill 1971). This important issue is discussed further later in this review.
Figure 2.
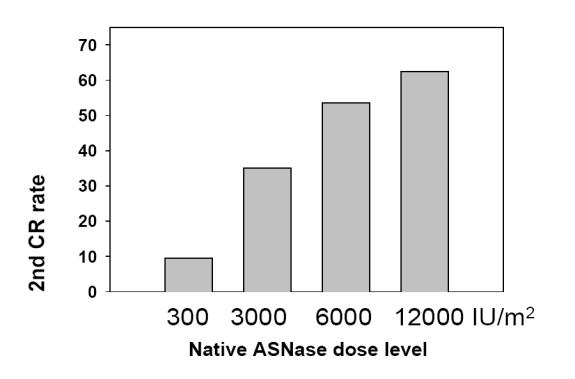
Dose-response of native asparaginase (ASNase) inducing second complete response (CR) rates in pediatric acute lymphoblastic leukemia. Derived from data of Ertel et al (1979).
Today, two products, native E. coli ASNase (ELSPAR®, Merck, Inc.) and PEG-ASNase (ONCASPAR®, Enzon Pharmaceuticals) are widely used against ALL in the USA. In Europe and Asia, the Kyowa-Hakko native ASNase formulations are available under different brand names, such as Crasnitin™ and Medac™. All these ASNase are bacterial proteins, which act by deaminating the amino acids Asn and Gln (Holcenberg and Teller 1976; Capizzi and Holcenberg 1993; Avramis et al 2002; Panosyan et al 2004). T-leukemia blasts are dependent on serum Asn for their protein synthesis; however, all lymphoblastic cells appear to be affected by ASNase. E. chrysanthemi ASNase (Erwinase) is also available for patients with clinical allergy to E. coli product. As stated earlier, all ASNases, being of bacterial origin, often induce a host response with the production of anti-ASNase antibodies. These antibodies eventually neutralize ASNase and this will be discussed later in the review.
Native and PEG-ASNase: Pharmacokinetics and pharmacodynamics (PK–PD) in the host
As stated earlier, ASNase has been used very effectively for many years to treat ALL and other lymphoid malignancies. Leukemia cells lacking the mammalian AS enzyme depend on exogenous sources of Asn for protein synthesis and survival. Theoretically, the deamination of serum Asn and or Gln selectively kills leukemia cells, leaving normal cells, which have the ability to synthesize Asn intracellularly, unaffected. Many factors influence the antileukemic activity of ASNases. Among these are: the biochemical factors of the rate of hydrolysis, and the Km of the enzyme for Asn or Gln (Holcenberg and Teller 1976; Panoysan et al 2004); the pharmacological factor of serum clearance of the enzyme-drug and the development of tumor cell resistance to ASNase; and the host immunological effects of anti-ASNase antibody formation, and augmented Asn “input” from the de novo biosynthesis of Asn by the liver and/or the contributions from nutrient intake (Capizzi and Holcenberg 1993; Panosyan et al 2002).
In the US, three ASNase formulations are available: native E. coli ASNase (ELSPAR), its pegylated form ONCASPAR (monomethoxypolyethylene glycol –L-asparaginase, PEG-ASNase), and Erwinia ASNase from E. chrysanthemi, which previously was available for patients with clinical allergic reactions to the other two formulations, and is now (summer 2006) available again in the US (marketed by OPi, Lyon, France). Native E. coli ASNase has been used in higher doses, such as 10 000 or 25 000 IU/m2 × 30 weekly doses (Capizzi 1993; Silverman et al 2001). Clearly, the three formulations have different half-lives of elimination after i.m. administration (Table 1) (Asselin et al 1993). In addition, the rates of anti-ASNase antibody formation vary significantly (Kurtzberg et al 1993; Woo et al 1998, 2000; Albertsen et al 2001, 2002; Avramis et al 2002; Klug-Albertsen et al 2002; Panosyan et al 2004).
Table 1.
Asparaginases (ASNase) and their half-lives
| Product | Source | (T)1/2 (days of depletion) (Asselin et al 1993) | (T)1/2: CCG 1961, CCG 1962 (Avramis et al 2002) |
|---|---|---|---|
| E. coli native | Merck & Co, Inc. | 1.28 days | 1.1 days |
| ASNase | (14–23 days) | (CCG 1962) | |
| PEG-ASNase | Enzon Pharmaceuticals | 5.73 days | 6.0 days |
| (ONCOSPAR®) | (26–32 days) | (CCG 1962) | |
| Erwinase | Speywood Pharmaceuticals, Inc. | 0.65 days | 18.5 hours |
| Native ASNase | (7–15 days) | (CCG 1961) |
Asparaginase pharmacokinetic studies in standard risk ALL patients – CCG-1962
For this study, 117 children with standard-risk ALL were given randomized assignments to receive native or PEG-ASNase as part of induction and 2 delayed intensification phases (Avramis et al 2002). Patients treated with PEG-ASNase had more rapid clearance of lymphoblasts from day 7 and day 14 bone marrow aspirates and more prolonged ASNase activity than those treated with native Asparaginase. In the first delayed intensification phase, 26% of native ASNase patients had high-titer antibodies, whereas 2% of PEG-ASNase patients had those levels. High-titer antibodies were associated with low ASNase activity in the native arm, but not in the PEG-ASNase arm. Adverse events, infections, and hospitalization were similar between arms. Event-free survival at 3 years was 82% (Avramis et al 2002). However, a recent follow up demonstrated statistical trend of difference in the Kaplan-Meier survival curves in favor of the PEG-ASNase arm: 7/59 vs 11/59 relapses, which most likely is the sum of the effects of the mentioned advantages of PEG-ASNase over the native enzyme (Avramis et al 2002). Further analyses demonstrated also that patients with higher than >1 μM of cerebrospinal fluid (CSF) Asn levels during the ASNase treatment were more likely to have isolated central nervous system relapse later. It is imperative to emphasize that these low concentrations of Asn in CSF and serum specimens first reported in these studies in some patients have now been reproduced in other clinical studies (Appel et al 2003).
Non-linear mixed effects model population pharmacodynamic models
A population pharmacodynamic model (PPD) using the non-linear mixed effects model (NONMEM) program was developed that closely fits the measured enzyme activity and Asn concentrations. A population model for the one-compartment open model using the NONMEM computer program was designed as described (Avramis et al 2002). The Michaelis-Menten (M-M) equation was programmed into a separate ADVAN/TRANS subroutine of this program, so that we could model serum ASNase enzymatic activity and its substrate Asn simultaneously. Serum PEG-ASNase activity and Asn values during induction were analyzed with a combined population PK-PD model, the M-M equation, and a NONMEM program. Pharmacokinetic parameters were fixed to estimates obtained in separate analysis of measured PEG-ASNase data and only pharmacodynamic parameters were estimated. Steady-state Asn concentration was assumed to be 50 μM. Pharmacodynamic modeling of native ASNase could not be done because of the repeated doses and infrequent sampling. However, classical population analyses were performed and were compared with the results from the NONMEM analyses for PEG-ASNase (Avramis et al 2002).
The mean PEG-ASNase activity in serum peaked on day 5 after the i.m. dose and averaged 1 IU/mL. The absorption from the i.m. site and elimination of PEG-ASNase from the serum were best described by single exponential functions. The mean T1/2 of absorption from the i.m. site was 1.7 days and the elimination T1/2 of PEG-ASNase was 5.5 days (Table 1). A similar analysis showed a T1/2 of elimination to be 6 days (not statistically significant from the previous one). The one-compartment population analysis showed an apparent volume of distribution for the central compartment (Vdc) of 1.5 L/m2. Clearance by non-compartmental and one-compartment models was estimated to 0.169 and 0.18 L/m2/day, respectively (not statistically different). The Vss estimated from the relationship of Vss = (dose*AUMC)/(AUC)2 was 1.86 L/m2, calculated by the non-compartmental method based on statistical moment theory. The systemic Vd estimated from the one-compartmental analysis from the relationship of CL = Vd*Kel was 1.34 L/m2. The average volume of distribution from different analyses was 1.5 L/m2 (Avramis et al 2002).
Elimination of native ASNase after the first induction dose was determined in one patient who had multiple samples drawn. A peak activity of 2IU/mL was seen 4 hours after i.m. administration and the T1/2,el was 1.1 days (Table 1). When the mean serum ASNase activity vs the days after the last ASNase dose were plotted for all the patients who received native ASNase they showed an elimination T1/2 for induction, delayed intensification #1 (DI 1), and delayed intensification #2 (DI 2) of 1.8, 1.5, and 1.5 days, respectively (Avramis et al 2002).
There was correlation between ASNase enzymatic activity and depletion of Asn or Gln in serum. This correlation was best described by a third-order regression – “sigmoid fit”. Under such pharmacodynamic conditions only a narrow range of enzymatic concentrations can achieve optimal substrate (Asn) deamination. The relationship between ASNase activity and percentage of Asn deamination was best fitted by a sigmoid curve. That curve indicated that serum Asn would be deaminated by 50% at an ASNase activity of 0.05 IU/mL. A concentration of 0.7 IU/mL was correlated with much higher Asn deamination and a concentration of 1.8 IU/mL of PEG-ASNase activity was estimated to cause a decrease of 96% in serum Asn.
The population model estimated an apparent Km for asparagine deamination of 29 μM in these patients (in vivo), which is approximately three-fold higher than the literature value of 12 μM, a value, which has been determined under initial reaction rates and ideal biochemical conditions. There was no correlation between the volume of distribution, the half-lives of absorption or elimination of PEG-ASNase and surface area or age of patients. There was strong correlation between ASNase activity and glutamine concentrations in serum after administration of preparation. Gln concentrations were <100 μM when ASNase was >0.4 IU/mL with either form of ASNase. In CSF Asn depletion was not complete in all patients treated with either PEG-ASNase or native ASNase enzyme formulations. However, the population average on day 6 of induction was 0.9 log10 lower (average 0.1 and 0.9 μM (n = 54; not statistically different)) in the PEG-ASNase arm than the native arm. Intensive PEG-ASNase for newly diagnosed ALL should be tested further in a larger population (Avramis et al 2002).
PD of PEG-ASNase in relapsed high risk ALL patients
Asn and Gln depletion after intensive weekly or biweekly administration of PEG-ASNase treatment has been correlated with the re-induction outcome in children with ALL in first bone marrow relapse (CCG-1941), despite the fact that ASNase enzymatic activity did not predict Asn depletion (Jarrar et al 2006). The hypothesis was that day 14 Asn and Gln depleted levels would predict re-induction response (treatment outcome) in antibody-negative relapsed high risk ALL patients. In particular, we hypothesized that low day 14 serum Asn would predict favorable induction response. The results demonstrated that in patients with M1 marrow status at the end of induction, the mean day 14 Asn level was 3.95 ± 2.5 μM; levels in M2 and M3 patients were 7.67 ± 7.67 μM and 14.83 ± 7.31 μM, respectively. The difference among response categories was statistically significant (p = 0.01). Sixteen of 19 patients with day 14 Asn levels <3 μM achieved M1 status compared with 5 of 11 with Asn levels ≥3 μM (p = 0.03). In other words, patients with day 14 Asn levels less than 3 μM and Gln levels less than 127 μM achieved M1 marrow status, compared with patients with greater than 3 μM Asn or greater than 127 μM Gln who did not achieve CR (Jarrar et al 2006). A serum Asn level of 3 μM represents approximately 10% of the Km of this enzyme, a level at which the velocity of reaction (V) would be approximately 10% of Vmax as per the M-M equation.
In separate studies where PEG-ASNase 2500 IU/m2 was administered weekly or biweekly, the trough serum enzymatic activity levels averaged 0.75–0.8 IU/mL at trough times, ie, on day 7, and accumulated to higher concentrations of 1.2–0.9 IU/mL on days 21 and 28 of induction or after the 3rd and 4th doses, respectively (Table 2) (Abshire et al 2000; Hawkins et al 2004). Consequently, serum Asn was reduced significantly (p<0.002 for all comparisons) from day 0 to days 7, 14, 21, and 28 during induction. Serum levels of Asn were less than 3 μM in over 2/3 of the patients at each time point post-treatment both during induction and intensification. Similarly, Gln serum concentrations were below 100 μM in over 50% of the patients at these time points. Moreover, the CSF concentrations of Asn were progressively lower during induction, most patients having less than 1.5 μM. It is imperative to note that in other studies, low but detectable levels of CSF Asn were reported even after intravenous administration of PEG-ASNase (Appel et al 2003). Therefore, our findings of residual Asn in CSF of patients were consistent with subsequent clinical study findings. Furthermore, these findings are also consistent with isolated hepatic perfusion studies, which have suggested that the liver is capable of increasing Asn input to the circulation after ASNase treatments and in response to Asn deamination (Woods and Handschumaker 1973).
Table 2.
Weekly vs q 2 weekly pegylated asparaginase (PEG-ASNase) in first relapse (VPLD)
| PEG-ASNase dosing | Number of patients in CR pts | Asparaginase trough levels | 2nd CR (%) |
|---|---|---|---|
| q 2 weeks | 63 | 0.75 IU/mL | 50 (79%) |
| q weekly | 63 | 61 (97%) |
Derived from results of Abshire et al (2000)
In addition, Asn may also be input to the circulation from the nutrients that are consumed by the host. Therefore, a possibility exists that an equilibrium of low Asn serum and, hence, CSF concentrations, can be achieved when the systemic input balances the rate of enzymatic depletion (Capizzi and Holcenberg 1993). This is especially true under lower serum ASNase enzymatic levels (trough times) during which M-M conditions the velocity of the Asn deamination reaction is much lower than the Vmax due to the low substrate concentrations. Conversely, the delayed administration of native ASNase from Friday to next Monday, given on the Mon-Wed-Fri treatment schedule, most likely intensifies this adverse pharmacodynamic effect. Thus, PEG-ASNase, not being subject to these time and dose variabilities, may be a more efficacious formulation.
Treatment-related adverse effects: the anaphylactoid immune response to commonly used chemotherapy drugs
Despite the compromise of the immune system upon initiation of induction treatment of ALL, allergic or anaphylactoid reactions can occur after administration of many drugs, including native E. coli ASNase or PEG-ASNase. Other drugs associated with obvious clinical reactions are cis-platin, cyclophosphamide, bleomycin, doxorubicin, cytosine arabinoside, and methotrexate (Weiss 1982).
The most frequent and severe allergic reactions have been observed in patients after multiple doses of ASNase and, less frequently, PEG-ASNase. These obvious clinical reactions can occur after the second or third doses or even after many months post-induction therapy. The risk of the reaction is reduced when ASNase is given in combination with prednisone or dexamethasone and other immunosuppressive agents. Substitution of native ASNase with PEG-ASNase or E. carotovora ASNase circumvents recurrent anaphylactoid reactions once a reaction to native ASNase has been documented. However, the IgG antibodies against native ASNase can recognize the pegylated antigen and the injection of Erwinase can initiate its separate immune reaction and development of anti-Erwinase antibodies (Albertsen et al 2001, 2002; Klug-Albertsen et al 2002).
Clinical manifestations of ASNase hypersensitivity reactions are:
anaphylaxis (rare)
allergic reactions
edema
serum sickness
broncospasm
urticarea and rash
itching and swelling of extremities
erythema – local or generalized
other clinically related reactions
Other toxicities to ASNases include:
organ toxicities
pancreatitis and related hyperglycemia, glucosuria, ketoacidosis
liver dysfunction
cerebral dysfunction
decreased protein synthesis:
hypoalbuminemia
hypofibrinonemia hypercoagulable state – coagulopathies
clotting factors
Immune response to ASNase antigen: cumulative dose exposure of an antigen (ASNase) and immune response relationships
In classical immunization, the amount of the bacterial or viral proteins is known and a gradually increased dose exposure of the antigens(s) is re-inoculated on subsequent immunizations. In oncology, it is impossible to estimate the dose of ASNase antigen in mmol per kg of body weight of ALL patients, since neither ASNase formulation provides the relevant information of IU of mg or mmol of protein concentration on the supplied package insert.
The immune reaction to the first dose of ASNase is extremely rare and occurs in patients with atopic predisposition. Atopy is mediated by genetic factors with the presence of specific human leukocyte antigen (HLA) alleles, environmental factors, eg, allergen sensitization, and defects in target organs, eg, skin, gastrointestinal mucosa, and oral epithelium. However, upon re-exposure of many doses of either native ASNase or PEG-ASNase the theoretical IgA → IgM → IgG is assumed to be taking place at 0.1 mmol/kg of body weight. Clinical allergic or anaphylactoid reaction may occur when the levels of circulating IgG antibodies against ASNase become elevated. The first exposure to ASNase most likely produces a primary response. Subsequent treatments will yield a secondary (or anamnestic) and tertiary immune responses. Obvious clinical reaction can then take place. When there is successful pre-conditioning of the host with prednisone, the depletion of helper T-cells and other immune cells is assumed; hence, there is unresponsiveness to the subsequent ASNase administrations. Upon discontinuation of the ASNase therapy, the circulating IgG antibodies decline to non-detectable levels. However, the memory B cells are assumed to exist in the host for life.
Moreover, there seems to be a relationship between the age of the patient and immune response. The infants and the younger patients are less likely to develop antibody positivity and obvious clinical reaction to ASNase therapy. In contrast, teenagers and adult patients are more likely to react to ASNase treatments.
The IgE antibodies do not fix the antigenic compliment, yet mediate immediate (acute) and severe hypersensitivity reactions by causing the release of mediators from mast cells and basophils (histamine and leukotrienes), upon re-exposure to the antigen. In contrast, the IgG are the main antibodies responsible for the moderate to slight allergic reactions and the product of secondary immune response (humoral immune response). These antibodies fix onto the compliment and neutralize the antigen (toxin) or foreign protein. IgA and IgM are primary response antibodies in the progression of immune response to IgG or IgE antibodies, a process called affinity maturation.
Antibodies to ASNase formulations: the CCG Standard Risk ALL experience
The primary endpoint of the CCG-1962 study was to find whether incidence of high-titer anti-ASNase antibodies in children treated with PEG-ASNase was decreased by at least 50% in DI 1 compared with those treated with native ASNase (Avramis et al 2002). A secondary endpoint was to show whether the same decrease occurred in DI 2. ASNase therapy is given frequently per clinical protocols. However, there were no serum specimens obtained during consolidation or interim maintenance 1 to clearly define the exact timing of the anti-ASNase antibody appearance. Therefore, the question of “when antibody first appeared” is important. We believe that this is not the subject of a review article to address, but may be a suitable subject for a prospective study. The mean ± SEM antibody ratio in DI 1 was 1.9 ± 0.8 (n = 47) for children treated with PEG-ASNase and 3.0 ± 0.7 (n = 43) for those treated with native ASNase (p = 0.001 by Wilcoxon two-sample test). The respective mean ± SEM ratios for PEG-ASNase and native ASNase were 1.3 ± 0.2 (n = 41) and 2.3 ± 0.9 (n = 47) for induction (NS) and 2.1 ± 0.8 (n = 45) and 2.1 ± 0.6 (n = 45) for DI 2 (NS). The difference in high-titer antibodies was especially evident in DI 1, in which 11 of 43 children in the native ASNase arm had ratios ≥2.5, whereas 1 of 47 in the PEG-ASNase arm had that level (p = 0.001, Wilcoxon test) (Avramis et al 2002). The differences were less apparent in DI 2 (p = 0.09, Wilcoxon test) and not significant during induction. Comparison of the maximum antibody ratio of each patient, irrespective of cycle, showed higher titers in the native ASNase patients (p=0.0009, Wilcoxon test). We anticipated that 50% of children treated with native ASNase would have antibody ratios of at least 2.5 at some time during their therapy. Only 26% of children in the native ASNase arm had ratios ≥2.5 but over 40% of them had ratios of ≥1.5. The antibody levels tended to decrease between days 7 and 28 of each ASNase-containing phase and were lower in DI 2 than DI 1 (Table 3) (Avramis et al 2002). In conclusion, the antibody formation along with the genetics of the leukemia blasts resulting in different immunoglobulin rearrangements may constitute a pharmacogenomic characteristic.
Table 3.
Anti-asparaginase (pegylated, PEG-ASNase; native ASNase) antibody presentation in various treatment phases and studies
| CCG-1962 (PEG vs native-ASNase) | CCG-1991 (PEG-ASNase) | CCG-1961 (native/PEG-ASNase) | |
|---|---|---|---|
| % patients with anti-ASNase antibody | End of induction PEG 5%, native 15% | 14% | 60% (611/1001) (Panosyan et al 2004) |
| End of DI 1 (6 months) PEG 11%, native 41% | |||
| End of DI 2 (10 months) PEG 18%, native 44% | |||
| Rate of events | PEG 8/58 | No allergy 3/57 (5%) | |
| Native 16/58 | Allergy, changed to Erwinase 3/115 (2.5%) | ||
| (Current data) | Silent, no change to Erwinase 13/81 (16%) |
Novel approaches to test for cross-reactivity of ASNase formulations
In the era of recombinant DNA gene product(s) expression into therapeutic drugs, for example, human adenosine deaminase (ADA), humanized anti-VEGF-A antibody, and many similar monoclonal antibodies against oncoproteins, the possibility that a novel ASNase formulation forms a known bacterium or from new ones is in the planning stage or about to become available for testing in patients. We and other investigators are testing or are about to test in current clinical trials in relapsed ALL patients monoclonal ASNase derived from recombinant DNA technologies, which are purer than anything we have available in our armamentarium. In the past decade, the ASNase extracted from E. carotovora (renamed: E. chrysanthemi) has been used clinically. The advantages of this ASNase formulation are that it possesses greater glutaminase activity (the ability to deaminate Gln) with a Km approximately one-half the concentration that native E. coli ASNase does, and that it lacks cross-reactivity (Capizzi and Holcenberg 1993). Conversely, PEG-ASNase antigen does not cross-react immediately with the antibody against native ASNase, but in time it will cross-react. Therefore, when obvious clinical allergic reactions are documented in patients who had been treated with native ASNase and then PEG-ASNase, these patients were treated successfully with Erwinia ASNase. Currently the formulation is available in Europe, but not in the US.
Other ASNase with or without glutaminase activities have been tested in the past, specifically those proteins from Vibrio succinogenes (renamed Wolinella succinogenes), an anaerobic bacterium. Like native E. coli ASNase, this is a homotetrameric enzyme consisting of 330 residues and of similar molecular weight. The amino acid sequence is 40%–50% identical to the sequences of related proteins from other bacterial sources, and all residues previously shown to be crucial for the catalytic action of these enzymes are identical (Lubkowski et al 1996). However, this antigen is not cross-reacting to Ab(+) sera from patients treated with native ASNase or PEG-ASNase. Therefore, there is a theoretically potential advantage in treating ALL patients optimally with Wolinella ASNase. Moreover, the ASNase isolated from Serratia marcescens has an apparent average molecular weight of 171 000–180 000 as determined by electrophoresis on polyacrylamide gels, with each subunit having a molecular weight of 31 500 +/− 1500. The Serratia enzyme could have five or six subunits of 32 000 Da, compared with four subunits of 32000Da in the native E. coli enzyme. The Serratia ASNase also appears to be a larger molecule than the enzyme from E. carotovora (Stern et al 1976). ASNase from Serratia marcescens was found to hydrolyze L-glutamine at 5% of the rate of L-asparagine hydrolysis and that the two activities had parallel blood clearance rates in mice (Novak and Philips 1974).
With these many and different ASNase formulations potentially available for human testing, one could envision creative ways to test their cross-reactivity between the Ab(+) sera from patients treated with native ASNase and/or PEG-ASNase formulations. One could design a new protocol alternating ASNase formulations of appropriate or bioequivalent dosing before any evidence of host response is evident. This task could be accomplished only by an experienced pharmacologist after appropriate thought and justification and not to be left in the hands of the young but exuberant investigator. Hence, no haphazard processes should be attempted in implementing these suggestions. ASNase formulations are antigens to human hosts and need to be used wisely. Moreover, and in order to assess the cross-reactivity, Ab(+) sera from patients could (must) be incubated ex vivo, with various concentrations of these alternative and possibly useful ASNase formulations (antigens) in large numbers to determine statistically the true rate of cross-reactivity. Assuming that one has a potentially non-cross-reacting ASNase formulation, like Erwinia ASNase, one then must proceed with inoculations of animals, rabbits, or mice with either antigen, then cross-react with the alternative antigen and observe for immune reactions. An alternative to this experiment could be that the antigen-tolerating mice and assumed Ab(+) could be inoculated with murine leukemia cells and the alternative ASNase formulation could be tested, for instance, against their L1210 leukemia. The assessment of the results from these studies should then guide the investigators for further evaluation in patients.
Toxicity of ASNases
The toxic effects of ASNase are related primarily to immune reactions to this bacterial protein and to the effects of Asn depletion, and its subsequent inhibition of protein synthesis in major glands such as the liver and pancreas. The allergic reactions are the most prominent toxicities, and although grade 3 and 4 are lower than grade 1 and 2, they are primarily due to anti-ASNase Ab(+) in circulation. In the high risk ALL study (CCG-1961) clinical allergy and high titer Ab were very common with the augmented regimen on CCG-1961 (Avramis et al 2002; Panosyan et al 2004).
Patients received 46 doses of native ASNase or 10 doses of PEG-ASNase after induction, most with no steroid immunosuppressive coverage in consolidation and interim maintenance 1 (IM1) phases of treatment (Table 3). About one patient in three had clinical allergy symptoms compared with fewer than 5% in CCG-1962, where patients received ASNase only with steroid immunosuppression without alterations in the pharmacokinetic profile of the drug (Avramis et al 2002; Panosyan et al 2004). Clinical allergy was most common when ASNase was given without steroids. For this, we hypothesize that limiting ASNase therapy to the times of steroid immunosuppression will decrease the frequency of clinical allergy, prevent the appearance of high titer antibodies, achieve greater Asn and Gln depletion in serum, and improve outcome. Nevertheless, we still do not know the best way to administer these bacterial proteins to achieve optimal effect and to minimize allergic reactions. The paper by Panosyan et al (2004) provides some additional and important clues. Several laboratories have shown that treated patients can develop a silent allergy where circulating antibodies neutralize ASNase activity resulting in an ineffective contribution by the drug to the anti-leukemic pharmacodynamic effect, without causing obvious clinical allergic symptoms. When this occurs these patients receive a shorter duration of effective ASNase treatment. This suggests that monitoring for silent anti-ASNase antibodies or loss of ASNase activity could provide a better understanding of this class of anti-leukemic drugs and thereby improve outcome.
Correlative factors in ALL treatment outcome
A statistical interim analysis was released 4 years after the opening of CCG-1961 study. According to this study’s protocol, 1200 pediatric patients received 9 doses of native E. coli ASNase during induction and then 2 doses of PEG-ASNase during consolidation. Four or more specimens were obtained from the vast majority of patients per study protocol CCG-B951. Patients were selected randomly for the anti-ASNase antibody assays. Among these patients 410 had 4 or more sera specimens assayed for antibody titer. The results were expressed as a ratio over negative control per ELISA assay. The data were transmitted to the statistician’s office at the CCG Statistical Center, who performed an interim analysis with treatment outcome. Among the 410 patients, 280 had all clinical data available for evaluation of efficacy, clinical allergy, and outcome for 30 or more months. The remaining patients lacked clinical data or they had not completed 30(+) months from induction treatment. According to the interim analysis, the antibody and clinical event data (event free survival, EFS) showed that there were 4 sub-sets of patients, the three proposed ones and a fourth consisting of patients with clinical allergy symptoms and Ab(−) sera (false negative reaction or reaction to other agents) (Panosyan et al 2004). The historical data from ALL studies in CCG show an 80% EFS in 5 years with very few relapses after this time.
The results of this interim analysis demonstrated that the largest subset of patients (41%) developed anti-ASNase Ab(+) and had clinical allergy symptoms. We have shown in other studies that the Ab are inhibiting the ASNase enzymatic activity, thus allowing the serum Asn to rebound. The Ab(+) has an adverse effect on treatment outcomes which was statistically significant in the survival of these patients. This subset of patients received no effective ASNase therapy post-induction. Therefore, patients with anti-ASNase Ab(+) have a worse outcome than any other subset. Since the silent hypersensitivity subset is large (29% of evaluable patients), approximately representing the 25% of all high risk ALL patients who relapse in 5 years from diagnosis, the anti-ASNase antibody could be a surrogate marker, which is responsible for the poor outcome in this disease. The interim analyses have shown that the anti-ASNase antibody has a predictive clinical value and that switching patients with Ab(+) from native ASNase to Erwinase may benefit their outcome, as indicated by the reversal of the hazard ratio from 3.22 to 0.6 (Panosyan et al 2004). Should the final analyses be as important as the interim ones, this model can then be used for alternating ASNase formulations for improved treatment outcome in ALL. Therefore, Ab(+) should be the primary surrogate marker for treatment outcome in future clinical trials. In Ab(−) patients the serum trough levels may be of significant importance, and perhaps more important, the examination of percentage deamination of Asn and Gln at trough times should be the guiding factor(s) for determining correlative outcome analyses.
How best to optimize these ASNase formulations in newly diagnosed ALL patients still remains a challenge. With the reduced or lack of support from the NIH-NCI for clinical studies in oncology patients with “old” but very useful drugs, the possibility that these evaluations will be performed in many hundreds of thousands of patients is nil. The more immediate the “need to know” of these PK parameters are in relapsed ALL patients, whose survival is at high risk, the less interest and hence, the lower the NCI funding support. Relapsed ALL patients are still treated with many of the same drugs they had been treated with as newly diagnosed patients, perhaps with more complex protocol design or increased doses or dose intensity. However, the results from such studies are few and therefore the knowledge for application to the general relapsed patient population is very slim. But the limited data, along with the latest results from targeted therapies in leukemias, may be the subject of future research on effectively targeting relapsed leukemias.
We still remain optimists that, somehow, there will be a time and place when these important scientific questions in newly diagnosed or relapsed ALL pediatric and adult patients will be answered and that much good shall be derived for the ALL patients of this world. Many lessons have been learned (Table 4), and many more to be learned in the near future.
Table 4.
Summary of asparaginase (pegylated, PEG, or native ASNase) dosing and pharmacokinetic–pharmacodynamic parameters
|
|
|
|
Abbreviations: ALL, acute lymphoblastic leukemia; Asn, asparagines; CR, complete response; Gln, glutamine.
Genetics of ALL leukemia blasts
Many genetic factors, such as chromosomal abnormalities and karyotypic changes, lead to HLA (major histocompatibility complex) polymorphisms. The notion of the existence of the leukemia stem cell (LSC) is novel and worrisome (Jamieson et al 2004). In addition, micro-environmental factors are influencing the pro-survival and growth of the LSC. Many other factors, like optimal drug dosing, age, gender, growth factors in circulation, immune system maturity, supportive care, and response to foreign antigens of the host may play important roles in the response to chemotherapy treatments.
Translocations and other chromosomal aberrations are important in treatment outcome. Monosomies, trisomies, Bcr-Abl, Flt-3, MLL-AF4, TEL-AML1, and many other oncogene expressions play important roles in the outcome of leukemias. However, the pattern of the Bcr-Abl and other translocations’ transcript levels is often variable; only a minority of patients with fluctuating or persistent levels of oncogene transcripts are evident at diagnosis or at the end of induction treatment, thus defining molecular relapse(s). Yet, as the surviving minimum residual disease (MRD) leukemia cells are “enriched” by these drug-refractory blast cells, the majority of these patients who responded initially to targeted therapy (eg, imatinib mesylate in Ph(+) chromosome leukemias) are likely to be subject to disease progression due to imatinib-resistant Ph(+) ALL blasts (McLean et al 2005).
Furthermore, patients whose leukemia blasts exhibit significant differences in the metabolism and interactions of purine and pyrimidine nucleoside anabolite drugs, such as fludarabine, cladribine, and cytosine arabinoside (ara-C), may have differences in the initial and subsequent dose responses (Avramis et al 1989; Robak 2005). Given the complexity of the immune response and abnormalities in host immunity induced by different cancer cells and their treatments, it is not surprising that early attempts with clinical immunotherapy have not been successful. This, along with the notion that tumor mutations continue to occur with the progression of the malignancy, make neoplasms difficult to treat with immune-based modalities or more intensified treatments and bone marrow transplantation. Therefore, reasons for ALL relapse are many and complex. Yet survival of patients in third remission is less than 10%; hence, novel agents must be integrated into multi-agent combination regimens, which should be applied as early in relapse as possible. Lastly, since most new agents fail investigational clinical trials despite “compelling” pre-clinical data and enthusiastic investigator’s efforts, the progression from the bench to bedside should require intermediate steps and careful considerations (Gaynon 2005).
Relapse ALL: an unconventional future challenge for leukemia patients
Despite the great progress that has been made in the treatment of ALL patients with intensified therapies and the use of optimal ASNase formulations, unfortunately a certain percentage of ALL patients relapse. The present and future challenge in ALL is the relapsed patient population.
Relapse ALL is identified by the reappearance of leukemia blasts after achieving different periods of clinical remission. Considerable advances have been made in the past decades in the treatment of front-line ALL, with long-term cure rates approaching 85%. Relapses in ALL are unfortunate events in patients with resistant, refractory ALL (Gaynon 2005). According to Pui and coworkers at St Jude’s Hospital (Memphis TN, USA), the risk of leukemia relapse was 10.0% ± 1.1% at 5 years and 11.4% ± 1.2% at 10 years after diagnosis of treated ALL between 1984 and 1999 (Pui et al 2005). Moreover, the outcome of ALL is very grim after relapse, with chances of survival of only 10%–40% after second clinical remission and <10% after third and subsequent relapses (Gaynon 2005), although second clinical remissions have been achieved in as much as 85% of the relapsed ALL cases.
Relapse ALL may be stratified into three risk patient groups: low, intermediate, and high-risk. Combined late bone marrow relapse or late isolated bone marrow relapse constitute the low risk group of ALL relapse; isolated extramedullary relapse or the early combined bone marrow relapse constitute the intermediate risk group; and the early isolated bone marrow relapse, T-cell relapse, or the ALL relapse with Bcr-Abl fusion constitute the high risk relapse.
Different sites may be involved in relapse ALL: bone marrow with >25% blasts any time after induction without extramedullary involvement, extramedullary relapse (CNS, testicular, or other sites like the orbits) with <5% blasts in the bone marrow, or combined relapse with ≥5% blasts in bone marrow with extramedulary disease. The timing of the relapse has been expressed differently in different protocols. The Children’s Oncology Group (COG) ALL investigators differentiate early bone marrow relapse as ALL relapse occurring within 3 years of the first clinical remission of induction therapy, whereas late bone marrow relapse is relapse occurring after 3 years of the first clinical remission. It also differentiates early extramedullary relapse ALL as one occurring within 18 months of diagnosis of ALL and late extramedullary relapse as one occurring after 18 months of ALL diagnosis.
Relapse ALL may occur after standard risk, high risk, or very high risk ALL, after pre-B cell, B-cell, T-cell, Ph+ ALL, infant ALL, or after t(4;11), t(1;19), or t(8;14). In treatment of ALL as many as 8–12 drugs are administered. Therefore, in patients in relapse of this disease, treatment failure by native ASNase should be substituted by the intensive use of PEG-ASNase (Abshire et al 2000; Hawkins et al 2004; Jarrar et al 2006). Treatment failure without obtaining clinical remission leads to persistent disease in contrast to relapse ALL, in which there are varying periods of clinical remission before the relapse. Naturally, treatment failure may be due to drug resistance to many other drugs and one should not expect the contribution of one drug formulation to answer all the complicated questions in ALL treatment. Relapse ALL usually retains its original immunophenotype. Different mechanisms for relapse ALL have been postulated, for example: the presence of defective death pathways for apoptosis or necrosis; use of inappropriate drug(s) in inappropriate doses and/or in appropriate sequences; the presence of inhibitors of drugs or antibodies to the drugs used; presence of genetic deviations of specific drug metabolism pathways (thiopurine methyltransferase [TPMT], over expression of genes associated with vincristine, prednisone, asparaginase, daunorubicin or other drugs) leading to drug resistance or refractory disease; and the presence of refractory leukemia cells (leukemia stem cells). Different prognostic factors may be attributed to the outcome in relapse ALL. The duration of the first or subsequent clinical remission is an important prognostic factor. The shorter the duration of the clinical remission the worse the outcome of relapse ALL. Certain immunophenotypes of relapse ALL have worse outcomes, such as T-cell relapse, Ph+ relapse, infant ALL relapse with MLL 11q23 rearrangement, and relapse with severe hypodiploidy or with translocations t(8;14), t(4:11), t(1;19). Suboptimal treatment in terms of sequential combination multi-drug chemotherapeutic agents, dosage, duration of the therapy, and poor patient compliance influence the outcome as well as the frequency of subsequent relapse.
In late isolated bone marrow relapse the tumor burden (blast count at relapse) influences the future outcome. Isolated bone marrow relapse has a worse outcome than combined or isolated extramedullary relapse. The presence of multiple or severe co-morbidities at relapse as well as the nutritional status of the patient in terms of obesity or under-nutrition leads to impaired drug levels and rebound or increased drug toxicities. The presence of M3 bone marrow status (≥25% lymphoblasts) at any point after achieving clinical remission on day 29 induction of newly diagnosed ALL denotes bone marrow relapse. Bone marrow relapse is the principal form of treatment failure in ALL.
The time of the bone marrow relapse determines the outcome of the treatment: early bone marrow relapse has worse outcomes than late bone marrow relapse. Isolated bone marrow relapse, initial high white blood cell count in late isolated bone marrow relapse, bone marrow relapse with T-cell or BCR-ABL fusion as well as a short duration of the first or subsequent clinical remissions lead to poorer outcome in bone marrow relapse ALL, which is also affected by the nature and dosing of the chemotherapy. Isolated extramedullary relapse ALL occurs, with extramedullary disease containing >5% blasts in the bone marrow. Extramedullary disease with >5% blasts in the bone marrow constitutes combined relapse. Extramedullary relapse commonly occurs in the CNS or the testes but may occur at other sites like the orbits. The COG differentiates early extramedullary relapse ALL as one occurring within 18 months of diagnosis of ALL while late extramedullary relapse as one occurring after 18 months of ALL. Approximately 10% of the patients with ALL, especially those with hyperleucocytosis or T-cell leukemia, suffer from CNS relapse. The CSF values show CNS-3 disease with ≥5% white blood cells and unequivocal number of blasts and/or signs of CNS disease (cranial nerve palsy, brain or eye involvement, or hypothalamic syndrome). The incidence of testicular relapse has gradually decreased from 5% to 17% in the early 1980s to about 3.4% in the late 1990s. Recently, approximately 2% of the male patients with bulky disease were reported to suffer from testicular relapse of ALL. Testicular relapse is manifested by unilateral or bilateral testicular enlargement and diagnosed by wedge biopsy, taking into account the involvement of the contralateral testis. An EFS of 66.7% at 10 years was found with aggressive chemotherapy without irradiation (Shama et al 2005).
Relapses in leukemia are and will remain a major challenge for oncologists in the 21st century. Despite aggressive chemotherapy and hematopoietic stem cell transplants (HSCT) most children with relapse die and the chance of survival is only 10%–40%. The ideal treatment to increase the survival of patients with relapse ALL is still lacking but the effort is still ongoing. The present treatment for relapse ALL consists of multi-agent systemic chemotherapy with CNS-directed therapy and HSCT for some patients. EFS and overall survival are best for late bone marrow and combined bone marrow relapse ALL. With improving treatment there is an ongoing tendency for increasing CNS relapses. The current approach in COG is to use different treatment protocols, eg, AALL01P2 for bone marrow relapse patients and patients with combined relapse ALL, and AALL02P2 for the late isolated extramedullary relapse ALL with CR1>18 months, and ADVL04P2 trial with multi-agent chemotherapy supplemented by the anti-CD22 monoclonal antibody epratuzumab. Future considerations in relapse ALL should take into account the prevention of relapse of ALL by appropriate categorization and aggressive therapy for newly diagnosed ALL with a tendency to relapse. Use of gene-expression profiles and micro-array technology to categorize as well as monitor the dynamics of high risk for relapse ALL treatment, early introduction of courses of targeted multiple monoclonal antibody therapy (especially against leukemia stem cells) for ALL with increased risk of relapse, as well as combating drug resistance and refractoriness by monitoring treatment to maintain appropriate drug levels for maximum leukemia cell kill may prove fruitful in the future. Identifying ALL types that escape the above measures and looking into newer novel therapies is still another challenge.
Finally, the pharmacodynamic question on the use of ASNase in relapsed ALL patients is whether more intensive dosing (shorter time interval) and/or continuous or uninterrupted ASNase dosing is providing a tolerable regimen with optimal outcomes. Certain PK–PD simulations on these issues have been performed, suggesting that the more intensive PD effect that is derived from more frequent ASNase dosing may be beneficial to treating optimally ALL patients (Avramis et al 2005). Our patients are awaiting our action.
Conclusions
ASNase is a tetramer protein that deaminates Asn and Gln. ASNase inhibits protein synthesis in T-cells. The average IC50 concentration of PEG-ASNase is 0.4 IU/mL. Gln deamination is necessary for optimal Asn deamination and, therefore, leukemia blast kill. PK–PD analyses show that PEG-ASNase provides a better day 7/14 bone marrow response. ASNase activity of 0.4–0.7 IU/mL provides greater than 90% depletion in vivo (with hepatic asparagine biosynthesis) (CCG-1961 and CCG-1962).
Better Asn and Gln deamination are associated with improved EFS. High titer anti-ASNase antibody is found in some children with no clinical allergy (silent hypersensitivity). IgG antibody neutralizes ASNase activity. Anti-ASNase antibody production leads to inferior treatment outcome in patients with ALL. The purpose of intensive therapy in ALL is also the prevention of immunization to ASNase. The longer activity and less immunogencity with PEG-ASNase may increase EFS and the quality of life. Neutralizing antibody development against native ASNase has cross-reactivity with PEG-ASNase but not with Erwinia ASNase. The dosing of all formulations should be monitored for activity. The early use of PEG-ASNase may require lower dosing and may be more cost effective. A more intensive ASNase dosing may be required to provide high trough levels of 0.4–0.7 IU/mL in relapsed ALL patients.
ASNase therapy for the treatment of newly diagnosed and recurrent-refractory leukemias is an important milestone in the efforts to achieve high EFS, overall survival, with little toxicities and events in patients with these diseases. Maintaining optimal ASNase enzymatic activity at 0.4–0.7 IU/mL, low anti-ASNase antibodies in these patients, and optimal depletion of Asn and Gln play a vital role in achieving these goals. Hence, appropriate monitoring of these parameters during therapy is of the utmost importance. Prevention of relapses in leukemias could be further ensured with intensive ASNase dosing (weekly or biweekly) and appropriate monitoring of these parameters during treatment of newly diagnosed leukemias. Future studies should examine additional aspects that would promote effective ASNase therapy, like the role of asparagine synthetase, gene expression profiles, and micro-array technology in order to categorize leukemia patients and search for inherent resistance or refractoriness to ASNase.
References
- Abshire TC, Pollock BH, Billett AL, et al. Weekly polyethylene glycol conjugated L-asparaginase compared with biweekly dosing produces superior induction remission rates in childhood relapsed acute lymphoblastic leukemia: a Pediatric Oncology Group Study. Blood. 2000;96:1709–15. [PubMed] [Google Scholar]
- Albertsen BK, Schroder H, Ingerslev J, et al. Comparison of intramuscular therapy with Erwinia asparaginase and asparaginase Medac: pharmacokinetics, pharmacodynamics, formation of antibodies and influence on the coagulation system. Br J Haematol. 2001;115:983–90. doi: 10.1046/j.1365-2141.2001.03148.x. [DOI] [PubMed] [Google Scholar]
- Albertsen BK, Schroder H, Jakobsen P, et al. Antibody formation during intravenous and intramuscular therapy with Erwinia asparaginase. Med Pediatr Oncol. 2002;38:310–16. doi: 10.1002/mpo.10096. [DOI] [PubMed] [Google Scholar]
- Appel IM, Pinheiro JP, den Boer ML, et al. Lack of asparagine depletion in the cerebrospinal fluid after one intravenous dose of PEG-asparaginase: a window study at initial diagnosis of childhood ALL. Leukemia. 2003;17:2254–6. doi: 10.1038/sj.leu.2403143. [DOI] [PubMed] [Google Scholar]
- Asselin BL, Whitin JC, Coppola DJ, et al. Comparative pharmacokinetic studies of three asparaginase preparations. J Clin Oncol. 1993;11:1780–6. doi: 10.1200/JCO.1993.11.9.1780. [DOI] [PubMed] [Google Scholar]
- Avramis VI, Mecum RA, Nyce J, et al. Pharmacodynamics, DNA Methylation studies and clinical response of high-dose 1-ß-D-arabinofuranosylcytosine before and after in vivo 5-azacytidine treatment in pediatric patients with refractory acute leukemia. Cancer Chemother Pharmacol. 1989;24:203–10. doi: 10.1007/BF00257619. [DOI] [PubMed] [Google Scholar]
- Avramis VI, Panosyan EH. Pharmacokinetic-pharmacodynamic relationships of asparaginase formulations: the past, the present and recommendations for the future. J Clin Pharmacokinetics. 2005;44:367–93. doi: 10.2165/00003088-200544040-00003. [DOI] [PubMed] [Google Scholar]
- Avramis VI, Sencer S, Periclou AP, et al. A randomized comparison of native Escherichia coli asparaginase and polyethylene glycol conjugated asparaginase for treatment of children with newly diagnosed standard-risk acute lymphoblastic leukemia: a Children’s Cancer Group study. Blood. 2002;99:1986–94. doi: 10.1182/blood.v99.6.1986. [DOI] [PubMed] [Google Scholar]
- Broome JD. Evidence that the L-asparaginase activity of guinea pig serum is responsible for its anti-lymphoma effects. Nature. 1961;191:1114–1115. [Google Scholar]
- Broome JD. Evidence that the L-asparaginase activity of guinea pig serum is responsible for its anti-lymphoma effects. I. Properties of the L-asparaginase of guinea pig serum in relation to those of the anti-lymphoma substance. J Exptl Med. 1963;118:99–120. doi: 10.1084/jem.118.1.99. [DOI] [PMC free article] [PubMed] [Google Scholar]
- Broome JD. Antilymphoma activity of L-asparaginase in vivo: clearance rate of enzyme preparations from guinea pig serum and yeast in relation to their effects on tumor growth. J Natl Cancer Inst. 1965;35:967–74. [PubMed] [Google Scholar]
- Broome JD. L-asparaginase: Discovery and development as a tumor-inhibitory agent. Cancer Treat Rep. 1981;65:111–14. [PubMed] [Google Scholar]
- Burchenal JH, Karnofsky DA. Clinical evaluation of L-asparaginase. Cancer. 1970;25:241–3. doi: 10.1002/1097-0142(197002)25:2<241::aid-cncr2820250202>3.0.co;2-6. [DOI] [PubMed] [Google Scholar]
- Capizzi RL. Asparaginase revisited. Leuk Lymphoma. 1993;10(Suppl):147–50. doi: 10.3109/10428199309149127. [DOI] [PubMed] [Google Scholar]
- Capizzi RL, Holcenberg JS. Asparaginases. In: Holland JF, editor. Cancer Medicine. 2. Philadelphia, PA: Lea, Febiger; 1993. pp. 796–805. [Google Scholar]
- Chabner BA, Loo TL. Enzyme therapy: L-asparaginase. In: Chabner BA, Longo DL, editors. Cancer chemotherapy and biotherapy, principles and practice. Philadelphia, PA: Lippincott-Raven Publishers; 1996. pp. 485–92. Chapter 20. [Google Scholar]
- Ertel IJ, Nesbit ME, Hammond D, et al. Effective dose of L-asparaginase for induction of remission in previously treated children with acute lymphocytic leukemia: a report from Childrens Cancer Study Group. Cancer Res. 1979;39:3893–6. [PubMed] [Google Scholar]
- Gaynon PS. Childhood acute lymphoblastic leukaemia and relapse. Br J Haematol. 2005;131:579–87. doi: 10.1111/j.1365-2141.2005.05773.x. [DOI] [PubMed] [Google Scholar]
- Goody HE, Ellem KA. Nutritional effects on precursor uptake and compartmentalization of intracellular pools in relation to RNA synthesis. Biochim Biophys Acta. 1975;383:30–9. doi: 10.1016/0005-2787(75)90243-9. [DOI] [PubMed] [Google Scholar]
- Hawkins DS, Park JR, Thomson BG, et al. Asparaginase Pharmacokinetics following intensive polyethylene glycol conjugated L-asparaginase (PEG-ASNase) therapy for children with relapsed acute lymphoblastic leukemia. Clin Cancer Res. 2004;10:5335–41. doi: 10.1158/1078-0432.CCR-04-0222. [DOI] [PubMed] [Google Scholar]
- Holcenberg JS, Teller DC. Physical properties of antitumor glutaminase-asparaginase from Pseudomonas 7A. J Biol Chem. 1976;251:5375–80. [PubMed] [Google Scholar]
- Jamieson CH, Ailles LE, Dylla SJ, et al. Granulocyte-macrophage progenitors as candidate leukemic stem cells in blast-crisis CML. N Engl J Med. 2004;351:657–67. doi: 10.1056/NEJMoa040258. [DOI] [PubMed] [Google Scholar]
- Jarrar M, Gaynon PS, Periclou AP, et al. Asparagine depletion after pegylated E. Coli asparaginase treatment and induction outcome in children with acute lymphoblastic leukemia in first bone marrow relapse: A Children’s Cancer Group study (CCG-1941) Pediatr Blood Cancer. 2006;47:141–6. doi: 10.1002/pbc.20713. [DOI] [PubMed] [Google Scholar]
- Khan A, Hill JM. Atopic hypersensitivity to L-asparaginase. Resistance to immunosuppression. Int Arch Allergy Appl Immunol. 1971;40:463–9. doi: 10.1159/000230429. [DOI] [PubMed] [Google Scholar]
- Kidd JG. Regression of transplanted lymphomas induced in vivo by means of normal guinea pig serum. I. Course of transplanted cancers of various kinds in mice and rats given guinea pig serum, horse serum or rabbit serum. J Exptl Med. 1953;98:565–82. doi: 10.1084/jem.98.6.565. [DOI] [PMC free article] [PubMed] [Google Scholar]
- Klug-Albertsen B, Schmiegelow K, Schroder H, et al. Anti-Erwinia asparaginase antibodies during treatment of childhood acute lymphoblastic leukemia and their relationship to outcome: a case-control study. Cancer Chemother Pharmacol. 2002;50:117–20. doi: 10.1007/s00280-002-0466-y. [DOI] [PubMed] [Google Scholar]
- Kurtzberg J, Asselin B, Poplack D, et al. Antibodies to asparaginase alter pharmacokinetics and decrease enzyme activity in patients on asparaginase therapy [abstract] Proceedings of the 34th Annual Meeting of the American Association for Cancer Research. 1993 A1807. [Google Scholar]
- Lubkowski J, Palm GJ, Gilliland GL, et al. Crystal structure and amino acid sequence of Wolinella succinogenes L-asparaginase. Eur J Biochem. 1996;241:201–7. doi: 10.1111/j.1432-1033.1996.0201t.x. [DOI] [PubMed] [Google Scholar]
- McLean SR, Gana-Weisz M, Hartzoulakis B, et al. Imatinib binding and cKIT inhibition is abrogated by the cKIT kinase domain I missense mutation Val654Ala. Mol Cancer Ther. 2005;4:2008–15. doi: 10.1158/1535-7163.MCT-05-0070. [DOI] [PubMed] [Google Scholar]
- Mashburn LT, Wriston JC. Tumor inhibitory effect of L-asparaginase from Escherichia coli. Arch Biocem. 1964;105:451–2. doi: 10.1016/0003-9861(64)90032-3. [DOI] [PubMed] [Google Scholar]
- Novak EK, Philips AW. L-Glutamine as a substrate for L-asparaginase from Serratia marcescens. J Bacteriol. 1974;117:593–600. doi: 10.1128/jb.117.2.593-600.1974. [DOI] [PMC free article] [PubMed] [Google Scholar]
- Oettgen HF, Old LJ, Boyse HA, et al. Inhibition of leukemias in man by L-asparaginase. Cancer Res. 1967;27:2619–31. [PubMed] [Google Scholar]
- Panosyan EH, Grigorian RS, Avramis IA, et al. Deamination of glutamine is a prerequisite for optimal asparagine deamination by asparaginases in vivo (CCG-1961) Anticancer Res. 2004;24:1121–6. [PubMed] [Google Scholar]
- Panosyan E, Avramis IA, Seibel NL, et al. Glutamine (Gln) deamination by asparaginases (ASNases) in children with higher risk acute lymphoblastic leukemia (HR ALL), (CCG-1961 study)[abstract] Blood. 2002;100:759a. nr 3006. [Google Scholar]
- Pui CH, Pei D, Sandlund JT, et al. Risk of adverse events after completion of therapy for childhood acute lymphoblastic leukemia. J Clin Oncol. 2005;23:7936–41. doi: 10.1200/JCO.2004.01.0033. [DOI] [PubMed] [Google Scholar]
- Robak T. Therapy of chronic lymphocytic leukaemia with purine nucleoside analogues: facts and controversies. Drugs Aging. 2005;22:983–1012. doi: 10.2165/00002512-200522120-00002. [DOI] [PubMed] [Google Scholar]
- Schwartz JH, Reeves JY, Broome JD. Two L-asparaginases from E. coli and their action against tumors. Proc Natl Acad Sci U S A. 1966;56:1516–19. doi: 10.1073/pnas.56.5.1516. [DOI] [PMC free article] [PubMed] [Google Scholar]
- Shama G, Bhagwat R, Pai SK, et al. Isolated testicular relapse in acute lymphoblastic leukemia - effective treatment with the modified CCG-112 protocol. Indian J Cancer. 2005;42:65–9. doi: 10.4103/0019-509x.16694. [DOI] [PubMed] [Google Scholar]
- Silverman LB, Gelber RD, Dalton VK, et al. Improved outcome for children with acute lymphoblastic leukemia: results of Dana-Farber Consortium Protocol 91-01. Blood. 2001;97:1211–18. doi: 10.1182/blood.v97.5.1211. [DOI] [PubMed] [Google Scholar]
- Sobin LH, Kidd JG. A metabolic difference between two lines of lymphoma 6C3HED cells in relation to asparagine. Proc Soc Exp Biol Med. 1965;119:325–7. doi: 10.3181/00379727-119-30169. [DOI] [PubMed] [Google Scholar]
- Sobin LH, Kidd JG. The incorporation of l-asparagine-14C by lymphoma 6C3HED cells: its inhibition by guinea pig serum. Cancer Res. 1966a;26:208–11. [PubMed] [Google Scholar]
- Sobin LH, Kidd JG. Alterations in protein and nucleic acid metabolism of lymphoma 6C3HED-og cells in mice given guinea pig serum. J Exp Med. 1966b;123:55–74. doi: 10.1084/jem.123.1.55. [DOI] [PMC free article] [PubMed] [Google Scholar]
- Stern ML, Phillips AW, Gottlieb AJ. Physical properties of L-asparaginase from Serratia marcescens. J Bacteriol. 1976;125:719–27. doi: 10.1128/jb.125.2.719-727.1976. [DOI] [PMC free article] [PubMed] [Google Scholar]
- Wade HE, Elsworth R, Herbert D, et al. A new L-asparaginase with anti-tumor activity. Lancet. 1968;2:776–7. doi: 10.1016/s0140-6736(68)90977-x. [DOI] [PubMed] [Google Scholar]
- Weiss RB. Hypersensitivity reactions to cancer chemotherapy. Semin Oncol. 1982;9:5–12. [PubMed] [Google Scholar]