

Abstract
CYP2B6 has not been as fully characterized at the molecular level as other members of the human cytochrome P450 family. As more widely used in vitro probes for characterizing the involvement of this enzyme in the metabolism of xenobiotics have become available, the number of molecules identified as CYP2B6 substrates has increased. In this study we have analyzed the available kinetic data generated by multiple laboratories with human recombinant expressed CYP2B6 and along with calculated molecular properties derived from the ChemSpider database, we have determined the molecular features that appear to be important for CYP2B6 substrates. In addition we have applied 2D and 3D QSAR methods to generate predictive pharmacophore and 2D models. For 28 molecules with Km data, the molecular weight (mean ± SD) is 253.78±74.03, ACD/logP is 2.68±1.51, LogDpH 5.5 is 1.51±1.43, LogDpH 7.4 is 2.02±1.25, hydrogen bond donor (HBD) count is 0.57 ±0.57, hydrogen bond acceptor (HBA) count is 2.57±1.37, rotatable bonds is 3.50±2.71 and total polar surface area (TPSA) is 27.63±19.42. A second set of 15 molecules without Km data possessed similar mean molecular property values. These properties are comparable to those of a set of 21 molecules used in a previous pharmacophore modeling study (Ekins et al., J Pharmacol Exp Ther 288 (1), 21–29, 1999). Only the LogD and HBD values were statistically significantly different between these different datasets. We have shown that CYP2B6 substrates are generally small hydrophobic molecules that are frequently central nervous system active, which may be important for drug discovery research.
Keywords: ChemSpider, CYP2B6, Descriptors, Properties, QSAR
INTRODUCTION
The cytochrome P450 (CYP) enzymes are ubiquitous with important roles in human xenobiotic metabolism. One of these, CYP2B6 has been virtually ignored by pharmaceutical researchers for many years. CYP2B6 is expressed in hepatic and extra hepatic tissues and it has recently been suggested as a prognostic factor for prostate cancer and may therefore be clinically relevant [1]. Until recently, few selective substrates, inhibitors and monoclonal antibodies were available for analysis of CYP2B6 function [2–4]. However, the improved availability of tools (such as bupropion as a model substrate [5]) enabled more studies that characterized and quantified the involvement of CYP2B6. CYP2B6 has since been shown to have a key role in the metabolism of several important marketed compounds including efavirenz [6] and others [4] (Table 1–3). To date the three-dimensional structure of human CYP2B6 is unknown unlike CYP2C9, CYP2D6 and CYP3A4 [7, 8] although the structure of the rabbit CYP2B4 is also available [9, 10]. Efforts have been made to use available CYP2B6 substrates to predict the key molecular features necessary for interaction with the enzyme. In the years since the first validated pharmacophore and 3D-quantitative structure activity relationship (3D-QSAR) analyses for CYP2B6 indicated the importance of hydrophobic features and at least one hydrogen bond acceptor (HBA) [5], additional QSAR methods and technological developments have been applied to substrates [11, 12] and inhibitors [13]. Homology models have also been developed [11, 14–16] that used CYP2C5 (50% sequence identity with CYP2B6 [16]) and more recently CYP2B4 [12] which has 77% sequence identity with CYP2B6 (Fig 1), generally confirming the substrate pharmacophore models. We are also now acutely aware that there are several genetic polymorphisms in CYP2B6 affecting gene expression and/or enzyme activity which are clinically relevant [17]. Induction of CYP2B6 expression may also occur by activation of the constitutive androstane and pregnane×receptors [18]. Both genetic variation and enzyme induction contribute to the wide variability of CYP2B6 protein levels (~100 fold) and activity previously noted [3, 19].
Table 1.
Molecules with Km (apparent) data derived from recombinant expressed CYP2B6 and molecular property data from ChemSpider.
| Substrate | Km (µM) | Metabolic Reaction | Reference | MW | ACD/logP | LogDpH5.5 | LogDpH7.4 | HBD | HBA | RBN | PSA |
|---|---|---|---|---|---|---|---|---|---|---|---|
| Nevirapine | 834 | Hydroxylation | [54] | 266.30 | 1.50 | 1.48 | 1.5 | 1 | 5 | 1 | 49.33 |
| (R)-methadone | 41 | N-demethylation | [37] | 309.44 | 4.20 | 1.23 | 2.56 | 0 | 2 | 7 | 20.31 |
| (S)-methadone | 21 | N-demethylation | [37] | 309.44 | 4.20 | 1.23 | 2.56 | 0 | 2 | 7 | 20.31 |
| N-methyl,N-propargyl-2-phenylethylamine | 290 | N-demethylation | [55] | 173.25 | 2.61 | 0.68 | 2.28 | 0 | 1 | 4 | 3.24 |
| (+)-fenchone | 180 | Hydroxylation | [56] | 152.23 | 2.13 | 2.13 | 2.13 | 0 | 1 | 0 | 17.07 |
| Endosulfan Alpha | 16.2 | Sulfation | [57] | 406.92 | 3.12 | 3.12 | 3.12 | 0 | 3 | 0 | 54.74 |
| Prasugrel | 2.3 | Ring opening | [58] | 373.44 | 2.87 | 2.85 | 2.87 | 0 | 4 | 6 | 74.85 |
| NNK | 33 | Hydroxylation | [59] | 207.23 | 0.09 | 0.09 | 0.09 | 0 | 5 | 6 | 62.63 |
| (S)-Nicotine | 820 | Hydroxylation | [59] | 162.23 | 0.72 | −2.07 | −0.47 | 0 | 2 | 1 | 16.13 |
| Sertraline | 30.7 | N-demethylation | [60] | 306.23 | 4.81 | 1.77 | 2.77 | 1 | 1 | 2 | 3.24 |
| Meperidine | 356 | N-demethylation | [61] | 247.33 | 2.35 | −0.44 | 1.15 | 0 | 3 | 4 | 29.54 |
| Ethylbenzene | 219 | Hydroxylation | [62] | 106.16 | 3.21 | 3.21 | 3.21 | 0 | 0 | 1 | 0 |
| Verbenone | 91 | Hydroxylation | [63] | 150.22 | 1.97 | 1.97 | 1.97 | 0 | 1 | 0 | 17.07 |
| Efavirenz | 12.4 | Hydroxylation | [6] | 315.67 | 4.84 | 4.84 | 4.84 | 1 | 3 | 1 | 29.54 |
| Carbamazepine | 420 | Hydroxylation (2 sites) | [64] | 236.27 | 2.67 | 2.67 | 2.67 | 2 | 3 | 0 | 23.55 |
| Carbaryl | 11 | Hydroxylation (3 sites) | [65] | 201.22 | 2.40 | 2.4 | 2.4 | 1 | 3 | 2 | 29.54 |
| (S)-Ketamine | 44.4 | N-demethylation | [40] | 237.72 | 2.18 | 1.18 | 2.13 | 1 | 2 | 2 | 20.31 |
| (R)-Ketamine | 74.1 | N-demethylation | [40] | 237.72 | 2.18 | 1.18 | 2.13 | 1 | 2 | 2 | 20.31 |
| LAAM | 17.7 | N-demethylation | [66] | 353.50 | 5.45 | 2.42 | 3.48 | 0 | 3 | 9 | 29.54 |
| Nor-LAAM | 26 | N-demethylation | [66] | 339.47 | 3.76 | 0.67 | 1.11 | 1 | 3 | 9 | 29.54 |
| S-mephobarbital | 264 | N-demethylation | [67] | 246.26 | 1.77 | 1.77 | 1.67 | 1 | 5 | 2 | 57.69 |
| Selegiline | 25 | N-demethylation and depropargylation | [68] | 187.28 | 2.95 | 0.95 | 2.58 | 0 | 1 | 4 | 3.24 |
| (S)-ifosfamide | 900 | Dechloroethylation | [38] | 261.09 | 0.23 | 0.23 | 0.23 | 1 | 4 | 4 | 42.59 |
| (R)-ifosfamide | 500 | Dechloroethylation | [38] | 261.09 | 0.23 | 0.23 | 0.23 | 1 | 4 | 4 | 42.59 |
| Cyclophosphamide | 1400 | Hydroxylation | [69] | 261.09 | 0.23 | 0.23 | 0.23 | 1 | 4 | 5 | 42.59 |
| (R)-fluoxetine | 125 | N-demethylation | [39] | 309.33 | 4.09 | 1 | 1.56 | 1 | 2 | 6 | 12.47 |
| (S)-fluoxetine | 546 | N-demethylation | [39] | 309.33 | 4.09 | 1 | 1.56 | 1 | 2 | 6 | 12.47 |
| Propofol | 10 | Hydroxylation | [70] | 178.27 | 4.16 | 4.16 | 4.16 | 1 | 1 | 3 | 9.23 |
| Mean | 253.78 | 2.68 | 1.51a | 2.02b | 0.57c | 2.57 | 3.50 | 27.63 | |||
| (±SD) | (74.03) | (1.51) | (1.43) | (1.25) | (0.57) | (1.37) | (2.71) | (19.42) | |||
| Mean # | 249.51 | 2.68 | 1.60 | 2.09 | 0.54 | 2.58 | 3.29 | 28.25 | |||
| (±SD) | (78.31) | (1.49) | (1.51) | (1.29) | (0.59) | (1.44) | (2.77) | (20.45) | |||
MW = molecular weight, HBA = hydrogen bond acceptors, HBD = hydrogen bond donors, RBN = rotatable bond number, PSA = polar surface area
after removal of one isomer for compounds fluoxetine, ifosphamide, ketamine and methadone
p < 0.009 t-test (2 tailed) compared with Table 3
p < 0.003 t-test (2 tailed) compared with Table 3
p < 0.005 t-test (2 tailed) compared with Table 3
Table 3.
CYP2B6 substrates from the original pharmacophore and test set [5] with molecular properties calculated with ChemSpider.
| Substrate | Reaction | Km (µM) | MW | ACD/logP | LogDpH5.5 | LogDpH7.4 | HBD | HBA | RBN | PSA | |
|---|---|---|---|---|---|---|---|---|---|---|---|
| Antipyrine | hydroxylation | 17700 | 188.23 | 0.27 | 0.27 | 0.27 | 0 | 3 | 1 | 23.55 | |
| Benzphetamine | N-demethylation | 93.4 | 239.35 | 4.43 | 1.51 | 2.95 | 0 | 1 | 5 | 3.24 | |
| Benzyloxyresorufin | N-demethylation | 1.28 | 303.31 | 3.15 | 3.15 | 3.15 | 0 | 4 | 3 | 47.89 | |
| Cinnarizine | hydroxylation | 17.2 | 368.51 | 4.63 | 3.47 | 4.56 | 0 | 2 | 6 | 6.48 | |
| 4-chloro-7-ethoxycoumarin | O-deethylation | 33.7 | 224.64 | 2.50 | 2.37 | 2.37 | 0 | 3 | 2 | 35.53 | |
| 3-cyano-7-ethoxycoumarin | O-deethylation | 71.3 | 215.20 | 2.00 | 2.51 | 2.51 | 0 | 4 | 2 | 59.32 | |
| Dextromethorphan | N-demethylation | 350 | 271.40 | 4.11 | 1.12 | 2.39 | 0 | 2 | 1 | 12.47 | |
| Diazepam | N-demethylation | 113 | 284.74 | 2.91 | 2.91 | 2.91 | 0 | 3 | 1 | 32.67 | |
| 1,2-Dibromoethane | 2-bromoacetaldehyde formation | 9700 | 187.86 | 2.08 | 2.08 | 2.08 | 0 | 0 | 1 | 0 | |
| 7-ethoxycoumarin | O-deethylation | 115 | 190.19 | 2.31 | 2.31 | 2.31 | 0 | 3 | 2 | 35.53 | |
| 7-ethoxy-4-trifluoromethylcou marin | O-deethylation | 1.7 | 258.19 | 3.41 | 3.42 | 3.42 | 0 | 3 | 2 | 35.53 | |
| Imipramine | N-demethylation | 383 | 280.41 | 4.80 | 1.76 | 2.79 | 0 | 2 | 4 | 6.48 | |
| Midazolam | Hydroxylation | 46.1 | 325.77 | 3.93 | 3.48 | 3.92 | 0 | 3 | 1 | 30.18 | |
| RP73401 | Hydroxylation | 22.5 | 381.25 | 4.27 | 4.27 | 4.27 | 1 | 5 | 5 | 51.66 | |
| S-mephenytoin | N-demethylation | 564 | 218.25 | 1.40 | 1.4 | 1.32 | 1 | 4 | 2 | 40.62 | |
| Testosterone | Hydroxylation | 50.5 | 288.42 | 3.47 | 3.48 | 3.48 | 1 | 2 | 1 | 26.3 | |
| Amitriptyline | N-demethylation | 144.4 | 277.40 | 4.92 | 1.92 | 3.15 | 0 | 1 | 3 | 3.24 | |
| Bupropion | Hydroxylation | 107.5 | 239.74 | 3.47 | 1.82 | 3.27 | 1 | 2 | 4 | 20.31 | |
| Lidocaine | N-deethylation | 537.6 | 234.34 | 2.36 | −0.13 | 1.57 | 1 | 3 | 5 | 23.55 | |
| Verapamil | O-demethylation Dihydroqinghaosu | 137.4 | 454.60 | 3.90 | 0.95 | 2.33 | 0 | 6 | 13 | 63.95 | |
| Arteether | formation | 28 | 312.40 | 3.60 | 3.6 | 3.6 | 0 | 5 | 2 | 46.15 | |
| Mean | 273.53 | 3.23 | 2.27 | 2.79 | 0.24 | 2.90 | 3.14 | 28.79 | |||
| (±SD) | (68.35) | (1.20) | (1.17) | (1.00) | (0.44) | (1.44) | (2.76) | (18.95) | |||
MW = molecular weight, HBA = hydrogen bond acceptors, HBD = hydrogen bond donors, RBN = rotatable bond number, PSA = polar surface area
For references for the original Km data please refer to [5].
Fig. 1.
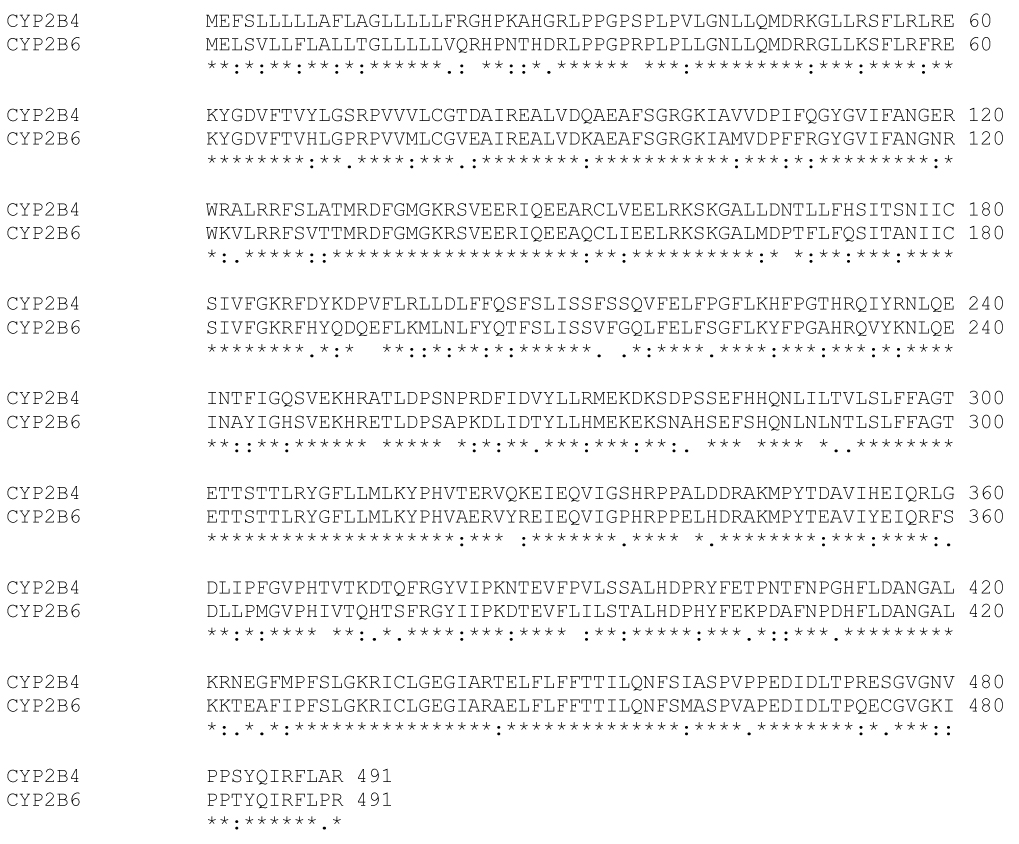
Sequence alignment of CYP2B6 and CYP2B4 (assession numbers P20813 and P00178, respectively) using ClustalW (EMBL-EBI) [84] * = identical in all sequences in the alignment; : = conserved substitutions; . = semi-conserved substitutions.
Since the publication of the original pharmacophore in 1999 [5, 20] a substantial number of studies have indicated the involvement of CYP2B6 in the metabolism of molecules under study. These molecules cover an array of therapeutic classes including anticancer agents, antiviral drugs, antidepressants, and pesticides [21] (Table 1–Table 2). The current study was performed to obtain a more complete picture of the characteristics of CYP2B6 substrates. These substrates themselves can provide insights into the requirements for the enzyme.
Table 2.
Additional CYP2B6 substrates without Km data and their molecular properties calculated with ChemSpider.
| Substrate | Reaction | Reference | MW | ACD/logP | LogDpH5.5 | LogDpH7.4 | HBD | HBA | RBN | PSA | |
|---|---|---|---|---|---|---|---|---|---|---|---|
| Perhexiline | Hydroxylation | [71] | 277.49 | 6.95 | 3.85 | 3.93 | 1 | 1 | 4 | 3.24 | |
| Bergamottin | Hydroxylation and epoxidation | [72] | 338.40 | 5.92 | 5 | 5 | 0 | 4 | 6 | 48.67 | |
| Delta-3-carene | Hydroxylation | [73] | 136.23 | 4.37 | 4.37 | 4.37 | 0 | 0 | 0 | 0 | |
| Chlorpyrifos | Desulphuration | [74] | 350.59 | 4.77 | 4.77 | 4.77 | 0 | 4 | 6 | 82.48 | |
| Diazinon | Desulphuration | [74] | 304.34 | 3.81 | 3.81 | 3.81 | 0 | 5 | 7 | 95.37 | |
| Serotonin | Deamination | [31] | 176.21 | 0.21 | −2.87 | −2.22 | 4 | 3 | 4 | 17.4 | |
| Methoxychlor | O-demethylation and Hydroxylation | [75] | 345.65 | 4.56 | 4.56 | 4.56 | 0 | 2 | 4 | 18.46 | |
| Tamoxifen | Hydroxylation | [76] | 371.51 | 7.88 | 5.04 | 6.58 | 0 | 2 | 8 | 12.47 | |
| ThioTEPA | Desulfuration | [77] | 189.22 | 0.52 | 0.52 | 0.52 | 0 | 3 | 3 | 50.93 | |
| Tramadol | O-demethylation and N-demethylation | [78] | 263.37 | 2.51 | −0.53 | 0.49 | 1 | 3 | 5 | 21.7 | |
| MDE | N-dealkylation | [79] | 283.36 | 2.73 | 0.46 | 1.8 | 1 | 3 | 5 | 21.7 | |
| Artemisinin | Unknown | [80] | 282.33 | 2.27 | 2.27 | 2.27 | 0 | 5 | 0 | 53.99 | |
| DPC963 | Hydroxylation | [81] | 316.23 | 4.09 | 3.38 | 3.21 | 2 | 3 | 1 | 41.13 | |
| Rhazinilam | Hydroxylation | [82] | 294.39 | 5.43 | 5.02 | 5.02 | 1 | 3 | 1 | 25.24 | |
| Mexiletine | N-oxidation | [83] | 179.26 | 2.16 | −0.63 | 0.96 | 2 | 2 | 4 | 12.47 | |
| Mean | 273.91 | 3.88 | 2.60 | 3.00 | 0.80 | 2.87 | 3.87 | 33.68 | |||
| (±SD) | (72.09) | (2.19) | (2.56) | (2.32) | (1.14) | (1.35) | (2.47) | (28.02) | |||
MW = molecular weight, HBA = hydrogen bond acceptors, HBD = hydrogen bond donors, RBN = rotatable bond number, PSA = polar surface area
In the current study we have collated 43 substrates from the literature, 28 with experimentally determined Km data using recombinant expressed CYP2B6 (Table 1) and a further set of 15 without Km data (Table 2). From analysis of the molecular properties of these additional substrates we are able to compare them with those from the original pharmacophore study [5]. In addition we have evaluated several other 2D and 3D-QSAR methods in an attempt to generate new pharmacophores and models for the CYP2B6. These would potentially be useful in enabling selection of molecules for in vitro testing that could be developed as CYP2B6 probe substrates, or, alternatively, assist in avoiding this enzyme. This work builds on our research combining computational and in vitro data analysis to improve the understanding of key molecular properties required by these cytochromes P450 [22] using methods described in an earlier review in this journal [23]. These computational analyses will supplement future efforts in further understanding the role of this enzyme.
MATERIALS AND METHODS
Descriptor data and statistical analysis
A comprehensive literature search was performed to identify molecules with Km data generated with recombinant expressed CYP2B6 that had not been previously included in our prior CYP2B6 QSAR model [5]. In most cases we are aware this data is generated with B-lymphoblastoid cells [5] or supersomes expressing CYP2B6, however, rarely is it mentioned whether cytochrome b5 was added or how much P450 reductase was co-expressed. It was therefore difficult to ensure that all papers used exactly the same experimental reagents and protocol. 2D structures of these 43 molecules (28 substrates with Km data, 15 substrates without Km data) were taken from the ChemSpider database (www.chemspider.com). Molecular weight (MW), ACD/LogP, LogD pH 5.5, LogD pH 7.4, HBA, hydrogen bond donor (HBD), polar surface area (PSA), rotatable bond number and molecular weight (MW) were also obtained from the ChemSpider database. The octanol-water partition coefficient (LogP, also referred to as Kow) is a measure of the propensity of a neutral compound to differentially dissolve in these immiscible phases. The octanol-water distribution coefficient, LogD, reflects the true behavior of an ionizable compound in a solution at a given pH value or range, taking into account all the different ionized species present. This molecular property generation approach was repeated for the 21 molecules from the original CYP2B6 pharmacophore study [5]. The distribution of molecular property data was statistically analyzed with SPSS 14.0 (SPSS Inc. Chicago IL) and mean (±SD) values for molecular descriptors compared with the mean (±SD) data for the 21 molecules using the t-test (2-tailed).
In silico modeling: 2D-QSAR analysis
Forty molecular descriptors were calculated using the QuASAR module in MOE (Chemical Computing Group, Montreal, Canada) for the training and test sets to make up the initial descriptor “pool”. Selection of the most relevant descriptors was achieved by using QuaSAR-Contingency which performs a bivariate contingency analysis for each descriptor and the activity value. Four molecular descriptors with top contingency coefficients were selected to construct a linear model to fit the CYP2B6 data. The training set consisted of 21 CYP2B6 substrates from the original pharmacophore set (Table 3). Partial least squares (PLS) regression was used to determine the parameters of the linear model with all entries being equally weighted.
In silico modeling: Catalyst™
Computational molecular modeling studies were carried out using Catalyst version 4.9 in Discovery Studio version 1.7 (Accelrys, San Diego, CA) running on a Sony Vaio computer with a Pentium processor. Pharmacophore models attempt to describe the arrangement of key features that are important for biological activity. Briefly, the previously generated CYP2B6 Catalyst substrate model [5] was employed to map new molecules after first importing the molecule structures as an sdf file in Catalyst. The 3-D molecular structures were produced using up to 255 conformers with the Best conformer generation method, allowing a maximum energy difference of 20 kcal/mol. A shape was generated around the 7-ethoxy-4-trifluoromethylcoumarin (7-EFC) structure mapped to the original pharmacophore and this was used for further mapping attempts with test molecules.
In silico modeling: Phase™
Computational molecular modeling was also performed with Phase, version 2.0 (Schrödinger, Portland, OR). Activities for all compounds were defined as pKm, where p = −log is in molar units. Phase is a second pharmacophore elucidation and QSAR model building method [24, 25]. Molecules used in the training and test set were first processed in LigPrep, with the protonation states appropriate to pH 7 assigned. Multiple conformers for each molecule were then generated in MacroModel through systematic sampling around rotatable bonds using the UPLS_2005 force field. The default pharmacophore feature definitions were used for assignment of pharmacophore points. Hypotheses were generated by a systematic variation of the number of sites and number of matching active compounds. The scoring in Phase was performed using the default parameters, and the score weighted to include alignment of the inactive compounds also used the default parameters. All hypotheses that were successfully generated and scored were then used to build 3D-QSAR models with 1–3 PLS factors. Statistics on the correlation of predicted versus actual activity were collated for the top ten scoring hypotheses utilizing the default hypothesis scoring functions.
RESULTS
Descriptor data and statistical analysis
A thorough analysis of the literature enabled us to accrue a new database of 28 substrates with Km data for recombinant expressed CYP2B6. Following simple statistical analysis of the data we have observed that these molecules tend to be small (mean MW 253.78±74.03) and hydrophobic (mean ACD/logP 2.68 ±1.51, LogD pH 5.5 is 1.51±1.43, LogD pH 7.4 is 2.02±1.25). The HBA count is 2.57±1.37, the number of rotatable bonds is 3.50±2.71 and the PSA is 27.63±19.42 (Table 1). CYP2B6 substrates also generally appear to be devoid of HBD features with 0.57±0.57 (Table 1). These mean values did not change dramatically upon considering just a single isomer of the four compounds included in the analysis (Table 1), or after focusing only on molecules with Km < 50µM (data not shown). Lower Km molecules tend to be slightly larger with a slightly increased ACD/logP; however there was only a weak correlation between ACD/logP and −logKm (r² = 0.24).
A previously devised QSAR relationship for 16 CYP2B6 substrates [12] used the following equation using Log P generated with Pallas Software System (CompuDrug Ltd., Budapest, Hungary):
| equation 1 |
When equation 1 was used to calculate the −logKm for the 35 substrates not used to build equation 1 and compared with the experimental determined −logKm values the correlation was low (r² = 0.22). The latter observations suggest that this equation may need updating and that it may be difficult to predict an exact Km value using a single property like LogP alone and more complex models may be required for CYP2B6 substrates.
A second set of 15 molecules without published CYP2B6 Km data (to our knowledge) had very similar mean molecular property values to the initial 28 compound set with MW = 273.91±72.09, ACD/logP = 3.88±2.19, LogD pH5.5= 2.60±2.56, LogD pH7.4 = 3.00±2.32, HBD = 0.80±1.14, HBA = 2.87±1.35, rotatable bond number 3.87±2.47 and PSA 33.68±28.02 (Table 2). These data are also remarkably similar to those obtained with the original 21 molecules used in the pharmacophore study [5] in which MW = 273.53±68.35 , ACD/logP = 3.23±1.20, LogD pH5.5 = 2.27±1.17, LogD pH7.4 = 2.79±1.00, HBD = 0.24±0.44, HBA = 2.90±1.44, rotatable bond number 3.14±2.76 and PSA 28.79±18.95 (Table 3). Following t-test analysis comparing the mean values of this original set with the separate sets of 28 and 15 substrates, only the HBD count and the logD values were significantly different for the 28 substrates. All other comparisons did not represent statistically significant differences. Incidentally in all three data sets examined the HBD count mean value is consistently less than 1 and the variability is large, indicating that this molecular property is unlikely to be important for CYP2B6 substrates and this feature may frequently be absent in substrates. Overall statistics (with standard deviations in parentheses) for all the 64 substrates assessed in this study are MW = 264.98 (71.31), ACD/logP = 3.14 (1.65), LogD pH5.5 = 2.01 (1.73), LogD pH7.4 = 2.51 (1.54), HBD = 0.52 (0.73), HBA = 2.75 (1.38), rotatable bond number = 3.47 (2.65), PSA = 29.43 (21.35) and these are similar to the corresponding means in each of the three subsets described above (Fig. 2). The histograms for the data generally show normal distributions for the molecular properties apart from HBD, PSA and RBN which appear skewed or bimodal (Fig. 2).
Fig. 2.
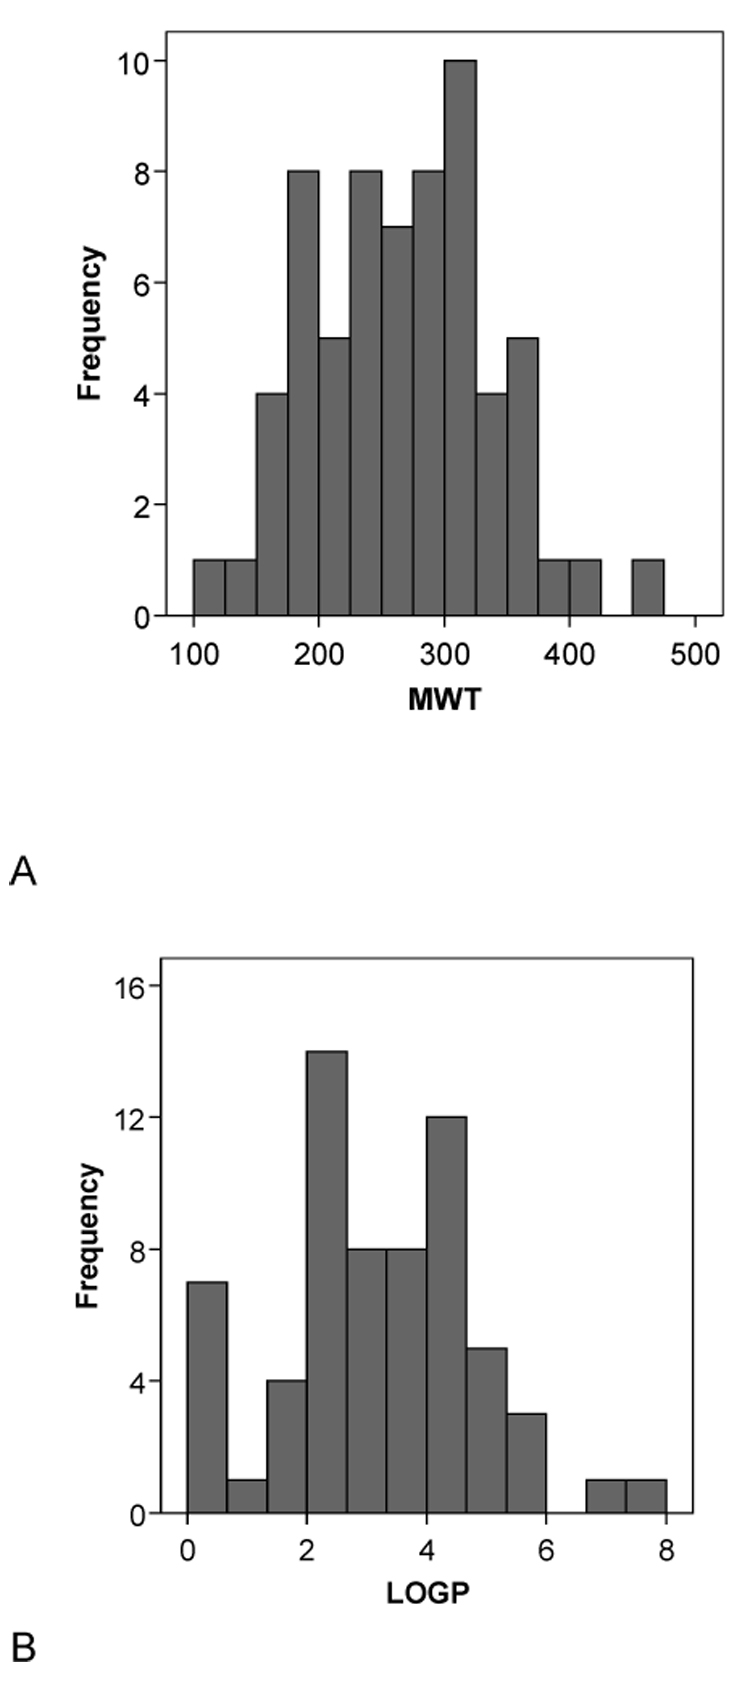
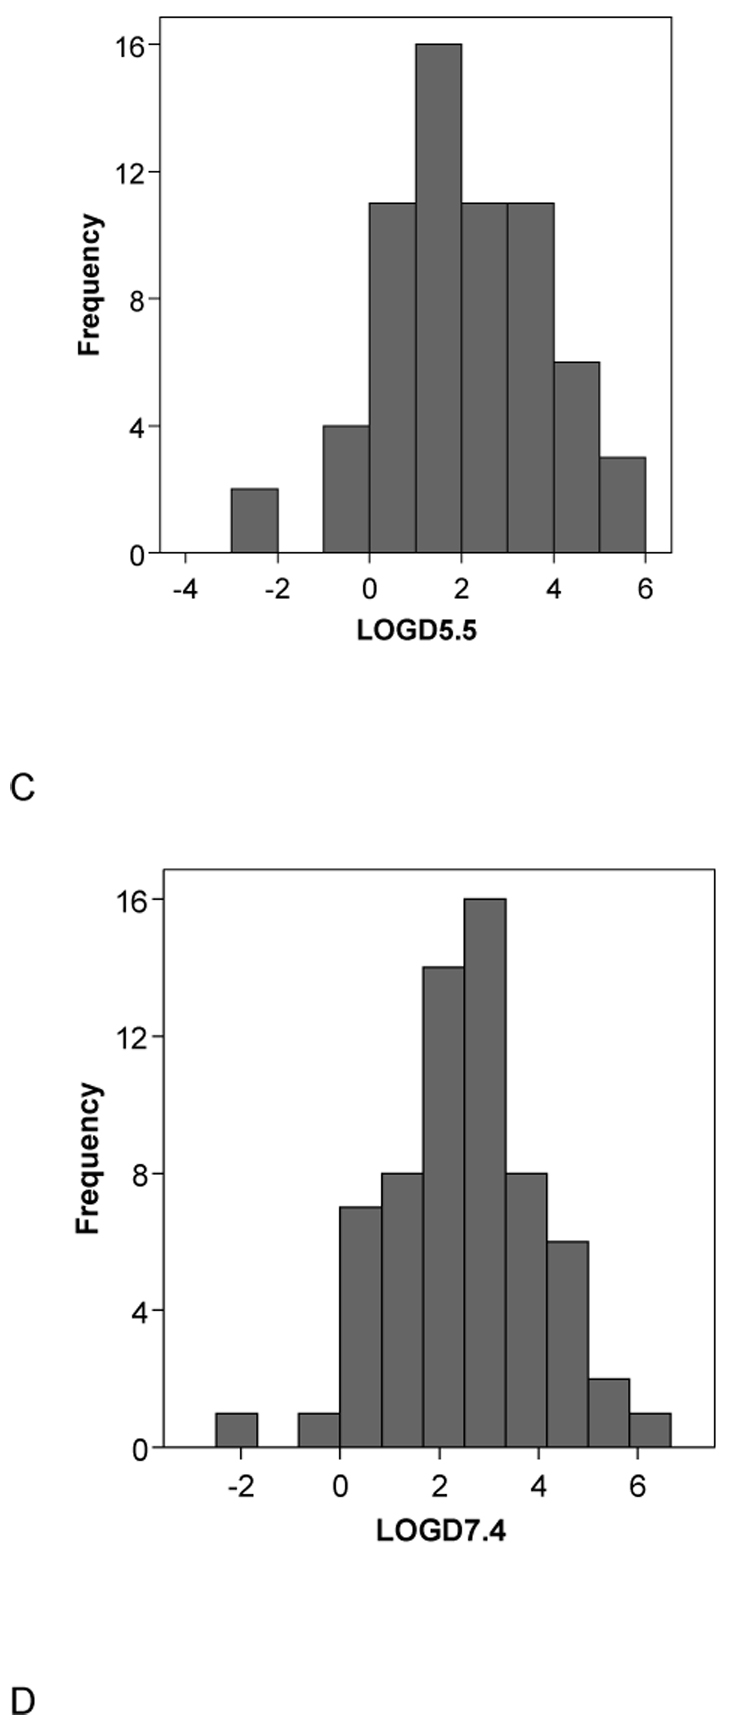
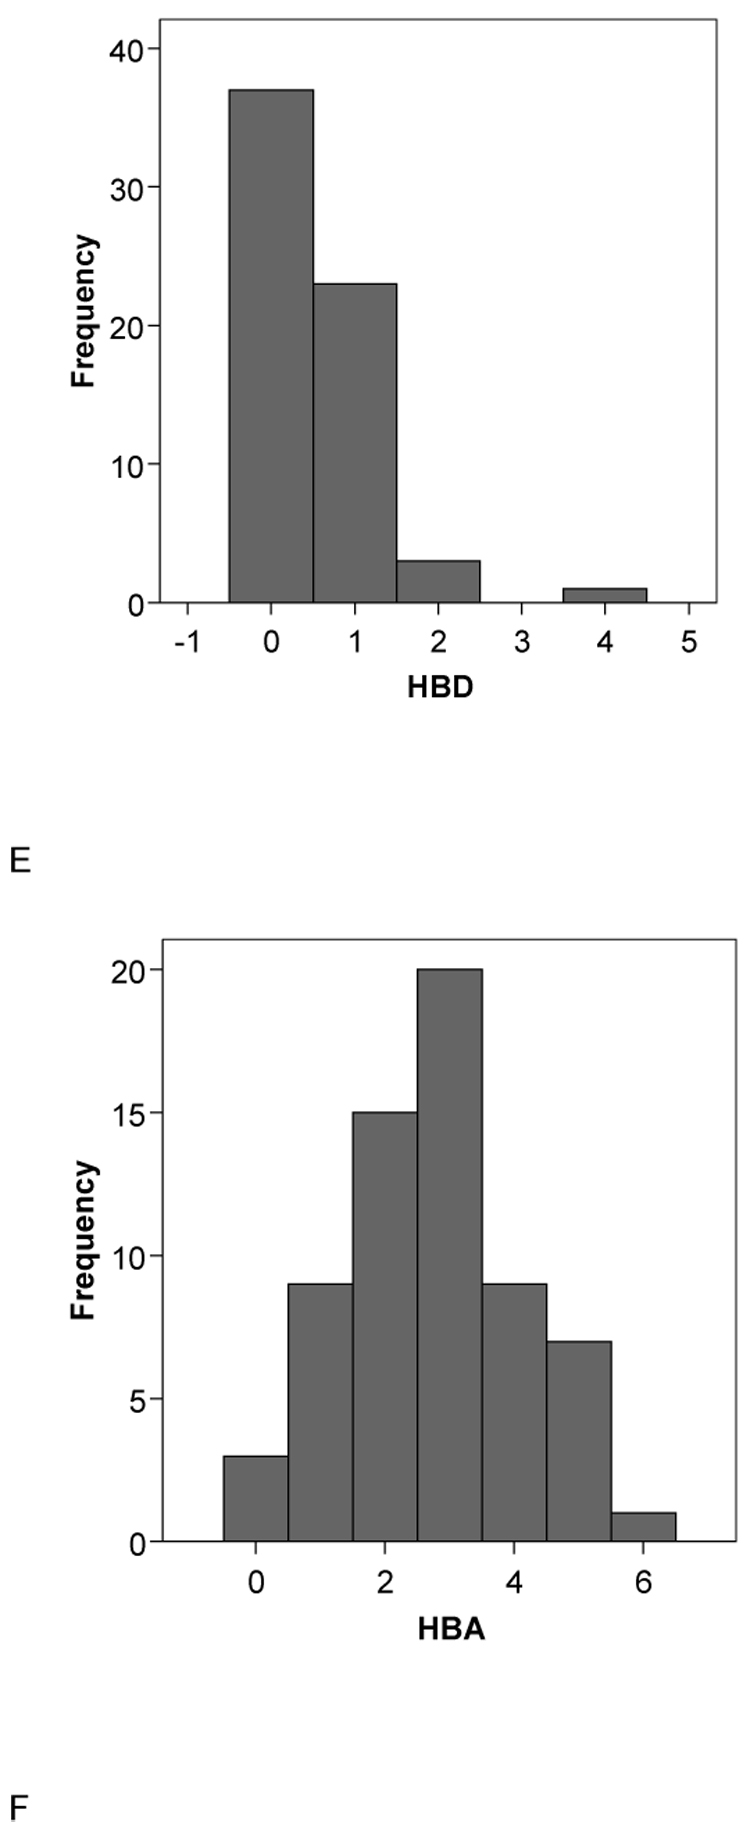
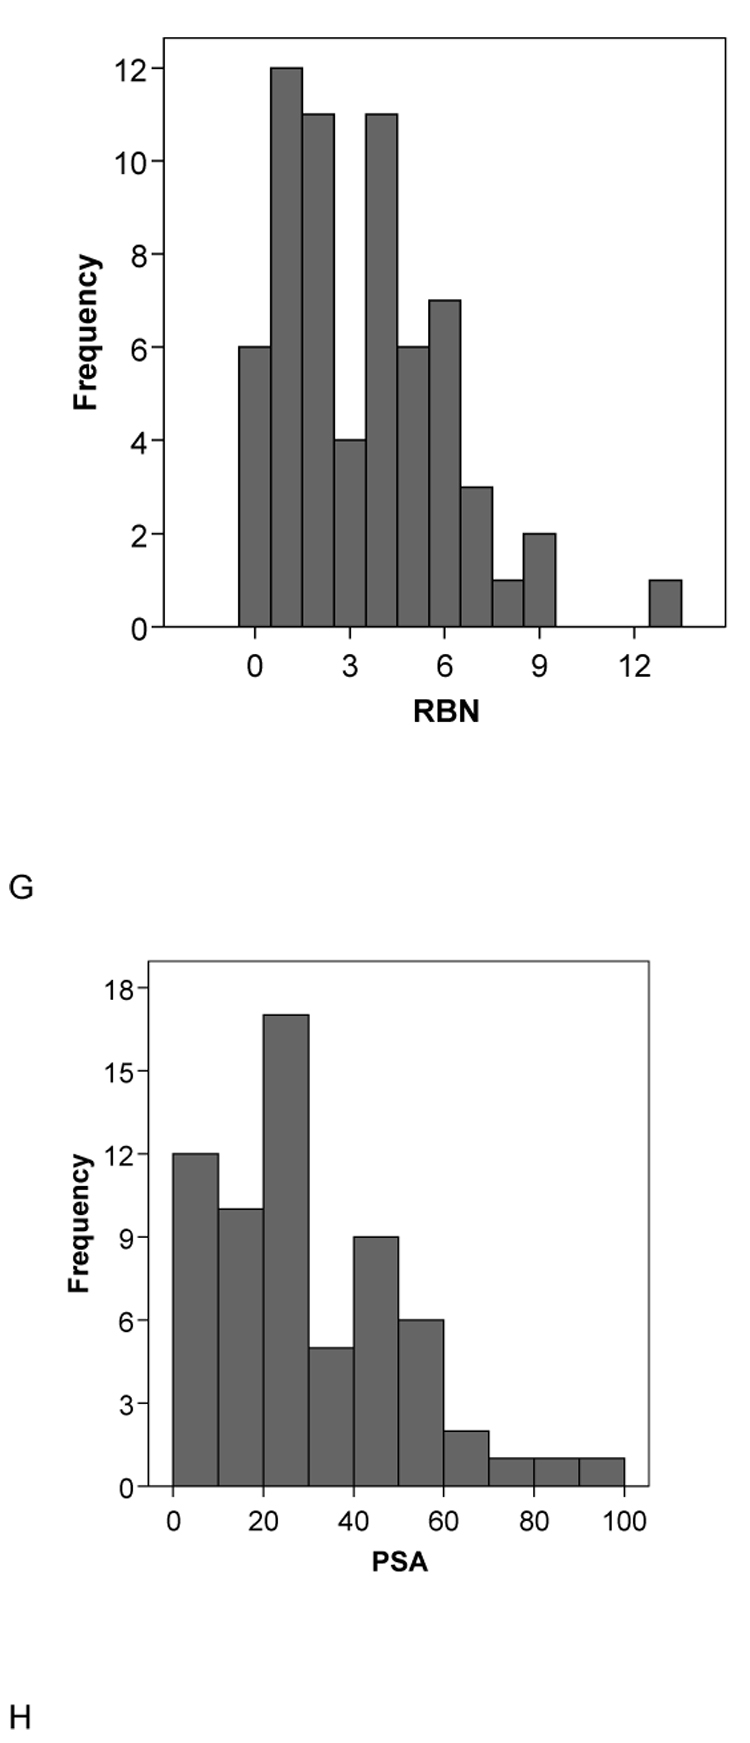
Histograms of the molecular descriptor distributions of all 64 CYP2B6 substrates used in this study. A. Molecular weight (MWT), B. ACD/logP, C. LogD pH5.5, D. LogD pH 7.4, E.hydrogen bond donors (HBD), F. hydrogen bond acceptors (HBA), G. rotatable bond number (RB), H. polar surface area (PSA).
In silico modeling: 2D-QSAR analysis
The QuaSAR module in MOE was used to perform the 2D-QSAR PLS regression analysis on the data set. Four molecular descriptors with top contingency coefficients were picked that fit to the CYP2B6 data. The training set consisted of 21 CYP2B6 substrates from the original pharmacophore set (Table 3). This resulted in a model with the following statistics: N=21, r² = 0.82, cross validated (leave one out) r² = 0.69:
| equation 2 |
Where MW is Molecular weight; logP(o/w) is Octanol/Water partition coefficient; TPSA is Topological Polar Surface Area; logS is Log Solubility in water. The normalized linear model showed the relative importance of the four descriptors in the model to be 1.00 for Weight, 0.94 for logS, 0.65 for logP(o/w) and 0.49 for TPSA. In this linear model, 7-EFC was an outlier, which when omitted improved the model [r² to 0.88 and cross validated (leave one out) r² to 0.73] statistics slightly. Equation 2 was used to predict the 28 test set molecules (Table 4) with r²= 0.396, but significant rank ordering, Spearman’s rho = 0.663 (p = 0.01, two tailed). It should be noted that while all 28 molecules were predicted, cyclophosphamide and its isomers S- and R-Ifosfamide were poorly predicted with the same value (−0.155). This may be related to the calculated LogP (Table 1) or Log S values. One of the limitations using the descriptors in this model is the inability to discriminate between isomers.
Table 4.
Test set prediction using 2D-QSAR model equation 2
| Name | Experimental pKm (M) | Predicted pKm (M) |
|---|---|---|
| Nevirapine | 3.079 | 2.609 |
| R-Methadone | 4.387 | 4.251 |
| S-Methadone | 4.678 | 4.251 |
| N-methyl,N-propargyl-2-phenylethylamine | 3.538 | 2.826 |
| (+)-Fenchone | 3.745 | 2.553 |
| Endosulfan Alpha | 4.790 | 4.910 |
| Prasugrel | 5.638 | 3.706 |
| NNK | 4.481 | 1.465 |
| S-nicotine | 3.086 | 1.325 |
| Sertraline | 4.513 | 5.277 |
| Meperidine | 3.449 | 2.862 |
| Ethylbenzene | 3.660 | 4.235 |
| Verbenone | 4.041 | 3.045 |
| Efavirenz | 4.907 | 5.608 |
| Carbamazepine | 3.377 | 4.709 |
| Carbaryl | 4.959 | 4.536 |
| R-Ketamine | 4.130 | 3.427 |
| S-Ketamine | 4.353 | 3.427 |
| LAAM | 4.752 | 4.622 |
| nor-LAAM | 4.585 | 4.793 |
| S-Mephobarbital | 3.578 | 3.616 |
| Selegiline | 4.602 | 3.153 |
| S-Ifosfamide | 3.046 | −0.155 |
| R-Ifosfamide | 3.301 | −0.155 |
| Cyclophosphamide | 2.854 | −0.155 |
| R-Fluoxetine | 3.903 | 4.291 |
| S-Fluoxetine | 3.263 | 4.291 |
| Propofol | 5.000 | 5.030 |
In silico modeling: Catalyst™
The coordinates of the previously published CYP2B6 pharmacophore have already been described and initially validated with a small test set [5]. Nineteen of the 28 (68%) test set molecules in this study were predicted within a 1 log residual using the rigid fit as performed in the original publication (Table 5). The addition of the 7-EFC shape to the pharmacophore to create a shape/feature hypothesis which was used to classify molecules, retrieved 16 of the 28 molecules (of which 11 were within the 1 log residual (68%)). Therefore this method of filtering the molecules did not appear to improve the percentage within 1 log residual. Also, there was no significant correlation between the log observed and predicted Km data for the test set which indicates that the pharmacophore needs updating in order to quantitatively predict these new molecules. Attempts to do this to date have been unsuccessful. This could be attributable to the different conformer generation method now implemented in Discovery Studio Catalyst compared to the previous version 3.1 used in the original paper, the training set may now be too large or more likely, the data in the training set may represent molecules binding in multiple locations, creating noise which could be detrimental to the pharmacophore construction. This may also make it difficult to ensure predictions with much lower residuals than 1 which would be preferable and more valuable to drug discovery.
Table 5.
Predictions with the original CYP2B6 pharmacophore [5].
| Molecule | Observed Km (µM) | Rigid Fit predicted Km (µM) | Log residual | Shape Mapping |
|---|---|---|---|---|
| Nevirapine | 834 | 129.3 | −0.81 | y |
| (R)- methadone | 41 | 5.3 | −0.89 | |
| (S)- methadone | 21 | 32.7 | 0.19 | |
| N-methyl,N-propargyl-2-phenylethylamine | 290 | 7762.5 | 1.43 | |
| (+)-fenchone | 180 | 295.9 | 0.22 | |
| Endosulfan Alpha | 16.2 | 30 | 0.27 | |
| Prasugrel | 2.3 | 31.2 | 1.13 | |
| NNK | 33 | 30.7 | −0.03 | y |
| (S)-Nicotine | 820 | 150.8 | −0.73 | y |
| Sertraline | 30.7 | 50.2 | 0.21 | y |
| Meperidine | 356 | 6.4 | −1.7 | y |
| Ethylbenzene | 219 | 9045.5 | 1.61 | |
| Verbenone | 91 | 290.84 | 0.50 | |
| Efavirenz | 12.4 | 80.4 | 0.81 | |
| Carbamazepine | 420 | 102.4 | −0.61 | y |
| Carbaryl | 11 | 45.1 | 0.61 | y |
| (S)-Ketamine | 44.4 | 35.8 | −0.09 | y |
| (R)-Ketamine | 74.1 | 34.2 | −0.33 | y |
| LAAM | 17.7 | 1.7 | −1.02 | |
| Nor-LAAM | 26 | 56.9 | 0.34 | |
| S-mephobarbital | 264 | 167.5 | −0.20 | |
| Selegiline | 25 | 28.3 | 0.05 | y |
| (S)-ifosfamide | 900 | 1.2 | −2.87 | y |
| (R)-ifosfamide | 500 | 0.4 | −3.10 | y |
| Cyclophosphamide | 1400 | 36.2 | −1.59 | y |
| (R)-fluoxetine | 125 | 81.3 | −0.19 | y |
| (S)-fluoxetine | 546 | 83.4 | −0.82 | y |
| Propofol | 10 | 561.9 | 1.75 | y |
y = Yes
In silico modeling: Phase™
The Phase 3D-QSAR method is used to search for a common pharmacophore (Similar to the Catalyst HIPHOP approach [26]) within a small set of "actives" and then the remaining molecules should align to this hypothesis for developing the QSAR model. Starting with all the training molecules we were able to obtain a 4-point hypothesis for 6 of the 21 molecules in Table 3. Phase was only able to align 14 of the 21 to the best hypothesis (i.e. only 14 fit at least 3 of the 4 points). Benzphetamine, cinnarizine, dibromoethane, imipramine, testosterone, amitriptyline and bupropion could not be aligned to this pharmacophore. The 14 molecule training set was able to generate a reliable QSAR model with r²= 0.69. This pharmacophore consisted of two HBAs, a hydrophobic feature and an aromatic ring (a second hydrophobic feature). However, the Phase pharmacophore itself was only able to make predictions for 15 of the 28 molecules in Table 1, and the observed versus predicted log Km was not correlated significantly (data not shown).
DISCUSSION
A previous study has suggested that hydrophobicity as commonly measured by calculated logP may be a good predictor for affinity to CYP2B6 [12]. In the current study we found only a weak correlation between predicted −logKm and observed −logKm using the suggested simple QSAR (equation 1). In addition we observed similar weak correlations when relating logP and −logKm, therefore indicating that more complex methods may be necessary to accurately predict affinity for this enzyme, which is generally in line with the models that have been developed for other P450s [27]. Analysis of several other calculated molecular properties did not indicate one with a single correlation that improved upon calculated logP. The ChemSpider database and molecular descriptor calculator used in this study is a freely available tool utilizing widely used and validated property calculators [28]. Other freely available sources of the descriptors used in this study such as XlogP from PubChem and ACD/logP used in this study, had a good correlation with each other (r²= 0.79, data not shown) across all 64 molecules. Similarly, a comparison of all molecular properties calculated by both PubChem and ChemSpider indicated there was no significance difference between them (data not shown). Analysis of the molecular properties for these 64 molecules indicates that overall CYP2B6 is quite selective in the molecular requirements for substrates. For example the majority (~80%) of the 64 CYP2B6 substrates used here are within the molecular weight range of 200–350 and most molecular properties apart from HBD and TPSA and RBN appear to be normally distributed (Fig. 2). Using a 2D-QSAR method with the 21 training set molecules and just 4 molecular descriptors, MW, LogP(o/w), LogS and TPSA, we were able to improve the correlation (r² = 0.82, cross validated (leave one out) r² = 0.69) as well as being able to statistically significantly rank order a test set of 28 molecules. This represents an improvement over an earlier 2D-QSAR model for 16 molecules (equation 1, [12]).
The low PSA of the molecules would suggest most CYP2B6 substrates could cross the Blood Brain Barrier (BBB) [29] and have central nervous system (CNS) effects, though this may be counteracted by potential P-gp affinity of these relatively hydrophobic molecules and both of these properties could be predicted computationally [30]. From the overwhelming weight of evidence now presented, CYP2B6 may therefore have an important role in the metabolism of many CNS active molecules e.g. serotonin [31], methadone, sertraline, meperidine, propofol, mephenytoin, carbamazepine, burproprion, ketamine, nicotine etc., as well as compounds with undesirable CNS effects such as ifosfamide (Table 1). This may represent an area of particular interest to the pharmaceutical industry. A previous study had analyzed various CNS acting classes of drugs in the Comprehensive Medicinal Chemistry (CMC) database and suggested a difference between mean log P for antipsychotic (4.1), antidepressant (3.1) and hypnotic (2.2) groups with a standard deviation of 1.5 [32]. The current study determined a mean ACD/LogP for the 64 molecules of 3.14, which would indicate that antidepressants and hypnotics are most likely to be substrates for CYP2B6. Other members of these classes of compounds could be prioritized for testing using the molecular property criteria developed in this study. This may be clinically relevant as CYP2B6 is expressed in the brain and is inducible [33]. The majority of the 64 metabolic reactions catalyzed were N-demethylation and hydroxylations, although several other reactions were less frequently observed. This information could additionally be useful in generating a probability for CYP2B6 metabolizing a molecule at these corresponding functional groups [34] or building models to predict rate of metabolism [35]. Ultimately models for Vmax, clearance and/or Kcat for this enzyme would also be useful.
As we have previously generated a pharmacophore for 16 CYP2B6 substrates we assessed the mapping of the 28 molecules to the pharmacophore as a further large test set. Although it should be noted that no significant correlation was observed, 68% of molecules were predicted within 1 log unit which was an acceptable (though not ideal) criteria used in the original study. This percentage did not improve with the inclusion of the 7-EFC shape in this study, which would provide a stringent molecular shape/volume for other substrates to fit into (Fig 3A, B). Interestingly all 16 molecules selected fit well within this shape volume, and this may indicate just one potential pharmacophore for these molecules with CYP2B6 as indicated previously using a slightly different training set [11]. The remaining molecules likely fit to another pharmacophore which may correspond with those developed by Wang and Halpert [36]. From the literature analysis we have also observed that several studies have now indicated that CYP2B6 demonstrates stereoselectivity, namely for methadone [37], ifosfamide [38], fluoxetine [39] and ketamine [40] (Table 1). This is in addition to the well known stereoselectivity of S-mephenytoin by CYP2B6 [41]. This would suggest perhaps the further investigation of the stereoisomers of other racemic CYP2B6 substrates as stereoselectivity could be an important component of this enzyme. A recent study with individual isomers of bupropion [42], (previously identified as a CYP2B6 substrate and now a widely used probe reaction [5, 43, 44]) indicated stereoselectivity [Km (R) vs (S), 46µM and 34 µM respectively]. When compared to the racemate with a Km of 107.5µM [45]. The difference between the isomers could be due to the positioning of the terminal methyl which may interfere with the hydrogen bonding interaction at the C=O in R-bupropion, while it is not in this position in S-bupropion. The pharmacophore failed to predict the correct order of the R- and S- methadone and ketamine isomers, but it rank ordered the R- and S- ifosfamide and fluoxetine isomers. This may indicate the need for excluded volumes to more accurately represent the binding site of CYP2B6 possibly guided by the homology model, in order to further improve the predictions. An initial homology model for CYP2B6 did not account for stereoselectivity [36], while a second model took regioselectivity into account for cyclophosphamide and ifosfamide [46] as three pockets were required to be filled for observation of product formation. Our attempts to update the Catalyst models with new data and utilize excluded volumes have been unsuccessful to this point and this could be due to data variability or the inclusion of stereoisomers. We also attempted to use additional 3D-QSAR methods including GALAHAD [47] and a 4D-QSAR method [48] but were also unable to generate a significant model with these software tools, which further indicated the complexity perhaps inherent in this dataset (stereoselectivity and multiple pharmacophores). Our attempts with the pharmacophore software, Phase was partially successful, producing a pharmacophore with 2 hydrogen bonds and 2 hydrophobic areas, using 14 of the 21 training molecules (Fig 3C). This pharmacophore partially overlaps with that of the Catalyst model (Fig 3A, B). However, this Phase model was unable to generate reliable predictions for an external test set measured in terms of a correlation with published observed Km data. Overall, our application of several commercially available 3D-QSAR methods may indicate that this available CYP2B6 Km data is complex and difficult to obtain predictive models with, this may also be partially attributable to the data being derived from different laboratories, using a variety of recombinant expression systems and incubation conditions, factors that may affect observed kinetics in vitro.
Fig. 3.
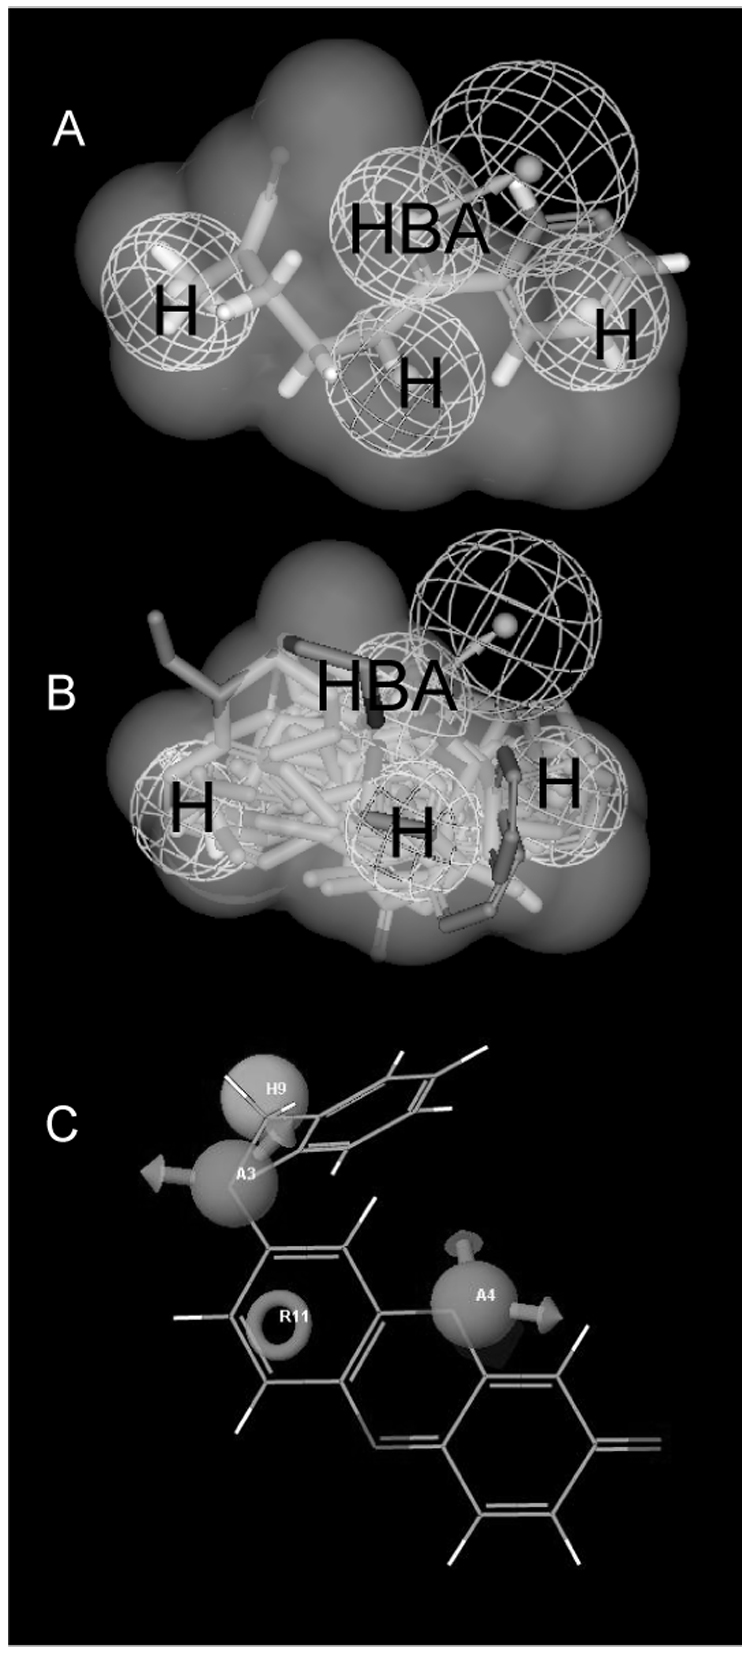
A. NNK mapped to the original CYP2B6 pharmacophore, showing shape volume from 7-EFC. Note N-methyl group on left side is site of α-hydroxylation. H = hydrophobe, NBA = hydrogen bond acceptor B. Mapping of 16 of 28 substrates that conform to the 7-EFC shape. Pharmacophore shows 3 hydrophobic features (H) and one hydrogen bond acceptor (HBA) with vector. C. Phase pharmacophore with benzyloxyresorufin, A = hydrogen bond acceptor (with arrows), H = hydrophobe (sphere), R = ring aromatic (circle).
Interestingly, previously allosteric kinetics were also noted for methadone N-demethylation [37] while several other studies had indicated similar allosteric or autoactivation kinetics with 7-EFC [2], testosterone 16β-hydroxylation [3] and verapamil [4, 5, 49]. From our analysis of the molecules included in Table 1–Table 3, we observed published studies do not generate full kinetic curves (to derive a Km and Vmax) with recombinant expressed CYP2B6, that in turn have significant numbers of observations at the low concentrations in order to pick up the “hook” in an Eadie-Hofstee plot. Sometimes an apparent “hook” on the Eadie-Hofstee plot is missed altogether. Others have demonstrated the role of CYP2B6 in the 8-hydroxylation of efavirenz (Table 1) and noted allosteric kinetics in human liver microsomes (HLM) but not in recombinant expressed CYP2B6 [6]. However, on closer inspection they used more data points at lower concentrations in HLM (14 versus 10 points overall). So it would appear that allosteric characteristics are possibly under-reported for CYP2B6 substrates and this behavior could be reserved for certain molecular structures, or may be due to experimental conditions in vitro. Allosteric kinetics may also be a contributing factor in the difficulty in generating predictive 3D-QSAR models.
Based on the published in vitro and computational models it was previously suggested that the binding site for CYP2B6 may enable either multiple binding modes for a substrate, distinct binding sites or there is substantial conformational change in the binding site upon ligand binding [36, 45, 46], these would all make it quite difficult to come up with a single general model for this enzyme [3] as we have demonstrated in this study. Interestingly, Wang and Halpert developed 2 pharmacophore models that suggested the possibility of 2 overlapping sites, although this was not explicitly mentioned in their discussion [11]. Bathelt et al., also indicated three hydrophobic pockets that may exist in the CYP2B6 homology model binding site [46]. The original CYP2B6 pharmacophore provided a similar conclusion in a hydrophobic binding site [5] (one of the hydrophobic features aligns with the site of metabolism feature [11]) and is almost identical to that of the CYP3A4 autoactivator pharmacophore [50], both containing 3 hydrophobes and a central HBA feature. This in many ways mirrors the observation that some substrates are CYP2B6 or CYP3A4 selective while others have overlapping activity with both enzymes. It would also appear that CYP2B6 is less promiscuous than CYP3A4 [51] based on the narrow range observed for molecular properties determined in this study. In comparison, CYP3A4 substrates range widely in size and other properties with molecules (Km < 10µM) possessing high LogP, RBN [52] compared with weaker substrates (Km > 100µM) having LogP and RBN closer to the CYP2B6 mean values in this current study. This also indicates overlap in the requirements (pharmacophores) for both enzymes which are fulfilled by some substrates (co-substrates) and not others (selective substrates). It could be useful to differentiate these molecules separately (including those from this literature analysis) and use them in future model building. Also, the published CYP2B6 pharmacophore [5] is generally similar to a previously published constitutive androstane receptor (CAR) pharmacophore, suggesting CYP2B6 substrates would appear to have features in common with the ligands that activate the major nuclear hormone receptor that transcriptionally regulates CYP2B6 gene expression [53]. Similarly, the CAR pharmacophore although smaller, partially overlaps with the PXR pharmacophore [53], in agreement with the experimental data with known inducers [18].
The current QSAR and statistical analysis using simple, interpretable molecular properties that are freely available from ChemSpider, PubChem (or other reliable sources of chemistry data on the internet), suggests that 64 molecules (Table 1, Table 2 and Table 3) demonstrating CYP2B6 affinity are to varying degrees hydrophobic, with one or more HBAs, and in good agreement with the properties obtained in previous pharmacophore and QSAR models for CYP2B6. These properties may overlap with those of low affinity CYP3A4 substrates. Attempts to generate a predictive 2D-QSAR model appeared to be more successful than the 3D-QSAR pharmacophores as the 2D-QSAR model was able to rank order the test set molecules. Further computational studies will likely be pursued to construct updated models for CYP2B6 substrates and these findings will be of value for pharmaceutical research to enable prediction of molecule-CYP2B6 interactions from molecular structure alone. The availability of crystal structures for the Rabbit CYP2B4 [9, 10] will also be useful for comparisons with CYP2B6 homology models as well as updating them due to the increased sequence identity (Fig 1). While substrate selectivities for CYP2B6 and CYP2E1 have been compared, to our knowledge we are not aware of a similar comparison between CYP2B6 and CYP2B4 [16]. The generation of a large number of CYP2B6 Km values from a single laboratory and further evaluation of potential for autoactivation may go some way to offset the variability in the published data. It will also be of considerable interest to observe whether the range of property values described in this study holds for future CYP2B6 substrates to be identified.
Acknowledgments
S.E. gratefully acknowledges the helpful discussions and support of Dr. Antony Williams (ChemSpider), Dr. Greg Pearl (ACD/Labs) and Dr. Maggie A.Z. Hupcey. Dr. Shikha Varma (Accelrys, San Diego, CA) is kindly thanked for making Catalyst available. M.I. received support from a University of Pittsburgh Pathology Post-doctoral Research Training Program. M.D.K. is supported by K08-GM074238 from the National Institutes of Health and a Competitive Medical Research Fund (CMRF) grant from the University of Pittsburgh Medical Center. E.D.K. was supported by National Institutes of Health Grants R01DA14211 and K24DA00417.
Abbreviations
- BBB
Blood Brain Barrier
- CAR
constitutive androstane receptor
- PXR
pregnane X-receptor
- QSAR
quantitative structure activity relationship
REFERENCES
- 1.Kumagai J, Fujimura T, Takahashi S, Urano T, Ogushi T, Horie-Inoue K, Ouchi Y, Kitamura T, Muramatsu M, Blumberg B, Inoue S. Prostate. 2007;67:1029–1037. doi: 10.1002/pros.20597. [DOI] [PubMed] [Google Scholar]
- 2.Ekins S, VandenBranden M, Ring BJ, Wrighton SA. Pharmacogenetics. 1997;7:165–179. doi: 10.1097/00008571-199706000-00001. [DOI] [PubMed] [Google Scholar]
- 3.Ekins S, Vandenbranden M, Ring BJ, Gillespie JS, Yang TJ, Gelboin HV, Wrighton SA. J Pharmacol Exp Ther. 1998;286:1253–1259. [PubMed] [Google Scholar]
- 4.Ekins S, Wrighton SA. Drug Metab Rev. 1999;31:719–754. doi: 10.1081/dmr-100101942. [DOI] [PubMed] [Google Scholar]
- 5.Ekins S, Bravi G, Ring BJ, Gillespie TA, Gillespie JS, Vandenbranden M, Wrighton SA, Wikel JH. J Pharmacol Exp Ther. 288:21–29. [PubMed] [Google Scholar]
- 6.Ward BA, Gorski JC, Jones DR, Hall SD, Flockhart DA, Desta Z. J Pharmacol Exp Ther. 2003;306:287–300. doi: 10.1124/jpet.103.049601. [DOI] [PubMed] [Google Scholar]
- 7.Johnson EF, Stout CD. Biochem Biophys Res Commun. 2005;338:331–336. doi: 10.1016/j.bbrc.2005.08.190. [DOI] [PubMed] [Google Scholar]
- 8.Rowland P, Blaney FE, Smyth MG, Jones JJ, Leydon VR, Oxbrow AK, Lewis CJ, Tennant MG, Modi S, Eggleston DS, Chenery RJ, Bridges AM. J Biol Chem. 2006;281:7614–7622. doi: 10.1074/jbc.M511232200. [DOI] [PubMed] [Google Scholar]
- 9.Scott EE, White MA, He YA, Johnson EF, Stout CD, Halpert JR. J Biol Chem. 2004;279:27294–27301. doi: 10.1074/jbc.M403349200. [DOI] [PubMed] [Google Scholar]
- 10.Zhao Y, White MA, Muralidhara BK, Sun L, Halpert JR, Stout CD. J Biol Chem. 2006;281:5973–5981. doi: 10.1074/jbc.M511464200. [DOI] [PubMed] [Google Scholar]
- 11.Wang Q, Halpert JR. Drug Metab Dispos. 2002;30:86–95. doi: 10.1124/dmd.30.1.86. [DOI] [PubMed] [Google Scholar]
- 12.Lewis DF, Lake BG, Ito Y, Anzenbacher P. Drug Metabol Drug Interact. 2006;21:213–231. doi: 10.1515/dmdi.2006.21.3-4.213. [DOI] [PubMed] [Google Scholar]
- 13.Korhonen LE, Turpeinen M, Rahnasto M, Wittekindt C, Poso A, Pelkonen O, Raunio H, Juvonen RO. Br J Pharmacol. 2007;150:932–942. doi: 10.1038/sj.bjp.0707173. [DOI] [PMC free article] [PubMed] [Google Scholar]
- 14.Bathelt C, Schmid RD, Pleiss J. J Mol Model. 8:327–335. doi: 10.1007/s00894-002-0104-y. [DOI] [PubMed] [Google Scholar]
- 15.Domanski TL, Schultz KM, Roussel F, Stevens JC, Halpert JR. Pharmacol Exp Ther. 1999;290:1141–1147. [PubMed] [Google Scholar]
- 16.Spatzenegger M, Liu H, Wang Q, Debarber A, Koop DR, Halpert JR. J Pharmacol Exp Ther. 2003;304:477–487. doi: 10.1124/jpet.102.043323. [DOI] [PubMed] [Google Scholar]
- 17.Lang T, Klein K, Richter T, Zibat A, Kerb R, Eichelbaum M, Schwab M, Zanger UM. J Pharmacol Exp Ther. 2004;311:34–43. doi: 10.1124/jpet.104.068973. [DOI] [PubMed] [Google Scholar]
- 18.Faucette SR, Zhang TC, Moore R, Sueyoshi T, Omiecinski CJ, LeCluyse EL, Negishi M, Wang H. J Pharmacol Exp Ther. 2007;320:72–80. doi: 10.1124/jpet.106.112136. [DOI] [PMC free article] [PubMed] [Google Scholar]
- 19.Code EL, Crespi CL, Penman BW, Gonzalez FJ, Chang TKH, Waxman DJ. Drug Metabolism Disposition. 1997;25:985–992. [PubMed] [Google Scholar]
- 20.Ekins S, Wrighton SA. Drug Metab Rev. 1999;31:719–754. doi: 10.1081/dmr-100101942. [DOI] [PubMed] [Google Scholar]
- 21.Hodgson E, Rose RL. Pharmacol Ther. 2007;113:420–428. doi: 10.1016/j.pharmthera.2006.10.002. [DOI] [PubMed] [Google Scholar]
- 22.Ekins S, de Groot M, Jones JP. Drug Metab Dispos. 2001;29:936–944. [PubMed] [Google Scholar]
- 23.Mankowski DC, Ekins S. Current Drug Metabolism. 2003;4:381–391. doi: 10.2174/1389200033489352. [DOI] [PubMed] [Google Scholar]
- 24.Evans DA, Doman TN, Thorner DA, Bodkin MJ. J Chem Inf Model. 2007;47:1248–1257. doi: 10.1021/ci7000082. [DOI] [PubMed] [Google Scholar]
- 25.Dixon SL, Smondyrev AM, Knoll EH, Rao SN, Shaw DE, Friesner RA. J Comput Aided Mol Des. 2006;20:647–671. doi: 10.1007/s10822-006-9087-6. [DOI] [PubMed] [Google Scholar]
- 26.Clement OO, Mehl AT. HipHop: Pharmacophore based on multiple common-feature alignments. In: Guner OF, editor. Pharmacophore perception, development, and use in drug design. San Diego: IUL; 2000. pp. 69–84. [Google Scholar]
- 27.de Groot MJ, Ekins S. Adv Drug Del Rev. 2002;54:367–383. doi: 10.1016/s0169-409x(02)00009-1. [DOI] [PubMed] [Google Scholar]
- 28.DeWitte RS, Kolovanov E. Predicting molecular physical properties. In: Borchardt RT, Kerns EH, Lipinski CA, Thakker DR, Wang B, editors. Pharmaceutical Profiling in Drug Discovery for Lead Selection. Arlingto, VA: AAPS Press; 2004. pp. 27–52. [Google Scholar]
- 29.Norinder U, Haeberlein M. Adv Drug Del Rev. 2002;54:291–313. doi: 10.1016/s0169-409x(02)00005-4. [DOI] [PubMed] [Google Scholar]
- 30.Ekins S, Ecker GF, Chiba P, Swaan PW. Xenobiotica. 2007;37:1152–1170. doi: 10.1080/00498250701646341. [DOI] [PubMed] [Google Scholar]
- 31.Fradette C, Yamaguchi N, Du Souich P. Br J Pharmacol. 2004;141:407–414. doi: 10.1038/sj.bjp.0705632. [DOI] [PMC free article] [PubMed] [Google Scholar]
- 32.Ghose AK, Viswanadhan VN, Wendoloski JJ. J Comb Chem. 1999;1:55–68. doi: 10.1021/cc9800071. [DOI] [PubMed] [Google Scholar]
- 33.Miksys S, Tyndale RF. J Neural Transm Suppl. 2006:177–180. doi: 10.1007/978-3-211-45295-0_28. [DOI] [PubMed] [Google Scholar]
- 34.Boyer S, Zamora I. J Comp-Aided Mol Des. 2002;16:403–413. doi: 10.1023/a:1020881520931. [DOI] [PubMed] [Google Scholar]
- 35.Balakin KV, Ekins S, Bugrim A, Ivanenkov YA, Korolev D, Nikolsky Y, Ivashchenko AA, Savchuk NP, Nikolskaya T. Drug Metab Dispos. 32:1111–1120. doi: 10.1124/dmd.104.000364. [DOI] [PubMed] [Google Scholar]
- 36.Wang Q, Halpert JR. Drug Metab Dispos. 30:86–95. doi: 10.1124/dmd.30.1.86. [DOI] [PubMed] [Google Scholar]
- 37.Totah RA, Allen KE, Sheffels P, Whittington D, Kharasch ED. J Pharmacol Exp Ther. 2007 doi: 10.1124/jpet.106.117580. [DOI] [PubMed] [Google Scholar]
- 38.Roy P, Tretyakov O, Wright J, Waxman DJ. Drug Metab Dispos. 1999;27:1309–1318. [PubMed] [Google Scholar]
- 39.Margolis JM, O'Donnell JP, Mankowski DC, Ekins S, Obach RS. Drug Metab Dispos. 2000;28:1187–1191. [PubMed] [Google Scholar]
- 40.Hijazi Y, Boulieu R. Drug Metab Dispos. 2002;30:853–858. doi: 10.1124/dmd.30.7.853. [DOI] [PubMed] [Google Scholar]
- 41.Heyn H, White RB, Stevens JC. Drug Metab Dispos. 1996;24:948–954. [PubMed] [Google Scholar]
- 42.Coles R, Kharasch ED. Pharm Res. 2007 doi: 10.1007/s11095-008-9535-1. in press. [DOI] [PMC free article] [PubMed] [Google Scholar]
- 43.Faucette SR, Hawke RL, Lecluyse EL, Shord SS, Yan B, Laethem RM, Lindley CM. Drug Metab Dispos. 2000;28:1222–1230. [PubMed] [Google Scholar]
- 44.Hesse LM, Venkatakrishnan K, Court MH, von Moltke LL, Duan SX, Shader RI, Greenblatt DJ. Drug Metab Dispos. 2000;28:1176–1183. [PubMed] [Google Scholar]
- 45.Ekins S, Bravi G, Ring BJ, Gillespie TA, Gillespie JS, VandenBranden M, Wrighton SA, Wikel JH. J Pharm Exp Ther. 1999;288:21–29. [PubMed] [Google Scholar]
- 46.Barhelt C, Schmid RD, Pleiss J. J Mol Model. 2002;8:327–335. doi: 10.1007/s00894-002-0104-y. [DOI] [PubMed] [Google Scholar]
- 47.Richmond NJ, Abrams CA, Wolohan PR, Abrahamian E, Willett P, Clark RD. J Comput Aided Mol Des. 2006:567–587. doi: 10.1007/s10822-006-9082-y. [DOI] [PubMed] [Google Scholar]
- 48.Klein CDP, Hopfinger AJ. Pharm Res. 1998;15:303–311. doi: 10.1023/a:1011983005813. [DOI] [PubMed] [Google Scholar]
- 49.Ekins S, Ring BJ, Binkley SN, Hall SD, Wrighton SA. Int J Clin Pharmacol Thera. 1998;36:642–651. [PubMed] [Google Scholar]
- 50.Ekins S, Bravi G, Wikel JH, Wrighton SA. J Pharmacol Exp Thera. 1999;291:424–433. [PubMed] [Google Scholar]
- 51.Ekins S. Drug Discovery Today. 2004;9:276–285. doi: 10.1016/S1359-6446(03)03008-3. [DOI] [PubMed] [Google Scholar]
- 52.Balakin KV, Ekins S, Bugrim A, Ivanenkov YA, Korolev D, Nikolsky Y, Skorenko SA, Ivashchenko AA, Savchuk NP, Nikolskaya T. Drug Metab Dispos. 2004;32:1183–1189. doi: 10.1124/dmd.104.000356. [DOI] [PubMed] [Google Scholar]
- 53.Ekins S, Mirny L, Schuetz EG. Pharm Res. 2002;19:1788–1800. doi: 10.1023/a:1021429105173. [DOI] [PubMed] [Google Scholar]
- 54.Erickson DA, Mather G, Trager WF, Levy RH, Keirns JJ. Drug Metab Dispos. 1999;27:1488–1495. [PubMed] [Google Scholar]
- 55.Rittenbach KA, Holt A, Ling L, Shan J, Baker GB. Cell Mol Neurobiol. 2007;27:179–190. doi: 10.1007/s10571-006-9085-1. [DOI] [PMC free article] [PubMed] [Google Scholar]
- 56.Miyazawa M, Gyoubu K. Biol Pharm Bull. 2006;29:2354–2358. doi: 10.1248/bpb.29.2354. [DOI] [PubMed] [Google Scholar]
- 57.Casabar RC, Wallace AD, Hodgson E, Rose RL. Drug Metab Dispos. 2006;34:1779–1785. doi: 10.1124/dmd.106.010199. [DOI] [PubMed] [Google Scholar]
- 58.Rehmel JL, Eckstein JA, Farid NA, Heim JB, Kasper SC, Kurihara A, Wrighton SA, Ring BJ. Drug Metab Dispos. 2006;34:600–607. doi: 10.1124/dmd.105.007989. [DOI] [PubMed] [Google Scholar]
- 59.Dicke KE, Skrlin SM, Murphy SE. Drug Metab Dispos. 2005;33:1760–1764. doi: 10.1124/dmd.105.006718. [DOI] [PubMed] [Google Scholar]
- 60.Kobayashi K, Ishizuka T, Shimada N, Yoshimura Y, Kamijima K, Chiba K. Drug Metab Dispos. 1999;27:763–766. [PubMed] [Google Scholar]
- 61.Ramirez J, Innocenti F, Schuetz EG, Flockhart DA, Relling MV, Santucci R, Ratain MJ. Drug Metab Dispos. 2004;32:930–936. [PubMed] [Google Scholar]
- 62.Sams C, Loizou GD, Cocker J, Lennard MS. Toxicol Lett. 2004;147:253–260. doi: 10.1016/j.toxlet.2003.11.010. [DOI] [PubMed] [Google Scholar]
- 63.Miyazawa M, Sugie A, Shimada T. Drug Metab Dispos. 2003;31:1049–1053. doi: 10.1124/dmd.31.8.1049. [DOI] [PubMed] [Google Scholar]
- 64.Pearce RE, Vakkalagadda GR, Leeder JS. Drug Metab Dispos. 2002;30:1170–1179. doi: 10.1124/dmd.30.11.1170. [DOI] [PubMed] [Google Scholar]
- 65.Tang J, Cao Y, Rose RL, Hodgson E. Chem Biol Interact. 2002;141:229–241. doi: 10.1016/s0009-2797(02)00074-1. [DOI] [PubMed] [Google Scholar]
- 66.Oda Y, Kharasch ED. J Pharmacol Exp Ther. 2001;297:410–422. [PubMed] [Google Scholar]
- 67.Kobayashi K, Abe S, Nakajima M, Shimada N, Tani M, Chiba K, Yamamoto T. Drug Metab Dispos. 1999;27:1429–1433. [PubMed] [Google Scholar]
- 68.Hidestrand M, Oscarson M, Salonen JS, Nyman L, Pelkonen O, Turpeinen M, Ingelman-Sundberg M. Drug Metab Dispos. 2001;29:1480–1484. [PubMed] [Google Scholar]
- 69.Xie HJ, Yasar U, Lundgren S, Griskevicius L, Terelius Y, Hassan M, Rane A. Pharmacogenomics J. 2003;3:53–61. doi: 10.1038/sj.tpj.6500157. [DOI] [PubMed] [Google Scholar]
- 70.Court MH, Duan SX, Hesse LM, Venkatakrishnan K, Greenblatt DJ. Anesthesiology. 2001;94:110–119. doi: 10.1097/00000542-200101000-00021. [DOI] [PubMed] [Google Scholar]
- 71.Davies BJ, Coller JK, Somogyi AA, Milne RW, Sallustio BC. Drug Metab Dispos. 2007;35:128–138. doi: 10.1124/dmd.106.012252. [DOI] [PubMed] [Google Scholar]
- 72.Kent UM, Lin HL, Noon KR, Harris DL, Hollenberg PF. J Pharmacol Exp Ther. 2006;318:992–1005. doi: 10.1124/jpet.105.099887. [DOI] [PubMed] [Google Scholar]
- 73.Duisken M, Benz D, Peiffer TH, Blomeke B, Hollender J. Curr Drug Metab. 2005;6:593–601. doi: 10.2174/138920005774832614. [DOI] [PubMed] [Google Scholar]
- 74.Sams C, Cocker J, Lennard MS. Xenobiotica. 2004;34:861–873. doi: 10.1080/00498250400017273. [DOI] [PubMed] [Google Scholar]
- 75.Hu Y, Kupfer D. Drug Metab Dispos. 2002;30:1035–1042. doi: 10.1124/dmd.30.9.1035. [DOI] [PubMed] [Google Scholar]
- 76.Crewe HK, Notley LM, Wunsch RM, Lennard MS, Gillam EM. Drug Metab Dispos. 2002;30:869–874. doi: 10.1124/dmd.30.8.869. [DOI] [PubMed] [Google Scholar]
- 77.Jacobson PA, Green K, Birnbaum A, Remmel RP. Cancer Chemother Pharmacol. 2002;49:461–467. doi: 10.1007/s00280-002-0453-3. [DOI] [PubMed] [Google Scholar]
- 78.Subrahmanyam V, Renwick AB, Walters DG, Young PJ, Price RJ, Tonelli AP, Lake BG. Drug Metab Dispos. 2001;29:1146–1155. [PubMed] [Google Scholar]
- 79.Kreth K, Kovar K, Schwab M, Zanger UM. Biochem Pharmacol. 2000;59:1563–1571. doi: 10.1016/s0006-2952(00)00284-7. [DOI] [PubMed] [Google Scholar]
- 80.Svensson US, Maki-Jouppila M, Hoffmann KJ, Ashton M. Biopharm Drug Dispos. 24:71–85. doi: 10.1002/bdd.342. [DOI] [PubMed] [Google Scholar]
- 81.Chen H, Chen W, Gan LS, Mutlib AE. Drug Metab Dispos. 2003;31:122–132. doi: 10.1124/dmd.31.1.122. [DOI] [PubMed] [Google Scholar]
- 82.Decor A, Bellocq D, Thoison O, Lekieffre N, Chiaroni A, Ouazzani J, Cresteil T, Gueritte F, Baudoin O. Bioorg Med Chem. 2006;14:1558–1564. doi: 10.1016/j.bmc.2005.10.015. [DOI] [PubMed] [Google Scholar]
- 83.Labbe L, Abolfathi Z, Lessard E, Pakdel H, Beaune P, Turgeon J. Xenobiotica. 2003;33:13–25. doi: 10.1080/0049825021000017948. [DOI] [PubMed] [Google Scholar]
- 84.Higgins D, Thompson J, Gibson T, Thompson J, Higgins D, Gibson T. Nucleic Acids Res. 1994;22:4673–4680. doi: 10.1093/nar/22.22.4673. [DOI] [PMC free article] [PubMed] [Google Scholar]