

Abstract
We report here that melanocortin peptides appear to serve as the mechanism by which weakly electric fish couple socially regulated and stress-regulated brain pathways to unique changes in the intrinsic excitability and action potential waveform of excitable membranes in peripheral cells involved in communication. Gymnotiform electric fish modulate their electric organ discharges (EODs) by reshaping the electric discharges of excitable cells in the periphery. These fish show circadian enhancement of the EOD waveform. They also enhance their EOD waveforms within minutes in response to stressors and changes in the social environment, thus altering the communication value of the signal. Changes in the EOD waveform that occur within minutes result from changes in the discharges of individual electrocytes (μEODs) mediated by the cAMP/protein kinase A (PKA) pathway acting on ion channel kinetics. What activates the cAMP/PKA pathway in electrocytes has not been identified. In vivo injections of the melanocortin peptide adrenocorticotropic hormone (ACTH) increase the amplitude and duration of the electric signal waveform of the gymnotiform Brachyhypopomus pinnicaudatus over the course of 1 h. Applied to single electrocytes in vitro, ACTH increases μEOD amplitude and duration within minutes by differentially modulating the action potentials of the two excitable membranes of the electrocyte and changing the timing of these two spikes. Serotonin modulates the EOD in vivo but has no effect on the μEOD in vitro. The cAMP analog 8-bromo-cAMP mimicked the effects of ACTH, whereas inhibition of PKA by protein kinase A inhibitor 14–22 amide blocked the modulatory effects of ACTH, confirming the role of the cAMP/PKA pathway in μEOD modulation by ACTH.
Keywords: action potential, excitability, plasticity, adrenocorticotropic hormone (ACTH), electric organ, cAMP, stress, social communication, circadian rhythms
Introduction
Weakly electric gymnotiform fish produce electric organ discharges (EODs) for navigation and communication by the simultaneous electric discharges of individual electrocytes (μEODs), resulting from the action potentials (APs) of the excitable membranes of each electrocyte. These fish specialize in the regulation and modulation of their EOD waveforms (for review, see Stoddard et al., 2006), making them ideal models for investigating the development and management of neuroendocrine pathways by which environmental and social conditions modify the intrinsic excitability and AP waveform of excitable cells.
EOD waveforms change across time scales ranging from weeks to milliseconds. At the time-scale extremes, the mechanisms underlying EOD modulations are well understood. Sexual dimorphism in the EOD waveform develops over days to weeks as steroid hormones alter the duration of μEODs, shaping long-duration masculine EODs or shorter feminine EODs in many gymnotiform and mormyrid electric fish (Hagedorn and Carr, 1985; Bass and Volman, 1987; Mills and Zakon, 1991; Dunlap et al., 1997; Silva et al., 1999). Steroid hormones induce these waveform modulations by changing the kinetics of the constituent ionic currents of the μEOD over a similar time scale (Ferrari et al., 1995; Dunlap et al., 1997). At the other extreme, ultra-rapid EOD modulations on the scale of milliseconds occur during courtship and aggressive interactions, a result of direct neural control of AP firing rate in the electric organ (for review, see Zakon et al., 2002).
Occurring on an intermediate time scale of minutes to hours are EOD modulations, including circadian oscillations and EOD enhancements in response to social and environmental changes (Hagedorn and Zelick, 1989; Hagedorn, 1995; Franchina, 1997; Franchina and Stoddard, 1998; Franchina et al., 2001). The neuroendocrine pathways controlling these intermediate time-scale EOD modulations have not yet been well characterized.
We recently have identified some elements of the neuroendocrine pathway controlling intermediate time-scale EOD modulations in Brachyhypopomus pinnicaudatus, a fish with a biphasic EOD produced by electrocytes with two active membranes. Intramuscular injection of serotonin [5-hydroxytryptophan creatinine sulfate complex (5-HT)] increases EOD amplitude and duration in vivo (Stoddard et al., 2003). Additional screening of potential modulators identified the melanocortin peptide adrenocorticotropic hormone (ACTH) as a candidate modulator of EOD and electrocyte AP waveform. ACTH is released by the action of 5-HT in the hypothalamus and pituitary (Brown, 1994), and its levels in circulation show a pronounced circadian rhythm (Nichols and Tyler, 1967). Circulating ACTH levels also are elevated by stress (for review, see Sapolsky, 2002) and social encounters (Lyons et al., 1995; Hoglund et al., 2000), consistent with our findings that stressors and social encounters modulate the EOD within minutes (Franchina et al., 2001; Stoddard et al., 2003).
Here we show that intramuscular ACTH injections increase EOD amplitude and duration within minutes and that ACTH (but not 5-HT) applied to electrocytes in vitro increases μEOD amplitude and duration. These changes in the μEOD result from increasing the interval between its two constituent APs and differential modulation of the two AP waveforms, effects mediated by a cAMP/protein kinase A (PKA) second messenger pathway.
Materials and Methods
Animals. We used mature male B. pinnicaudatus (Hopkins, 1991) from our captive breeding colony, housed and maintained as described previously (Stoddard et al., 2003). Twelve fish were used for in vivo injection experiments, and 36 cells from an additional 28 fish were used for in vitro electrophysiology.
The electric organ of B. pinnicaudatus extends bilaterally from beneath the opercula to the tip of the caudal filament (Fig. 1 A). Electrocytes are organized in parallel rows along the length of the organ (Hopkins et al., 1990). Small sections of the caudal filament can be removed nonlethally for study in vitro. Loss of tail sections is commonplace in the wild, where males often lose their tails to predators or competing males (Hopkins et al., 1990). The tail regenerates within months once a section is severed.
Figure 1.

Recording and analysis of electrocyte μ EODs and APs. A, Structure of electric organ and location of electrocytes within the organ. B, We elicited μ EODs with intracellular current steps and recorded voltage from one intracellular and two extracellular micropipettes. Sequential APs on the innervated posterior face (AP1) and the noninnervated anterior face (AP2) sum to produce the biphasic μEOD. The intracellular micropipette records a typical AP waveform, and the extracellular pipettes record biphasic extracellular potentials. Off-line subtraction of the posterior extracellular record from the intracellular record yields the posterior membrane voltage (Vp; arrow) and AP1, the posterior face action potential. Subtraction of the anterior extracellular record from the intracellular record yields the anterior membrane voltage (Va; arrow) and AP2, the anterior face action potential. Subtraction of the posterior extracellular record from the anterior extracellular record yields the whole-cell voltage (Vw; arrow) and the μEOD. Stim, Stimulus.
Solutions. The normal saline contained the following (in mm): 114 NaCl, 2 KCl, 4 CaCl2 × 2 H2O, 2 MgCl2 × 6 H2O, 2 HEPES, and 6 glucose, pH adjusted to 7.2 with NaOH (modified from Ferrari and Zakon, 1993). We obtained synthetic porcine ACTH, the cell-permeable cAMP analog 8-bromo-cAMP (8-Br-cAMP), and serotonin (5-HT) from Sigma (St. Louis, MO). We purchased myristoylated PKA inhibitor (PKI) 14–22 amide from Calbiochem (La Jolla, CA). Serotonin was dissolved in saline immediately before use at a stock concentration of 3 mm and then diluted to a working concentration at the time of application. All other reagents were dissolved in saline at a stock concentration of 1 mm, stored in single use aliquots at –20°C, and then thawed and diluted in saline to working concentrations immediately before use.
Electrocytes of B. pinnicaudatus are encased in a sheath of tough connective tissue that cannot be penetrated reliably with glass microelectrodes. We therefore pretreated the tissue with a solution of 1% (w/v) collagenase (type IV; Worthington Biochemical, Lakewood, NJ) in saline to weaken the connective tissue surrounding the electrocytes.
EOD recordings and injections in vivo. Our automated system for recording calibrated EODs from freely swimming fish and procedures for injecting fish were described in detail previously (Stoddard et al., 2003). For EOD recordings, the fish were placed in the automated measurement tank, 120 × 44 × 44 cm, that was located in a light- and temperature-controlled room on a 12 h light/dark light cycle. EODs were amplified and digitized from carbon electrodes at opposite ends of the tank only when the fish were centered in the tank. We recorded EODs around the clock at intervals of ∼1 min for several days. After baseline EODs were recorded for ∼24 h, the fish were injected (1 μl/g, i.m.) at midday with 30 μm ACTH in saline or with normal saline as a control condition. EOD recording then continued at least until the next day.
General electrophysiology. We cut short sections (1.0–1.5 cm) of the tail, removed the skin on one side to expose the electric organ, and pinned the tissue in a Sylgard-coated recording chamber (800 μl total volume) containing saline at room temperature (23 ± 1°C). Tissue was taken from fish at midday, when EOD amplitude and duration were at their circadian minima. After the tissue remained for 15 min in normal saline, the bath was replaced with 1% collagenase for 45 min; then the recording chamber was flushed with at least 10 exchanges of normal saline over ∼5 min. The tissue rested an additional 15 min in normal saline before recordings began.
Sharp micropipettes were pulled from thin-walled borosilicate glass to resistances of 0.8–3.0 MΩ. Intracellular pipettes were filled with 3 m KCl. Extracellular pipettes were broken to resistances of 400–600 KΩ and filled with normal saline. The bath ground was a chlorided silver wire inserted in a 1.5 cm section of glass capillary filled with 3% agar in 3 m KCl. The saline level in the recording chamber was adjusted to cover the tissue surface minimally. We controlled the experiment and acquired data at 100 kHz with a Digidata 1322 digitizer and pClamp 8 software (Molecular Devices, Union City, CA). Data were analyzed with custom-developed code and resident functions in Matlab (MathWorks, Natick, MA).
Recording preparation. For in vitro experiments we recorded the electrophysiological activity of single electrocytes, large disc-shaped cells (∼250 μm in width × 800 μm in diameter) innervated at the apex of the posterior membrane (Fig. 1). Both the posterior and anterior face membranes are excitable, and the sequential APs of these two excitable membranes in series produce the μEOD. The posterior face action potential (AP1) is initiated by the nerve, and depolarization of the anterior face by AP1 evokes a second AP on the noninnervated anterior face (AP2). These two APs sum to produce the biphasic μEOD recorded differentially across the entire cell. The single-membrane APs are typical monophasic spikes, whereas the μEOD is a biphasic sinusoid that resembles the EOD.
We recorded AP1, AP2, and the μEOD by using procedures pioneered by Bennett (Bennett and Grundfest, 1959; Bennett, 1961). A depolarizing current step passed through one intracellular pipette initiates the μEOD (Fig. 1 B). A second intracellular pipette records intracellular potential, and two extracellular pipettes placed within 50 μm of the anterior and posterior membranes yield recordings of the extracellular anterior and posterior potentials. Off-line subtraction of the posterior extracellular record from the intracellular record yields AP1, subtraction of the anterior extracellular record from the intracellular record yields AP2, and subtraction of the posterior extracellular record from the anterior extracellular record yields the μEOD.
For intracellular stimulation and recording, we used an Axoclamp 2B amplifier (Molecular Devices) in current-clamp (CC) mode or a WPI Intra767 amplifier (World Precision Instruments, Sarasota, FL) to record intracellular potential, and we delivered stimulation from an isolated stimulator (WPI 360A; World Precision Instruments) via a Neurodata IR183 amplifier (Cygnus Technology, Delaware Water Gap, PA) in breakaway mode. Extracellular recordings were made by using both channels of a Dagan (Minneapolis, MN) TEV200A amplifier in CC mode or two separate extracellular amplifiers (WPI DAM50; World Precision Instruments).
Recording and perfusion. We recorded only from cells with stable resting potentials (Vrest) less than –80 mV. After the placement of all electrodes, depolarizing current steps of 6–8 ms were delivered, and the current magnitude was adjusted manually until the current step reliably elicited the μEOD. Data collection began after the current required to evoke the μEOD became stable. We then elicited μEODs at 60 s intervals for the remainder of the experiment. We measured the electrocyte input resistance just before each μEOD with a 5 ms 100 nA hyperpolarizing current step. During all electrophysiological recording the recording chamber was perfused at a rate of ∼5 ml/h with aerated normal saline or with aerated saline containing one of the test compounds. Solution changes were accomplished during the interstimulus interval by rapidly perfusing 5 ml of the new solution and then slowing perfusion of the new solution to the normal flow rate of 5 ml/h. We first recorded at least 20 min of baseline data in normal saline before changing the solution to one of the test solutions. Saline controls were exposed to continued perfusion of normal saline.
Data treatment. The calibrated EOD recorded in vivo is a biphasic sinusoid (Fig. 2 A) that varies in amplitude and duration, with duration changing primarily in the second phase. We analyzed in vivo EODs as described previously (Stoddard et al., 2003). We measured amplitude peak-to-peak and measured EOD τ as the repolarization time constant of the second phase (P2) by fitting an exponential curve to the P2 repolarization segment from 50% amplitude to 5% amplitude. Exponential curves were fit by the simplex search method with the Matlab function fminsearch (MathWorks), and all fit curves correlated strongly with their source data (r > 0.96). For amplitude and τ, we subtracted circadian changes to reveal the drug-induced changes in these measures as reported previously (Stoddard et al., 2003).
Figure 2.
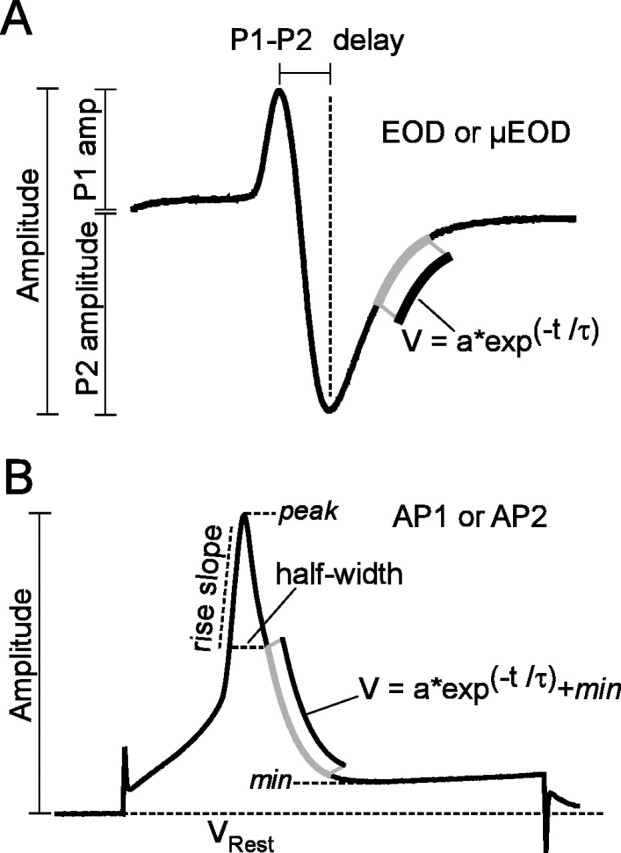
Measures of EOD, μEOD, and transmembrane AP waveform characters. A, Amplitude was measured peak-to-peak for the biphasic EOD andμEOD. P1 amplitude was measured from 0 mV to the peak of P1, and P2 amplitude was measured from 0 mV to the peak of P2. The time constant of P2 repolarization, τ, was estimated by an exponential fit to the repolarization segment of P2, and P1–P2 delay is the time between the P1 and P2 peaks. B, For transmembrane action potentials AP1 and AP2, we measured amplitude from resting potential to peak. Other measures were referenced to the spike amplitude from its maximum (peak) to the minimum potential recorded after the peak (min). Rise slope was measured from 50 to 90% of the min–peak amplitude, and half-width was measured as the spike width in milliseconds at 50% of the min–peak amplitude. The repolarization time constant τ was estimated by exponential fit to the repolarization segment of the spike from 50 to 5% of the min–peak amplitude.
We measured amplitude and τ of μEODs recorded in vitro in the same way as for the EOD in vivo (Fig. 2 A). We also measured the amplitude of the first phase (P1 amplitude), the amplitude of the second phase (P2 amplitude), and the delay between the peaks of P1 and P2 (P1–P2 delay). For the transmembrane potentials, we measured amplitudes of AP1 and AP2 from peak to resting potential (Fig. 2 B). We also measured the repolarization time constant (τ), the spike width at half-amplitude (half-width), and the slope of the rising phase of the AP (rise slope), as shown in Figure 2 B. Finally, we measured the delay between AP1 and AP2 (AP1–AP2 delay) as the interval between the peak of AP1 and the peak of AP2. Graphs and data traces were plotted in Matlab. Averaged data are reported as the mean ± SEM.
Results
ACTH injections in vivo
Just before injection, the baseline measures of EOD amplitude were indistinguishable between the ACTH group (2.25 ± 0.56 μV/cm) and saline controls (1.40 ± 0.54 μV/cm; t = 1.10; df = 10; p > 0.20). Likewise, baseline measures of EOD τ did not differ between the ACTH group (0.29 ± 0.06 ms) and saline controls (0.20 ± 0.02 ms; t = 1.32; df = 10; p > 0.20). Midday injections of ACTH (30 nm/g; n = 6) increased EOD amplitude and τ in free-swimming fish, whereas saline injections (n = 6) caused little or no change in these measures (Fig. 3). Injections of ACTH increased EOD amplitude by 21.9 ± 4.2%, whereas saline injections increased EOD amplitude by only 2.5 ± 0.6%. Similarly, ACTH injections increased EOD τ by 48.7 ± 8.2%, with saline increasing EOD τ by only 11.2 ± 2.5%.
Figure 3.

Injections of ACTH in vivo modulate the EOD waveform within minutes. Calibrated EODs were recorded approximately every 60 s from free-swimming fish and analyzed as described previously (Stoddard et al., 2003). A, Injections of saline caused little or no change in amplitude or duration (τ), whereas injections of ACTH caused rapid transient increases in both amplitude and τ. Insets show EOD waveforms sampled immediately before injection and 30 minafterinjection. B, Injections of ACTH (n = 6) increased both EOD amplitude (t = 4.53; df = 10; p < 0.01) andτ (t = 4.37; df = 10; p < 0.01) when compared with saline injections (n = 6). Circles, horizontal bars, and vertical bars represent individual data points, means, and SEM, respectively.
The effects of ACTH occurred within minutes. After ACTH injection, the time to 50% of peak amplitude rise was 18.0 ± 1.1 min and time to 50% rise in EOD τ was 12.8 ± 1.2 min. The EOD amplitude rise peaked 95 ± 21 min after an injection of ACTH, whereas time-to-peak τ rise was 50 ± 7 min.
ACTH modulation of electrocyte APs in vitro
Application of ACTH in vitro (60 nm; n = 7) caused pronounced changes in the μEOD within 60 min, increasing amplitude, τ, P1 amplitude, P2 amplitude, and P1–P2 delay (Figs. 4, 5). In contrast, saline (n = 5) had no effect on these measures. Application of ACTH also produced waveform changes in AP1 and AP2 but produced different effects in these two action potentials (Fig. 4). Although ACTH increased τ in both AP1 and AP2, it produced a dramatic spike broadening only in AP2. This difference is evident in the raw waveforms and the increased half-width of AP2, but not in AP1 (Fig. 4). The delay between AP1 and AP2 peaks increased in ACTH-treated cells but decreased in saline controls (Fig. 5).
Figure 4.

ACTH modulates the μEOD waveform and differentially modulates the AP1 and AP2 waveforms. A, Representative traces show μEOD, AP1, and AP2 before (solid lines) and after (dashed lines) a 60 min exposure to saline or ACTH. To facilitate comparison, we have shifted ACTH traces horizontally to align these traces to the baseline μEODs and APs. B, Bar plots show the percentage of change caused by a 60 min exposure to saline (open bars) or ACTH (filled gray bars). Vertical black lines on the bars indicate SEM. For each variable, we conducted an omnibus two-way ANOVA with one between-cells factor (ACTH vs saline) and one within-cells factor (baseline vs 60 min). Omnibus tests for all variables except AP1 half-width resulted in significantinteraction terms (α = 0.05). We analyzed the significant interactions with Bonferroni-adjusted (α = 0.0167) pairwise comparisons of the percentage of change over 60 min within saline control cells, the percentage of change over 60 min within ACTH cells, and saline cells at 60 min versus ACTH cells at 60 min. Asterisks within a bar indicate a significant change from baseline to 60 min in that condition. Asterisks over a pair of bars indicate a significant difference between conditions after 60 min. The omnibus tests for AP1 half-width revealed only a slight increase across all cells, with no significant differences within or between conditions.
Figure 5.

ACTH increases AP1–AP2 delayand μEODP1–P2 delay. Input resistance of all cells increases and resting potential in saline controls decreases over 60 min. Bar plots show the percentage of change caused by a 60 min exposure to saline (open bars) or ACTH (filled gray bars). Vertical black lines indicate SEM. For each variable, we conducted an omnibus two-way ANOVA with one between-cells factor (ACTH vs saline) and one within-cells factor (baseline vs 60 min). We analyzed the significant interactions with Bonferroni-adjusted (α = 0.0167) pairwise comparisons of the percentage of change over 60 min within saline control cells, the percentage of change over 60 min within ACTH cells, and saline cells at 60 min versus ACTH cells at 60 min. Asterisks within a bar indicate a significant change from baseline to 60 min in that condition. Asterisks over a pair of bars indicate a significant difference between conditions after 60 min. Delay between AP1 and AP2 peaks increases over a 60 min exposure to ACTH and decreases in saline control cells. Delay between P1 and P2 peaks of theμEOD increased over 60 min only in ACTH-treated cells, whereas saline controls were unchanged. Input resistance of all cells increased during the experiment, with no significant differences between or within conditions. Resting potential decreased only in saline controls.
Both amplitude and rise slope of AP1 and AP2 increased in saline controls, whereas these measures remained unchanged in ACTH-treated cells. These changes in the APs of saline controls may have arisen because input resistance of the electrocytes increased slightly across both conditions, but with no significant differences between conditions (Fig. 5). Resting potentials decreased in saline controls, but not in ACTH-treated cells.
A simplified recording arrangement with a monopolar recording of the μEOD taken from a single pipette near one of the active faces of the electrocyte is more stable over time and more convenient to implement. To evaluate the adequacy of this simplified recording procedure, we correlated amplitude and τ of the differentially recorded μEOD with the same measures of the monopolar recording of the μEOD from the anterior pipette. The mean correlations for all trials within each ACTH-treated cell (seven cells; n > 80 for each cell) showed strong concordance for amplitude (r = 0.996 ± 0.002) and τ (r = 0.898 ± 0.063). Correlations of all recorded trials for both ACTH-treated cells and saline controls (n = 1328) were similarly strong for amplitude (r = 0.916) and τ (r = 0.978), and correlations across cells (n = 12; one trial from each cell) were also robust for amplitude and τ (r = 0.832 and r = 0.968, respectively). Accordingly, for all subsequent experiments reported here, we used monopolar recordings of the μEOD and evaluated changes in amplitude and τ. The tight correlations of the monopolar recordings with the differentially recorded μEODs show that they are sufficient to evaluate relative changes in these measures induced pharmacologically.
Time course and subcellular mechanisms of electrocyte AP modulation
To evaluate the time course and subcellular mechanisms of AP modulation, we exposed electrocytes to additional pharmacological compounds in the same manner as the previous experiments. Because previous studies showed that intramuscular injections of 5-HT increase EOD amplitude and τ in vivo, we compared the effects of ACTH and 5-HT when applied to electrocytes in vitro. Application of 5-HT in vitro (60 μm; n = 4) did not affect μEOD amplitude or τ (Fig. 6), whereas ACTH (60 nm; n = 6) increased amplitude and τ of the μEOD as before.
Figure 6.
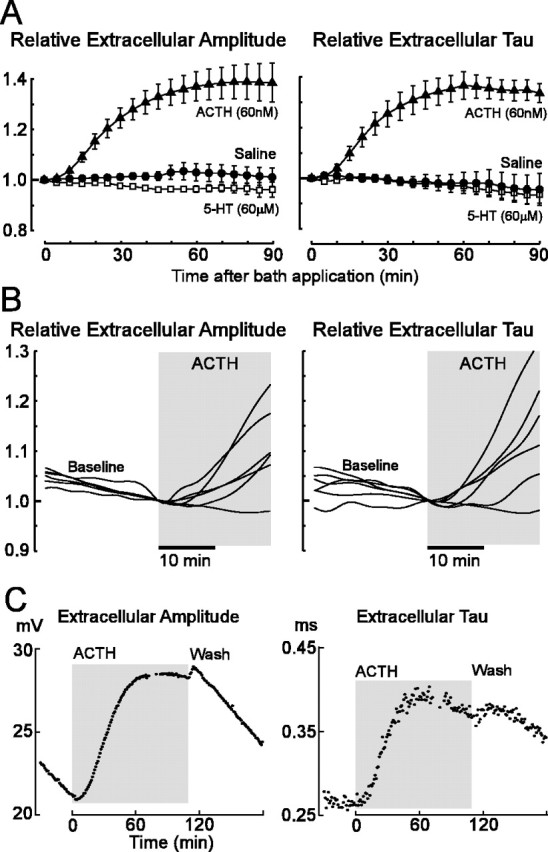
Exposure to 5-HT does not modulate the μEOD waveform of individual electrocytes, whereas the application of ACTH rapidly increasesμEOD amplitude andτ. A, Plots show means (symbols) and SEMs (error bars) of μEOD amplitude and τ during exposure to saline (n = 4), 5-HT (n = 4), and ACTH (n = 6). Values are normalized to those measured just before thebeginningofexposuretoeachcondition. B, Onset of ACTH effects occurs in < 10 min. A 10th order low-pass zero-phase finite impulse response filter with a corner frequency of 0.0025 Hz (Matlab filtfilt construct) was fit to the raw data points to allow the data from six cells to be superimposed. Data are normalized to values at the time of ACTH application. Gray areas highlight the period of ACTH exposure. C, Effects of ACTH are persistent and resistant to washout. μEOD amplitude and τ are shown for one cell exposed to ACTH for nearly 2 h, followed by 70 min of washout.
In vitro application of ACTH modulated the μEOD within 5–10 min in five of six cells (Fig. 6). In a sixth cell, the changes were initiated only after 25 min, but ultimately they reached a peak magnitude comparable with the other cells. Differences between saline (n = 4) and ACTH conditions were evident at 30 min, with ACTH producing marked increases in μEOD amplitude (t = 4.67; df = 8; p < 0.01) and τ (t = 3.967; df = 8; p < 0.01). The effects of ACTH peaked after ∼60–70 min. After ACTH administration, μEOD amplitude reached 50% of its maximum after 26.8 ± 2.0 min (mean ± SEM) and showed a maximum increase of 41 ± 7% after 84 ± 9 min. The μEOD τ rose to 50% of its maximum after 28.3 ± 3.3 min and reached a peak increase of 40 ± 5% after 72 ± 9 min. The effects of ACTH in vitro appear to be long-lasting, even during washout. For one cell that we were able to hold for several hours, amplitude and τ remained near peak levels after almost 2 h of exposure to ACTH (Fig. 6C). These measures did not return to their baseline values even after 70 min of washout with normal saline.
In additional experiments, we examined the subcellular mechanisms of electrocyte μEOD modulation. Melanocortin peptides, including ACTH, initiate their actions via five membrane-bound receptor subtypes, melanocortin receptors 1–5 (MC1R–MC5R). All known melanocortin receptors are coupled positively to adenylate cyclase (AC) and elevate cAMP when activated in other systems (for review, see Hadley and Haskell-Luevano, 1999). Moreover, cAMP activation of PKA increases electrocyte sodium current magnitude and AP amplitude in another gymnotiform fish (McAnelly and Zakon, 1996; McAnelly et al., 2003). We therefore examined whether ACTH modulation of electrocyte μEOD is mediated by a cAMP/PKA signal pathway. Application of the cell-permeable cAMP analog 8-Br-cAMP (3 μm) elicited modulation of electrocyte μEODs (n = 4) that were comparable in magnitude to ACTH-induced modulations (Fig. 7). These results show that cAMP activation is sufficient to increase amplitude and τ of electrocyte μEODs. To test the necessity of PKA activation for μEOD modulations elicited by ACTH, we exposed cells (n = 6) to the cell-permeable myristoylated PKI 14–22 (50 μm) for at least 20 min before switching the recording solution to saline containing ACTH (60 nm) and PKI 14–22 (50 μm). For three of the cells in this condition, PKI 14–22 completely abolished AP modulations by ACTH, whereas the effects of ACTH were strongly attenuated in the other three cells (Fig. 7A shows data from one cell typical of each category). Overall, PKI 14–22 blocked the modulatory effects of ACTH on electrocyte APs (Fig. 7B).
Figure 7.

Electrocyte μEODs are modulated by a cAMP/PKA signaling pathway. A, Saline and 5-HT have no effect on μEOD amplitude and τ, whereas ACTH and the cell-permeable cAMP analog 8-Br-cAMP cause similar increases inμEOD amplitude andτ. ACTH-induced increases in μEOD amplitude and τ are eliminated or attenuated (PKI+ACTH) by pretreatment with myristoylated PKI 14–22, a cell-permeable PKA inhibitor. B, Plots summarizing μEOD amplitude andτ after 60 min of exposure to experimental conditions. Circles, horizontal lines, and vertical lines represent individual cells, means, and SEM, respectively. Conditions marked with the same letter (a or b) are not significantly different from each other. Conditions marked with different letters are statistically different. Omnibus one-way ANOVAs indicate differences among conditions for relative μEOD amplitude (F(4,19) = 8.24; p < 0.001) and relative μEOD τ (F(4,19) = 12.32; p < 0.0001). Post hoc pairwise comparisons were conducted by Fisher's least significant difference (α = 0.05).
Discussion
Intramuscular injections of the melanocortin peptide ACTH modulate within minutes the electric signal of B. pinnicaudatus in vivo. These changes in the EODs of free-swimming fish are similar in time course and magnitude to EOD changes observed in response to 5-HT injections (Stoddard et al., 2003), social interactions (Franchina et al., 2001), and intraspecific aggression (Hagedorn and Zelick, 1989). We showed also that ACTH acts within minutes to modulate the μEOD waveform of individual electrocytes in vitro, where changes in the waveform of the μEOD parallel the EOD waveform changes elicited by in vivo ACTH injections and social interactions. These data suggest that intermediate time-scale modulations of the EOD in vivo occur via modulation of electrocyte μEODs by melanocortin peptides. Serotonin had no effect on μEOD waveform in vitro, suggesting that changes in EOD waveform caused by peripheral injections of 5-HT in vivo (Stoddard et al., 2003) are mediated by downstream mechanisms, possibly the release of melanocortins from the pituitary into circulation (Jorgensen et al., 1998; Hoglund et al., 2000; Rotllant et al., 2000).
The ACTH-induced changes in amplitude and τ of the μEOD ultimately must result from modulation of activity in the two spike-generating membranes of the electrocyte. To understand better how changes in these APs modify the μEOD, we modeled the effects of changes in timing and waveform of AP1 and AP2 (Fig. 8). Our data show that ACTH increases the amplitudes of both phases of the μEOD (P1 and P2) and therefore increases overall μEOD amplitude. These changes, however, cannot be caused by increases in AP1 or AP2 amplitude, because these remain relatively stable during ACTH treatment (Fig. 8A). The increase in P1 amplitude appears to result instead from the observed increase in AP1–AP2 delay. By taking the baseline APs and delaying AP2 by 25 μs, we can model the effects of the increased AP1–AP2 delay in the absence of AP waveform changes, which increases P1 amplitude similar to the effects of ACTH but does not produce a corresponding increase in P2 amplitude or μEOD τ (Fig. 8B). We modeled the effects of AP waveform changes in the absence of changes in AP1–AP2 delay by substituting the ACTH-treated APs for their corresponding baseline APs and aligning the ACTH-treated AP peaks to the baseline AP peaks (Fig. 8C). This model produces increased P2 amplitude and τ, with little change to P1 amplitude, suggesting that increased μEOD τ and P2 amplitude are primarily a function of the broadened AP2 spike width (Fig. 8C). Delaying the ACTH-modified AP2 by 25 μs (Fig. 8D) increases P1 amplitude, P2 amplitude, and τ of the μEOD, similar to the full effects of ACTH. Taken as a whole, these models suggest that ACTH modulates μEOD amplitude and τ by increasing the AP1–AP2 delay and by differentially broadening the AP2 spike.
Figure 8.

ACTH-induced modulations ofμEOD waveform result from changes in the waveform of AP2 and spike timing of AP1 and AP2. Solid lines in all panels indicate baseline recordings of AP1, AP2, andμEOD. A, Actual recordings of AP1, AP2, andμEOD before (solid line) and after (dashed line) a 60 min exposure to ACTH. We inverted AP2 to facilitate evaluation of its contribution to P2 of the μEOD. B, Delay of AP2 by 25 μs is sufficient to increase P1 amplitude. Dashed lines show delayed AP2 and the μEOD resulting from the summing of AP1 and delayed AP2. C, Substituting ACTH-treated AP1 and AP2 for baseline AP1 and AP2 increases the amplitude of μEOD P2 and μEOD τ but does not increase μEOD P1 amplitude. We preserved the interspike timing of the baseline condition by aligning the peaks of ACTH-treated APs to the peaks of their baseline counterparts. Dashed lines indicate ACTH-treated APs and the μEOD resulting from their sum. Note the clear contribution of the broadened AP2 to the increased μEOD τ. D, Substitution of ACTH-treated APs for baseline APs and a delay of the ACTH-treated AP2 by 25 μs increase μEOD τ and amplitudes of P1 and P2. Substitution of ACTH-treated APs for baseline APs was accomplished as in C. These changes are similar to the effects of ACTH shown in A.
ACTH acts via a cAMP/PKA pathway
All five known melanocortin receptors couple to the AC/cAMP signal transduction pathway (Chhajlani and Wikberg, 1992; Mountjoy et al., 1992; Chhajlani et al., 1993; Gantz et al., 1993, 1994; Schioth et al., 1996, 1997; Ringholm et al., 2002). Among teleost fish, some species have the full complement of melanocortin receptors, whereas others have only a subset (Logan et al., 2003). Our experiments confirm that ACTH modulates electrocyte APs via the AC/cAMP/PKA signaling pathway. Exposing electrocytes to 8-Br-cAMP mimicked the effect of ACTH on μEOD amplitude and τ, indicating that cAMP is sufficient to modulate these μEOD parameters. Inhibiting PKA with PKI 14–22 blocked ACTH-elicited modulations, demonstrating that PKA activation is necessary for AP modulation by ACTH. These findings also are consistent with reports that cAMP activation increases AP amplitude and sodium current magnitude in electrocytes of a distantly related gymnotiform fish, Sternopygus macrurus, in which electrocytes have a single active membrane (McAnelly and Zakon, 1996; McAnelly et al., 2003). Additional work is necessary to identify the functional targets through which PKA modulates the μEOD waveform.
We do not know yet which endogenous melanocortins are responsible for EOD modulation in vivo. Only the MC2R is highly selective for ACTH, whereas the other melanocortin receptors respond to ACTH and also to the melanocortin peptides α-melanocyte-stimulating hormone (α-MSH), β-MSH, and γ-MSH with varying affinities (Mountjoy et al., 1992; Hadley and Haskell-Luevano, 1999; Slominski et al., 2000). The melanocortin α-MSH has effects similar to ACTH when applied to electrocytes in vitro (our unpublished observations). Accordingly, any of the melanocortin peptides could be responsible for modulating EOD waveform, and we do not know yet which of the melanocortin receptor isoforms is responsible for μEOD modulation.
The effects of ACTH on electrocyte μEOD amplitude and duration lead to specific predictions and questions concerning the behavioral and neuroendocrine control of EOD signaling. In accordance with the role of melanocortins, especially ACTH and α-MSH, in mediating neuroendocrine stress responses (Slominski et al., 2000), stressful conditions are known to increase rapidly the circulating ACTH and α-MSH levels in teleost fish (Hoglund et al., 2000; Rotllant et al., 2000) and therefore should increase EOD amplitude and duration. Indeed, preliminary data from our laboratory show that mild stressors such as handling and weighing fish increase EOD duration within minutes (Fig. 9).
Figure 9.
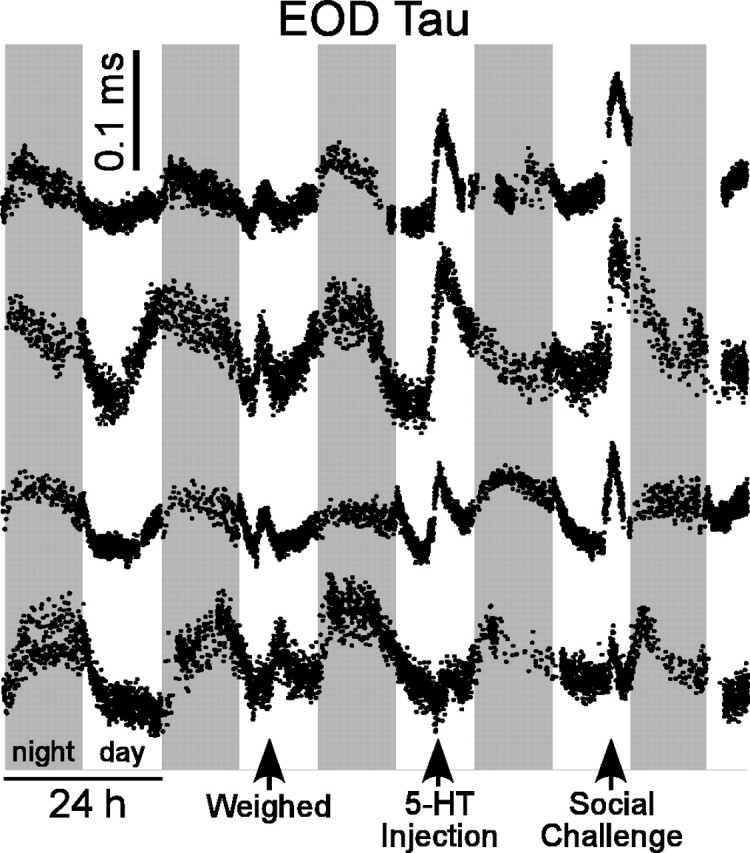
Stress and social encounters rapidly modulate the EOD waveform in vivo. Calibrated EODs were recorded approximately every 60 s from free-swimming fish. Mild stress caused by removing fish from their tanks and weighing them in a small container increased EOD τ in four different female fish. Social challenge by adding a conspecific to the recording tank and injections of 5-HT also increased EOD τ.
Stress-induced increases in ACTH and α-MSH levels of fish often occur in tandem (Hoglund et al., 2000). In some cases, however, the two peptides are released differentially and with different time courses, depending on the type and severity of the stressor (Sumpter et al., 1986; Arends et al., 1999; Rotllant et al., 2000). The sometimes independent activity of ACTH and α-MSH suggests the possibility that multiple endocrine control pathways converge at the electrocyte membrane to modulate its μEOD waveform, thereby modulating the EOD communication signal in a context-specific manner. The value of convergent pathways controlling EOD waveform could be to produce high-amplitude, long-duration EODs only when they are adaptive (i.e., more detectable by conspecifics during social encounters). Such EODs are less adaptive in other circumstances, because they are more detectable by electroreceptive predators (Stoddard, 2002) and are energetically costly to produce (Salazar and Stoddard, 2001). Moreover, males with higher-amplitude, longer-duration EODs do not show better performance than females in object detection tests requiring active electrolocation (Olman, 2001; Stoddard et al., 2006). Key to evaluating the possibility of EOD modulation by convergent pathways will be the continued investigation of the neuroendocrine and biophysical mechanisms controlling EOD waveform. Of particular importance in this regard are questions concerning the central mechanisms and pathways by which specific environmental conditions and events alter emotional state and, in turn, modify communication signals.
That ACTH increases both amplitude and τ of the μEOD in vitro is a bit surprising because the two parameters are somewhat independent in vivo. For instance, amplitude typically begins its nocturnal rise shortly after noon while τ is still in decline (Franchina and Stoddard, 1998). This disparity might suggest that the two parameters show different intracellular kinetics. We also saw instances in vivo in which circadian amplitude cycles are virtually absent while τ continues to oscillate. The contradiction between these results implies differential control by an additional humoral potentiator, possibly a steroid. Preliminary data suggest this potentiator may be a slow-acting androgen (S. Allee and P. K. Stoddard, unpublished observations).
The independent modulation of AP waveform in the two excitable membranes of single electrocytes presents a number of biophysical questions requiring additional research. Additional questions concern the regulation of μEOD amplitude by modifying the timing of the two spikes that generate the μEOD. These phenomena could be attributable to changes in passive or active properties of the excitable membranes or some combination of the two. The observed changes in the AP waveforms likely result from changes in kinetics or magnitude of sodium and/or potassium conductances. Critical questions to be addressed, then, are which ionic conductances contribute to AP1 and AP2 and how these conductances are modified to produce changes in the individual APs and the μEOD. Such investigations promise to inform our understanding of intrinsic plasticity in excitable cells, which, in electrocytes, includes plasticity of spike waveform. Finally, because both spike waveform and spike-timing modulations underlie modulation of the μEOD, the coregulation of these plasticity mechanisms merits additional investigation.
Interestingly, modulation patterns in B. pinnicaudatus are somewhat different from those found in the gymnotiform S. macrurus, the electrocytes of which have only one active membrane and respond to melanocortins with an increase in AP amplitude only (M. R. Markham, H. Zakon, and L. McAnelly, unpublished observations). That these two gymnotiforms differ in which EOD parameters are modulated by melanocortins suggests significant family-level differences in the PKA regulation of voltage-gated ion channels. The great diversity of sodium channels (Lopreato et al., 2001), potassium channels (Few and Zakon, 2003) and channel-regulation mechanisms (McAnelly and Zakon, 2000) in the electric organ of gymnotiform electric fish promises to be a rich source of fundamental information on posttranslational modulation and regulation of voltage-gated ion channels, a topic of clear biomedical importance (Stoddard et al., 2006).
Footnotes
Financial support and equipment were provided by National Institutes of Health Grants K01MH064550 (M.R.M.) and Minority Biomedical Research Support GM08205 (P.K.S.). P.K.S. and M.R.M. designed, built, and programmed the automated EOD recording system (the EOD Machine). P.K.S., M.R.M., Vielka Salazar, Susan Allee, and Susan Pasquale screened neurohormones for 2 years to identify melanocortin activity in vivo. M.R.M. performed and analyzed subsequent in vitro electrophysiology experiments. Susan Allee collected the data presented in Figure 9. We thank Carrie Haskell-Luevano for advice about and contributions to a previous version of this manuscript. In addition, we thank Maikel Couto and Ronald Couto for upkeep of the fish colony and Vance Hodge for advice and solution preparation. Andy Bass, Mike Bennett, Mike Ferrari, Peter Moller, Luke Remage-Healey, Cliff Summers, Harold Zakon, and two anonymous reviewers provided helpful comments on previous versions of this manuscript.
Experiments were approved in advance by the Florida International University Institutional Animal Care and Use Committee and complied with the Principles of Animal Care (publication 86-23, revised in 1985) of the National Institutes of Health.
Correspondence should be addressed to Michael R. Markham at the above address. E-mail: markham@fiu.edu.
DOI:10.1523/JNEUROSCI.2809-05.2005
Copyright © 2005 Society for Neuroscience 0270-6474/05/258746-09$15.00/0
References
- Arends RJ, Mancera JM, Munoz JL, Wendelaar Bonga SE, Flik G (1999) The stress response of the gilthead sea bream (Sparus aurata L.) to air exposure and confinement. J Endocrinol 163: 149–157. [DOI] [PubMed] [Google Scholar]
- Bass AH, Volman SF (1987) From behavior to membranes: testosterone-induced changes in action potential duration in electric organs. Proc Natl Acad Sci USA 84: 9295–9298. [DOI] [PMC free article] [PubMed] [Google Scholar]
- Bennett MVL (1961) Modes of operation of electric organs. Ann NY Acad Sci 94: 458–509. [Google Scholar]
- Bennett MVL, Grundfest H (1959) Electrophysiology of electric organ in Gymnotus carapo J Gen Physiol 42: 1067–1104. [DOI] [PMC free article] [PubMed] [Google Scholar]
- Brown RE (1994) An introduction to neuroendocrinology. New York: Cambridge UP.
- Chhajlani V, Wikberg JE (1992) Molecular cloning and expression of the human melanocyte-stimulating hormone receptor cDNA. FEBS Lett 309: 417–420. [DOI] [PubMed] [Google Scholar]
- Chhajlani V, Muceniece R, Wikberg JE (1993) Molecular cloning of a novel human melanocortin receptor. Biochem Biophys Res Commun 195: 866–873. [DOI] [PubMed] [Google Scholar]
- Dunlap KD, McAnelly ML, Zakon HH (1997) Estrogen modifies an electrocommunication signal by altering the electrocyte sodium current in an electric fish, Sternopygus J Neurosci 17: 2869–2875. [DOI] [PMC free article] [PubMed] [Google Scholar]
- Ferrari MB, Zakon HH (1993) Conductances contributing to the action potential of Sternopygus electrocytes. J Comp Physiol A Neuroethol Sens Neural Behav Physiol 173: 281–292. [DOI] [PubMed] [Google Scholar]
- Ferrari MB, McAnelly ML, Zakon HH (1995) Individual variation in and androgen modulation of the sodium current in electric organ. J Neurosci 15: 4023–4032. [DOI] [PMC free article] [PubMed] [Google Scholar]
- Few WP, Zakon H (2003) Hormonal regulation of KV1 potassium channel expression in the electric organ. Soc Neurosci Abstr 29: 899.9. [DOI] [PubMed] [Google Scholar]
- Franchina CR (1997) Ontogeny of the electric organ discharge and the electric organ in the weakly electric pulse fish Brachyhypopomus pinnicaudatus (Hypopomidae, Gymnotiformes). J Comp Physiol A Neuroethol Sens Neural Behav Physiol 181: 111–119. [DOI] [PubMed] [Google Scholar]
- Franchina CR, Stoddard PK (1998) Plasticity of the electric organ discharge waveform of the electric fish Brachyhypopomus pinnicaudatus I. Quantification of day–night changes. J Comp Physiol A Neuroethol Sens Neural Behav Physiol 183: 759–768. [DOI] [PubMed] [Google Scholar]
- Franchina CR, Salazar VL, Volmar CH, Stoddard PK (2001) Plasticity of the electric organ discharge waveform of male Brachyhypopomus pinnicaudatus II. Social effects. J Comp Physiol A Neuroethol Sens Neural Behav Physiol 187: 45–52. [DOI] [PubMed] [Google Scholar]
- Gantz I, Miwa H, Konda Y, Shimoto Y, Tashiro T, Watson SJ, DelValle J, Yamada T (1993) Molecular cloning, expression, and gene localization of a fourth melanocortin receptor. J Biol Chem 268: 15174–15179. [PubMed] [Google Scholar]
- Gantz I, Shimoto Y, Konda Y, Miwa H, Dickinson CJ, Yamada T (1994) Molecular cloning, expression, and characterization of a fifth melanocortin receptor. Biochem Biophys Res Commun 200: 1214–1220. [DOI] [PubMed] [Google Scholar]
- Hadley ME, Haskell-Luevano C (1999) The proopiomelanocortin system. Ann NY Acad Sci 885: 1–21. [DOI] [PubMed] [Google Scholar]
- Hagedorn M (1995) The electric fish Hypopomus occidentalis can rapidly modulate the amplitude and duration of its electric organ discharges. Anim Behav 49: 1409–1413. [Google Scholar]
- Hagedorn M, Carr C (1985) Single electrocytes produce a sexually dimorphic signal in South American electric fish, Hypopomus occidentalis (Gymnotiformes, Hypopomidae). J Comp Physiol A Neuroethol Sens Neural Behav Physiol 156: 511–523. [Google Scholar]
- Hagedorn M, Zelick R (1989) Relative dominance among males is expressed in the electric organ discharge characteristics of a weakly electric fish. Anim Behav 38: 520–525. [Google Scholar]
- Hoglund E, Balm PH, Winberg S (2000) Skin darkening, a potential social signal in subordinate arctic charr (Salvelinus alpinus): the regulatory role of brain monoamines and pro-opiomelanocortin-derived peptides. J Exp Biol 203: 1711–1721. [DOI] [PubMed] [Google Scholar]
- Hopkins CD (1991) Hypopomus pinnicaudatus (Hypopomidae) a new species of gymnotiform fish from French Guiana. Copeia 1991: 151–161. [Google Scholar]
- Hopkins CD, Comfort NC, Bastian J, Bass AH (1990) Functional analysis of sexual dimorphism in an electric fish, Hypopomus pinnicaudatus, order Gymnotiformes. Brain Behav Evol 35: 350–367. [DOI] [PubMed] [Google Scholar]
- Jorgensen H, Knigge U, Kjaer A, Vadsholt T, Warberg J (1998) Serotonergic involvement in stress-induced ACTH release. Brain Res 811: 10–20. [DOI] [PubMed] [Google Scholar]
- Logan DW, Bryson-Richardson RJ, Taylor MS, Currie P, Jackson IJ (2003) Sequence characterization of teleost fish melanocortin receptors. Ann NY Acad Sci 994: 319–330. [DOI] [PubMed] [Google Scholar]
- Lopreato GF, Lu Y, Southwell A, Atkinson NS, Hillis DM, Wilcox TP, Zakon HH (2001) Evolution and divergence of sodium channel genes in vertebrates. Proc Natl Acad Sci USA 98: 7588–7592. [DOI] [PMC free article] [PubMed] [Google Scholar]
- Lyons DM, Ha CM, Levine S (1995) Social effects and circadian rhythms in squirrel monkey pituitary–adrenal activity. Horm Behav 29: 177–190. [DOI] [PubMed] [Google Scholar]
- McAnelly L, Zakon HH (1996) Protein kinase A activation increases sodium current magnitude in the electric organ of Sternopygus J Neurosci 16: 4383–4388. [DOI] [PMC free article] [PubMed] [Google Scholar]
- McAnelly L, Silva A, Zakon HH (2003) Cyclic AMP modulates electrical signaling in a weakly electric fish. J Comp Physiol A Neuroethol Sens Neural Behav Physiol 189: 273–282. [DOI] [PubMed] [Google Scholar]
- McAnelly ML, Zakon HH (2000) Coregulation of voltage-dependent kinetics of Na+ and K+ currents in electric organ. J Neurosci 20: 3408–3414. [DOI] [PMC free article] [PubMed] [Google Scholar]
- Mills A, Zakon HH (1991) Chronic androgen treatment increases action potential duration in the electric organ of Sternopygus J Neurosci 11: 2349–2361. [DOI] [PMC free article] [PubMed] [Google Scholar]
- Mountjoy KG, Robbins LS, Mortrud MT, Cone RD (1992) The cloning of a family of genes that encode the melanocortin receptors. Science 257: 1248–1251. [DOI] [PubMed] [Google Scholar]
- Nichols CT, Tyler FH (1967) Diurnal variation in adrenal cortical function. Annu Rev Med 18: 313–324. [DOI] [PubMed] [Google Scholar]
- Olman M (2001) Electrolocation abilities of males and females of the gymnotiform electric fish Brachyhypopomus pinnicaudatus. Honors thesis, Florida International University.
- Ringholm A, Fredriksson R, Poliakova N, Yan YL, Postlethwait JH, Larhammar D, Schioth HB (2002) One melanocortin 4 and two melanocortin 5 receptors from zebrafish show remarkable conservation in structure and pharmacology. J Neurochem 82: 6–18. [DOI] [PubMed] [Google Scholar]
- Rotllant J, Balm PH, Ruane NM, Perez-Sanchez J, Wendelaar Bonga SE, Tort L (2000) Pituitary proopiomelanocortin-derived peptides and hypothalamus–pituitary–interrenal axis activity in gilthead sea bream (Sparus aurata) during prolonged crowding stress: differential regulation of adrenocorticotropin hormone and α-melanocyte-stimulating hormone release by corticotropin-releasing hormone and thyrotropin-releasing hormone. Gen Comp Endocrinol 119: 152–163. [DOI] [PubMed] [Google Scholar]
- Salazar VL, Stoddard PK (2001) The energetic cost of bioelectrogenesis. Paper presented at Fifth International Congress of Neuroethology. Bonn, Germany, July.
- Sapolsky RM (2002) Endocrinology of the stress response. In: Behavioral endocrinology (Becker JB, Breedlove SM, Crews D, McCarthy M, eds), pp 409–450. Cambridge, MA: MIT.
- Schioth HB, Chhajlani V, Muceniece R, Klusa V, Wikberg JE (1996) Major pharmacological distinction of the ACTH receptor from other melanocortin receptors. Life Sci 59: 797–801. [DOI] [PubMed] [Google Scholar]
- Schioth HB, Muceniece R, Larsson M, Wikberg JE (1997) The melanocortin 1, 3, 4, or 5 receptors do not have a binding epitope for ACTH beyond the sequence of α-MSH. J Endocrinol 155: 73–78. [DOI] [PubMed] [Google Scholar]
- Silva A, Quintana L, Galeano M, Errandonea P, Macadar O (1999) Water temperature sensitivity of EOD waveform in Brachyhypopomus pinnicaudatus J Comp Physiol A Neuroethol Sens Neural Behav Physiol 185: 187–197. [Google Scholar]
- Slominski A, Wortsman J, Luger T, Paus R, Solomon S (2000) Corticotropin-releasing hormone and proopiomelanocortin involvement in the cutaneous response to stress. Physiol Rev 80: 979–1020. [DOI] [PubMed] [Google Scholar]
- Stoddard PK (2002) Electric signals: predation, sex, and environmental constraints. Adv Study Behav 31: 201–242. [Google Scholar]
- Stoddard PK, Markham MR, Salazar VL (2003) Serotonin modulates the electric waveform of the gymnotiform electric fish Brachyhypopomus pinnicaudatus J Exp Biol 206: 1353–1362. [DOI] [PMC free article] [PubMed] [Google Scholar]
- Stoddard PK, Zakon H, Markham MR, McAnelly ML (2006) Regulation and modulation of electric waveforms in gymnotiform electric fish. J Comp Physiol A Neuroethol Sens Neural Behav Physiol, in press. [DOI] [PMC free article] [PubMed]
- Sumpter JP, Dye HM, Benfey TJ (1986) The effects of stress on plasma ACTH, α-MSH, and cortisol levels in salmonid fishes. Gen Comp Endocrinol 62: 377–385. [DOI] [PubMed] [Google Scholar]
- Zakon H, Oestreich J, Tallarovic S, Triefenbach F (2002) EOD modulations of brown ghost electric fish: JARs, chirps, rises, and dips. J Physiol (Paris) 96: 451–458. [DOI] [PubMed] [Google Scholar]