Abstract
Gating of sensory information can be assessed using an auditory conditioning-test paradigm which measures the reduction in the auditory evoked response to a test stimulus following an initial conditioning stimulus. Recording brainwaves from specific areas of the brain using multiple electrodes is helpful in the study of the neurobiology of sensory gating. In this paper, we use such technology to investigate the role of cannabinoids in sensory gating in the CA3 region of the rat hippocampus. Our experimental results show that application of the exogenous cannabinoid agonist WIN55,212-2 can abolish sensory gating. We have developed a phenomenological model of cannabinoid dynamics incorporated within a spiking neural network model of CA3 with synaptically interacting pyramidal and basket cells. Direct numerical simulations of this model suggest that the basic mechanism for this effect can be traced to the suppression of inhibition of slow GABAB synapses. Furthermore, by working with a simpler mathematical firing rate model we are able to show the robustness of this mechanism for the abolition of sensory gating.
Keywords: Sensory gating, Cannabinoids, GABAB, Firing rate models
Introduction
In the brain, ongoing electrical activity of the central nervous system can be measured by a variety of different recording modalities, ranging from local field potentials (LFPs) recorded from extracellular electrodes, up through scalp electroencephalogram (EEG) recordings, to whole brain fMRI studies. These rapid fluctuations of voltage, that are detectable with an EEG or an LFP are also known as brainwaves.
Sensory gating is a mechanism which allows filtering of irrelevant sensory information, so enabling efficient information processing within the central nervous system. Sensory gating can be demonstrated in human brainwaves using the auditory-evoked EEG response, recorded from scalp electrodes, to a conditioning-testing paradigm, in which two identical auditory tones are presented 500 ms apart. Normal subjects have a smaller response to the second (test) tone than to the first (conditioning) tone. Therefore, the (T/C) ratio of the amplitude of the testing (T) to the conditioning (C) response is used as a quantitative measure of sensory gating (Adler et al. 1982). A positive wave occurring 50 ms (P50) following the auditory stimuli, is the most widely used auditory-evoked response to assess gating in humans. Lower T/C ratios of the P50 wave reflect stronger attenuation of irrelevant input and thus better sensory gating.
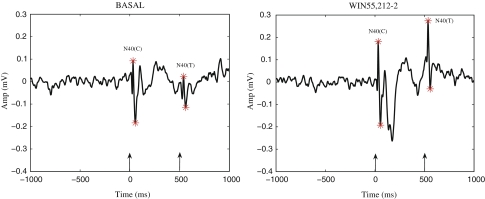
Schizophrenic patients fail to demonstrate a gated response to the second tone. The T/C of healthy controls is often less than 15%, whereas the T/C of schizophrenic subjects is often more than 85% (Flach et al. 1996). Studies on sensory gating have been conducted in both anesthetized (Bickford-Wimer et al. 1990; V Luntz-Leybman 1992) and freely moving rodents (Moxon et al. 1999) to examine LFPs and single neuron activity in response to auditory stimuli. A negative wave occurring around 40 ms (N40) following auditory stimuli, recorded from the CA3 region of the rat hippocampus, is considered equivalent to the P50 wave recorded in humans (Miller and Freedman 1995). The N40 wave demonstrates a diminished response to the test stimuli (T/C ≤ 50%) in healthy controls (Miller et al. 1992) while disrupted gating has been shown in pharmacological models (e.g. following phencyclidine and amphetamine administration) of schizophrenia (Miller et al. 1992; Joy et al. 2004). An example of sensory gating is illustrated in Fig. 1, showing average auditory evoked LFPs recorded from the hippocampal CA3 region of an anesthetized rat.
Fig. 1.
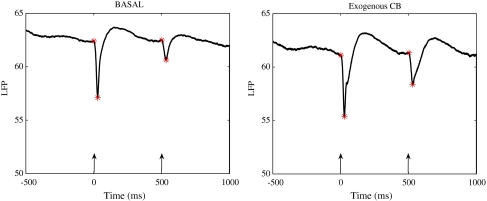
An example of auditory gating recorded during a control period (left panel) and following administration of the exogenous cannabinoid agonist WIN55,212-2 (right panel). The auditory evoked LFP responses, averaged over 128 trials, were recorded from the hippocampal CA3 region of an anesthetized rat. The two auditory 3 kHz tones presented 500 ms apart, are indicated by the arrows. Left panel: during the control period the rat exhibited normal gating with a T/C ratio of 0.50. Right panel: after administration of the non-selective cannabinoid agonist WIN55,212-2, a loss of sensory gating was observed, indicated by the higher T/C value of 0.81
Human studies have suggested that cannabis abuse may precipitate the onset of schizophrenia and a dysfunction of the endocannabinoid system may be involved in the pathology of the disease (Rentzsch et al. 2007). Auditory gating has also been found to be disrupted in otherwise healthy chronic cannabis users (Rentzsch et al. 2007). Endogenous cannabinoids (CBs) represent an example of a retrograde messenger (Freund et al. 2003), released postsynaptically, that interact with presynaptic CB receptors. CB synthesis is stimulated following intracellular calcium mobilization, or when certain G-protein-coupled receptors are activated (Wilson and Nicoll 2001). In this way, CBs allow fine-tuning of neuronal response, and in particular can regulate neurotransmitter release via activation of presynaptic CB1 receptors. Activation of CB1 receptors on hippocampal interneurons reduces their release of the inhibitory neurotransmitter GABA. Retrograde signaling from a strongly depolarized postsynaptic cell to the presynaptic GABA-releasing cell to shut off GABA release is termed depolarization-induced suppression of inhibition (DSI) (Wilson and Nicoll 2001; Freund et al. 2003). Endogenous CBs can also mediate depolarization-induced suppression of excitation (DSE) (Wilson and Nicoll 2002; Ohno-Shosaku et al. 2002) by presynaptically blocking glutamate release from pyramidal cells. However, DSE is much less prominent and requires longer depolarizations for induction than DSI (Ohno-Shosaku et al. 2002), supposedly due to the lower expression and sensitivity of CB1 receptors on pyramidal cells.
A large body of evidence indicates the involvement of the GABAergic inhibition in the pathophysiological process in the schizophrenic brain. Experimental studies have found the expression of GABAB receptors to be reduced in the hippocampus of postmortem samples from schizophrenic patients, as compared to healthy controls (Mizukami et al. 2000). In addition, several studies have demonstrated that GABAA receptor binding is upregulated in several regions of schizophrenic brain including the hippocampus (Benes et al. 1992, 1996). These increases are considered to be a compensatory upregulation in response to some defect of GABAergic activity. Interestingly, although increased GABAA was preferentially found on pyramidal cells in prefrontal and anterior cingulate cortices, and CA1 region of hippocampus, in the CA3 region the increased GABAA was found on non-pyramidal cells, suggesting a decrease of GABA to GABA interactions (Benes et al. 1996).
It has been suggested that sensory gating can be lost due to a deficit in the inhibitory recurrent activity within the hippocampus (Miller and Freedman 1995; Lara 2002). Indeed, a role for GABAB receptors in disrupting sensory gating has been demonstrated after the administration of GABAB antagonists (Hershman et al. 1995). Previous modeling studies (Flach et al. 1996; Moxon et al. 2003a, b) have explored the local processing and afferent activity involvement in sensory gating. Moxon et al. (2003a, b) have explained the nicotinic cholinergic input role in sensory gating and the dopaminergic modulation of the P50 (N40) signal. In addition, they have suggested that presynaptic GABAB receptors are involved in attenuating the second (test) tone response, by suppressing cortical input and recurrent excitation. They proposed this inhibitory pathway is indirectly activated by nicotinic cholinergic input from the septum. For a recent review of the biology and modeling of sensory gating we refer the reader to Zachariou et al. (2007). The primary purpose of this paper is to extend work on sensory gating to include the effects of CBs. We suggest here that a CB-mediated transient reduction in inhibition is a mechanism for abolishing sensory gating. Altering the activity of the CB system, which may be inactive under normal basal circumstances (Ryan et al. 2007), by recreational drug abuse or as a result of pathological conditions, such as schizophrenia, could impair sensory gating through suppression of inhibition from interneurons. In support of this view we present here a combined experimental, computational and mathematical model of sensory gating that considers the effects of exogenous CBs on brainwaves.
Methods
Experimental
Experimental protocol
Male Lister-hooded rats weighing 300–450 g (n = 5) were anesthetized with isoflurane & N2O:O2 (50%:50%). Sixteen-channel micro-wire electrode arrays (Teflon-coated stainless steel, 50 μm diameter per wire; NB Labs, Texas USA) were stereotactically centred on the CA3 region of the hippocampus (Paxinos and Watson 1998). Paired auditory stimuli (3 kHz tones, intensity 90 dB, duration 10 ms) separated by 0.5 s were binaurally presented through hollow ear bars, with stimuli repeated for 128 trials with an inter-trial interval of 10 s.
Simultaneous extracellular multiple single unit and LFPs activity was recorded using a Plexon Multineuron Acquisition Processor (MAP) system (Plexon Inc., Texas, USA). Neural signals were split at the Plexon preamplifier (gain × 1,000) and band-pass filtered (LFPs: 0.1–170 Hz; spikes: 500 Hz–5 kHz). The amplified signal from each electrode was digitized (40 kHz sampling rate) and continuous data files were saved for off-line spike sorting. On-line spike discrimination (typically 1–2 units per channel) was achieved with pairs of voltage-time windows and principal component analysis (Abeles and Goldstein 1977). Spike sorting was performed with Off-Line Sorter software (Plexon Inc.) using automatic and manual sorting techniques, including valley seeking and K-means clustering methods, computer-generated waveform template matching and manual checking of single unit isolation. Obvious artifacts were removed and the stability of (spike sorting) clusters during the experiment was confirmed by plotting the first principal component against the timestamp for each sorted waveform. The discriminated clusters were considered as single units only if autocorrelograms and interspike interval (ISI) histograms indicated an absolute refractory period larger than 1.1 ms. Typically one or two hippocampal units were isolated from each electrode.
The effect of the CB agonist WIN55,212-2 (administered intraperitoneally as a single dose of 1.2 mg/kg) on sensory gating was compared to basal recording. Data were analyzed using NEX software (version 3; Neuroexplorer Inc., USA) and custom-written scripts implemented in Matlab v7.3. Gating was assessed by measuring the ratio of the N40 LFP amplitude of the test (T) to the conditioning (C) response. Paired t-tests were performed using MINITAB for the firing rate, CV2, and burstiness before and after the administration of CB agonist.
Cell type identification
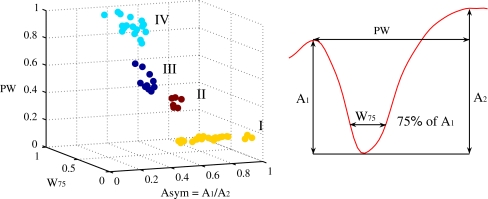
Several criteria have been used in previous studies for the identification and classification of single units recorded in the hippocampus in both rodents (Csicsvari et al. 1998, 1999; Henze et al. 2002) and humans (Viskontas et al. 2007). In this study, cells were classified into putative pyramidal neurons and putative interneurons using some of the established features for cell classification. All three features used for clustering were extracted from the extracellular waveform shape. Single unit (n = 74) action potential waveforms were recorded within a 1.4 ms window and were averaged over all the events (n > 100) for each cell. The resulting mean spike waveform was linearly interpolated (step = 0.25) for more precise measuring of the waveform characteristics. These included (1) the width at 75% of the amplitude of the negative component, (2) the asymmetry measure defined as the ratio of the distance from the first positive peak to the negative peak, divided by the distance from the negative peak to the second positive peak, and (3) the width between the two peaks, as seen in Fig. 2.
Fig. 2.
Single units plotted as function of their waveform width at 75% of the negative peak (W 75), the width between the two positive peaks (PW) and the asymmetry measure (Asym) (first positive peak to negative peak divided by negative peak to second positive peak). The units are plotted after using the clustering methods to distinguish them into the four clearly separated clusters shown, according to the characteristics of their waveform. The values of all the three characteristics are normalized from 0 to 1
Although the firing rate was estimated for each cell, it was not used as classification criterion, as interneurons have been observed to have overlapping firing rates with the pyramidal cells (Csicsvari et al. 1999). Nevertheless, the average firing of putative interneurons was much higher than the pyramidal cells after clustering, (see Table 1), which is in agreement with values observed in previous studies (Csicsvari et al. 1999; Viskontas et al. 2007). Additional features were estimated such as Burstiness (Bur), defined as the mean fraction of all ISIs that were shorter than 10 ms (Robbe et al. 2006). Moreover, to assess the variability of the firing of each spike train we used the coefficient of variation (CV2) described in (Holt et al. 1996). Higher values of CV2 indicate decreased spike regularity (a value of CV2 = 1 indicates an ideal Poisson spike train). Compared to standard coefficient of variation (CV), CV2 provides a more reliable measure of intrinsic variability of spiking processes independent of gradual changes in firing rate. To quantify the degree of synchrony we use the firing times synchrony measure r 2 as described by Pinsky and Rinzel (1995).
Table 1.
Averages of the features estimated for each class under basal conditions (in the absence of auditory stimuli or CB administration) over all the member cells of each class; firing rate (FR), burstiness (Bur), coefficient of variation (CV2) and synchrony measure (Syn)
| Classes | FR (spikes/s) | Bur | CV2 | Syn | |
|---|---|---|---|---|---|
| I | (n = 22) | 1.73 ± 0.27 | 0.09 ± 0.01 | 0.33 ± 0.09 | 0.53 ± 0.05 |
| II | (n = 6) | 2.15 ± 1.06 | 0.08 ± 0.03 | 0.67 ± 0.21 | 0.36 |
| III | (n = 11) | 17.89 ± 7.47 | 0.13 ± 0.05 | 0.27 ± 0.09 | 0.33 ± 0.07 |
| IV | (n = 18) | 8.12 ± 2.23 | 0.17 ± 0.03 | 0.26 ± 0.07 | 0.43 ± 0.08 |
Results shown in mean ± SEM
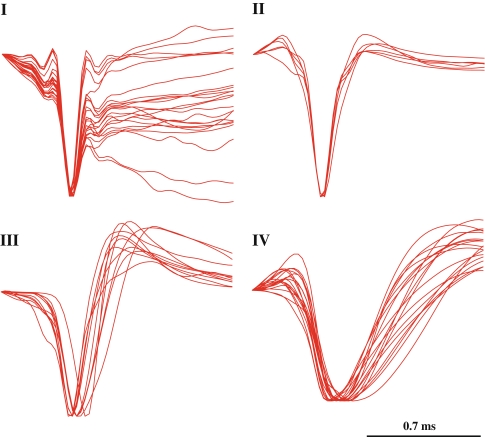
The clustering was performed using two custom Matlab tools, K-means algorithm and custom hierarchical tree clustering. Both methods generated the same four classes as seen in Fig. 2. These clustering methods allowed us to distinguish the cells according to their waveform shape, as seen in Fig. 3. Cells which had a V-shape waveform (n = 17), lacking any positive peaks, were considered to be recorded from the axon (Gold et al. 2006) and were excluded from the classification analysis.
Fig. 3.
The mean average traces of all the member cells of each class, classified based on their waveform shape, are shown here superimposed. The waveforms were amplitude normalized for the purpose of this illustration
Previous studies have demonstrated that the waveforms of the interneurons and pyramidal cells are quite distinct, pyramidal cells tending to have a wider waveform than the interneurons (Csicsvari et al. 1999; McCormick et al. 1985). Therefore we presume that class IV cells are putative pyramidal cells, and class III are putative interneurons. This view is in agreement with the average firing rate of each group (see Table 1). Class I cells could be either bursting pyramidal cells or bursting interneurons (Csicsvari et al. 1998, 1999). The observations that they form the majority of the cell recordings (22/57) and have the lowest average firing rate argue in favor of them being putative pyramidal cells. Interestingly, Class I cells are more synchronized within their group (see Table 1) and with cells recorded from the prefrontal cortex during the experiments. Class II cells were the group with the least cells and the highest CV2. They could be either bursting pyramidal cells or bursting interneurons or a subclass of the other three classes. Nevertheless these intuitive arguments do not constitute enough evidence to waive the ambiguity, therefore the cells of class I and II are referred to as type I and II bursting cells, respectively.
Computational
A spiking neural network model of the CA3 region of the hippocampus has been developed and implemented using the NEURON simulation environment (Carnevale and Hines 2006). The Pinsky–Rinzel model (PR) (Pinsky and Rinzel 1994) was chosen for simulating the pyramidal cells. For simulating the basket cells the Wang–Buzsáki (WB) model (Wang and Buzsáki 1996) was selected. Following the work of Flach et al. (1996), a scaled model of the CA3 region was built, including 600 pyramidal cells and 60 interneuron, preserving the 10:1 pyramidal to basket cells ratio (Traub and Miles 1991). The pyramidal cells contact themselves (on the dendritic compartment) and the interneurons with fast (AMPA) excitation. The basket cells contact themselves and the pyramidal cells (on the somatic compartment) with both fast and slow (GABAA and GABAB) inhibition. Each cell in the network randomly contacts pyramidal cells and interneurons. Excitatory AMPA synapses and cortical glutamatergic afferent synapses (DG and EC) were modeled with a single exponential function. The GABAA,B-ergic (both recurrent and afferent) and the septal cholinergic afferent (muscarinic and nicotinic) synapses were modeled with an alpha function. The synaptic conductances were normalized so that the amplitude of the postsynaptic potential (PSP) was independent of the time constant. Conductance changes in the spiking model thus take the symbolic form
 |
1 |
where T
m represents a pre-synaptic firing time, η(t) is the shape of a PSP, and  sets the scale of synaptic interaction.
Two main afferent inputs to the CA3 region, cortical and septal, were included in the model. The septal input consisted both cholinergic (excitatory) and GABAergic (inhibitory) fibers. The cholinergic input activated nicotinic (NIC) and muscarinic (MUS) receptors on both the basket and the pyramidal cells. The GABAergic input activated GABAA and GABAB receptors on both types of cells. The cortical input, which represents the input from the dentate gyrus (DG) and the entorhinal cortex (EC), consisted of cholinergic input on both populations. A tonic, low frequency, noisy (following a poisson distribution) input from the cortical and septal fibers was maintained throughout simulations. Also the value of the constant background drive to each cell was randomized (and drawn from a uniform distribution) in such a way that single neuron frequencies could be seen as persisting (and tuned to) albeit under modulation from the network (Wang and Buzsáki 1996). The initial values of the membrane potentials of the pyramidal and basket cells were set to −65 and −68 mV, respectively. The simulation of the two auditory tones was performed based on experimental information on the activity of the populations known to reach hippocampus during the auditory-tone paradigm (Moxon et al. 2003b). The simulation begins 1,000 ms before the first (conditioning) tone. To simulate the first tone the septal cholinergic input was increased for 10 ms. Two milliseconds after, the EC input was increased for 4 ms. One millisecond after the activation of EC, the DG input was increased for 4 ms. After 500 ms the second (testing) tone was simulated in a similar way as the first tone, although there was half the amount of septal cholinergic input. One quarter of each cell group was activated with afferent input due to the conditioning and test tones. To extract LFPs from the spiking network model we simply regard the average of the membrane potential of the pyramidal cells, as a mean field signal reflecting the gating process. To introduce a CB retrograde signaling mechanism at the synaptic level we adopted a phenomenological model, whereby the synaptic strengths for the GABAergic synapses,  became weaker at high CB levels,
  where
where
 |
2 |
and ω is the synaptic weight. We modeled the effect of exogenous CBs by considering the experimental evidence that only a fraction of the interneuronal basket cells in the hippocampus express CB1 receptors (Freund et al. 2003; Katona et al. 1999) and that the total network GABA release is suppressed by approximately 50% (Katona et al. 2000).
In addition to the postsynaptic inhibition provided by GABAB, we also model the inhibition of excitatory activity via presynaptic GABAB receptors on excitatory afferent terminals. In a paired stimulus paradigm the time courses of both pre- and postsynaptic GABAB were measured (Isaacson et al. 1993). Interestingly, although the two time courses are similar, the presynaptic GABAB reaches its peak time later (300 ms) than the postsynaptic GABAB (200 ms), and lasts for a longer time (Isaacson et al. 1993). In our model, the presynaptic GABAB is activated when the total excitatory input on the inhibitory cells ∑(g
NIC + g
MUS + g
DG + g
EC + g
exc) is high enough to exceed a certain threshold. The presynaptic GABAB activation is manifested through the decrease of the EPSP amplitude by considering  to be dynamically dependent on the presynaptic GABAB, that is
  where
where
 |
3 |
and ω is the synaptic weight. Here g PG is modeled with an alpha function (with α = 0.033).
The presynaptic GABAB (which is inactive under resting conditions) is activated during the (C) stimulus due to the high afferent excitatory input (mainly mediated by the NIC receptors). This activation results to the reduction of the recurrent excitation of the pyramidal–pyramidal connection for as long as the respective time course of this process. Additionally, the DG afferent excitation is partly reduced (50%) (Hershman et al. 1995) for the same period of time. The administration of exogenous CBs results to inhibiting both GABAA,B in the network (50%), as well as the GABAB presynaptic mechanism activation.
Mathematical
A simple rate model can be derived from a spiking model of a network consisting of excitatory and inhibitory populations, under the assumption of slow synaptic interactions. For a discussion of this approach see Bressloff and Coombes (2000). In this approach synaptic conductances of the form (1) are replaced by
 |
4 |
where F is interpreted as a firing rate. This rate function will be different for the pyramidal and interneuron single neuron models and will depend on the total synaptic input to the neuron. Writing this in the form  where + /− refers to excitation/inhibition,
  are synaptic reversal potentials and V is the single neuron (somatic) voltage, we numerically fitted the firing rates of the PR and WB models as functions of the pair
  For the PR model we found
 |
5 |
with Θ a Heaviside step function. Here 

 V
r = −62.92−15.95g
−,
  τr = 3, C = 10 and τ = 62.5. For the WB model we found
 |
6 |
where 
 and
and  Finally, we obtain a coupled ODE model by using the fact that the PSP shape is the Green’s function of a linear differential operator, e.g. for an alpha function (with rise-time α−1)
  we can write
  To gain insight into the basic mechanism of sensory gating abolition by CBs we further work with a minimal architecture consisting of one group of excitatory cells (labeled with E) interacting with two other inhibitory populations (labeled with A and B, representing GABAA,B-ergic cells). Importantly this minimal approach includes the phenomenological description of CB dynamics used in the full spiking model. The synaptic weight from population X to population Y is denoted W
YX. All the synaptic weights have a positive value (W
YX > 0). The external input is a simple two-tone temporal sequence of the form
  which is added to the excitatory conductance g
+. As in the NEURON model the synaptic strengths for the inhibitory populations A and B to the excitatory population E, W
EX became weaker at high CB levels:
  for X ∈ {A,B} with S defined by Eq. 2. Moreover, the synaptic strength for recurrent excitation W
EE becomes weaker when the presynaptic GABAB is activated:
  with σ defined by Eq. 3. In the presence of CBs, which block the presynaptic GABAB activation, W
EE is restored to its initial value.
This Wilson-Cowan style network is ideally suited to fast numerical simulations as well as numerical bifurcation analysis.
Results
Experimental
Loss of normal gating was observed with the administration of the CB agonist WIN55,212-2. As seen in Fig. 1, the loss of gating is indicated by the high T/C value 0.81, compared to the normal gating value T/C 0.50 during the control period. The rats which exhibited T/C > 0.50, (n = 2) were excluded from the T/C analysis and were only included in the cell classification analysis. In the rats which exhibited normal gating (n = 3) the average value of T/C was 0.27 ± 0.12 (mean ± SEM). After the administration of WIN55,212-2 the average T/C value for the three rats was 0.96 ± 0.13 (mean ± SEM).
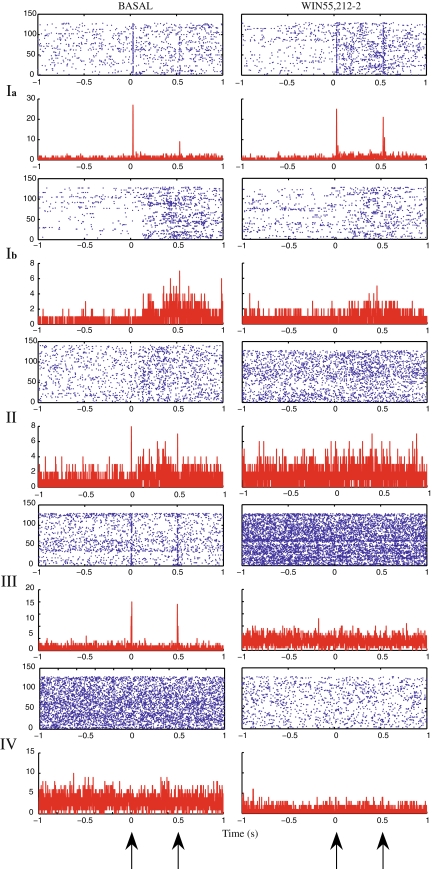
Gating was also observed in the single-unit neuronal activity in rats. The response pattern of the cells of each class to the conditioning and testing presentations was distinct. Moreover, their respective response pattern was affected by CB agonist WIN55,212-2 administration. Class I cells either responded to both tones with a gated response to the test tone (subclass Ia) or had slightly elevated firing between the two tones (subclass Ib), compared to the basal firing. Class II cells had a small response following the (C) tone but they were not stimulus-locked. Class III cells (putative interneurons) responded in equal manner to both (C)(T) tones. Class IV cells did not show any response to the (C)(T) stimuli.
Following the administration of WIN55,212-2 the response pattern of each class was notably different as seen in Fig. 4. Subclass Ia cells which exhibited a gated response to the test tone, lost this gating response. Subclass Ib cells which had slightly elevated firing between the two tones showed a similar response pattern following the CB agonist treatment. Class II did not show any increase of firing rate during or between the two tones. Class III cells failed to respond to either (C)(T) tones. Class IV cells remained unresponsive to the (C)(T) stimuli as during the pre-drug control period.
Fig. 4.
Perievent spiketrain raster plots and histograms (counts/bin, bin = 1 ms), shown in the upper-lower panels, respectively, of representative cells from each class. Left: control period. Right: following the administration of WIN55,212-2. Two types of response modes were observed for the cells from class I; either responding to both tones with a gated response to the test tone (subclass Ia), or having slightly elevated firing between the two tones (subclass Ib). Cells from class II had a small response following (C) but were not stimulus-locked. One representative cell is shown from the class III, which responded in equal manner to both (C)(T) tones. Class IV cells did not show any response to the two auditory tones. Following the administration of WIN55,212-2 group Ia cells responded equally to both tones failing to gate, and group III failed to respond to any of the two tones. The other groups did not exhibit a significant change
Features such as the firing rate, the burstiness and CV2 were estimated for each group (I–IV) for both the control and the CB agonist administration period. The firing rate was significantly affected for the groups I and IV. Group I exhibited a small albeit significant increase in the mean firing rate from (1.73 ± 0.25 SEM) to (1.99 ± 0.26 SEM; P = 0.035) and Group IV a decrease from (9.84 ± 2.9 SEM) to (4.41 ± 1.35 SEM; P = 0.044). Burstiness was significantly increased for group I from (0.09 ± 0.01 SEM) to (0.11 ± 0.01 SEM; P = 0.011) and for group II from (0.09 ± 0.02 SEM) to (0.17 ± 0.04 SEM; P = 0.021). The CV2 was decreased for group IV (0.21 ± 0.06 SEM) to (0.11 ± 0.0.4 SEM; P = 0.04), indicating that these cells were firing in a less random fashion.
Computational
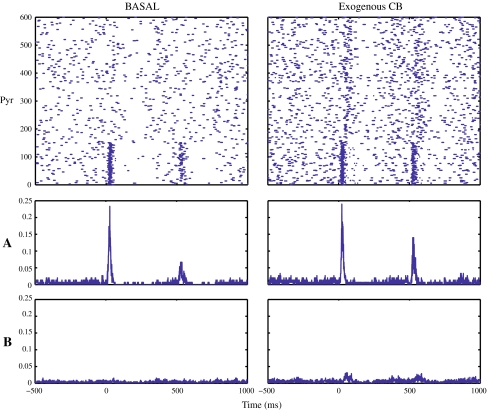
Sensory input is filtered through the non-lemniscal pathway and the signal corresponding to the test tone arrives in the hippocampus gated to some degree (Miller and Freedman 1995). In the first instance in order to emphasize the effect of the slow inhibitory process, we model the input as having the same amplitude for both tones and therefore do not expect to achieve the same degree of gating as seen experimentally. The model exhibits gating with T/C 0.81. This verifies the fact that the network is able to intrinsically activate the gating mechanism, which is dependent on the activation of interneurons from external input (NIC) or internal recurrent activation (pyramidal activated by NIC). Following the validation of the model, we reduce the amplitude of the (T) tone input to reflect the gating processing occurring in the pathway of the afferent inputs to CA3 hippocampal area. The model exhibits gating with T/C 0.35, which is increased to 0.52 when the exogenous CB agonist is added, as seen in Fig. 5. Considering that the septal input remains unchanged in our model, and is likely to change during the global administration of CBs, we do not expect the model to exhibit the same loss of gating as in the experiments. Moreover, gating is observed in the single units responsiveness and in the average population firing rates. As seen in Fig. 6, a variety of response modes is observed from different groups of cells, as seen in the experimental study.
Fig. 5.
Simulated average (n = 20 random seeds) perievent LFPs (given by the average of the inverse somatic membrane potential of the pyramidal cells), from the NEURON CA3 network model. Left: normal gating is observed in basal condition with T/C 0.35. Right: when exogenous CBs are inserted in the model a loss of gating is observed with T/C 0.52
Fig. 6.
Perievent raster plots (top) and histograms of a representative single trial from the NEURON CA3 model during basal and after the administration of exogenous CBs (left–right panel, respectively). The lower two panels show perievent average firing rates (spikes/bin, bin = 1 ms) for two populations of pyramidal cells (n = 600) from the NEURON CA3 model. Group A represents the pyramidal cells (n = 150) which are directly contacted by the afferent input representing the two tones. Group B represents the pyramidal cells (n = 450) which are not directly activated from the input of the two tones
Mathematical
As we have shown in a previous study (Zachariou et al. 2007) a simple phenomenological model of CB dynamics underlying suppression of inhibition is able to abolish sensory gating in a manner consistent with our experimental findings. Here we improve the previous model by using a more realistic firing rate function instead of a sigmoid, namely the F–I curve of the WB and PR models, as described in the Methods. Moreover, we include the mechanism of presynaptic GABAB receptors activation. Initially we conducted a numerical bifurcation analysis for each synaptic weight W XY of the system, in the absence of CBs dynamics and external input. Following this analysis we chose the synaptic weights so that the basal model behavior does not fall within the oscillatory regime.
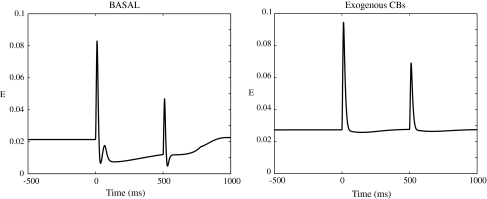
In order to emphasize the effect of the slow inhibitory process, we model the input as having the same amplitude for both tones. The model successfully gates sensory information in the absence of exogenous CBs (CB = 0). When the model includes sufficient levels of exogenous CBs (CB ≥ 3), gating is completely abolished. Here we set CB = 2, which reduces by 50% the strength of W EX, for X ∈ {A, B}, mimicking the 50% reduction seen in biology (Katona et al. 2000). We then reduce the amplitude of the (T) tone input, as in the NEURON network model. In Fig. 7 we show the loss of gating with the addition of exogenous CBs, as seen in the activity of the excitatory population E. To interrogate the output firing rate of the E population FR(E), for comparison with the computational model and the experiments, we use a test PR neuron in basal state which is driven by the E population activity.
Fig. 7.
Left: the activity of the excitatory population (E) in the rate model in basal condition. Right: The loss of gating as observed from the activity of the (E) population, when exogenous CBs are inserted in the model
Discussion
We have explored the effect of CBs on one of the basic inhibitory mechanisms underlying sensory gating, with a mixture of electrophysiology, computational modeling and mathematical analysis.
Our experimental results show that application of the exogenous CB agonist WIN55,212-2 can abolish sensory gating as measured by the amplitude of LFP responses in rat hippocampal region CA3 (with a two-tones paradigm). Our findings also show the effect of WIN55,212-2 on the firing characteristics and response mode of the different classes, as identified by their extracellular waveform characteristics of the recorded cells. Notably the pyramidal cells (IV) exhibited a significant decrease in their firing rate with the administration of CB agonist, whereas the firing rate of the interneurons (III) and bursting cells (II) was not significantly changed. These results are in agreement with a recent study showing that CBs desynchronize neuronal assemblies without affecting average firing rates (Robbe et al. 2006).
In particular, we have analyzed single cell responses that underlie the generation of LFPs and grouped them via a cluster analysis, according to their extracellular waveform characteristics. These groups were subsequently shown to respond differently in the two-tone paradigm. After the application of exogenous CBs the most notable change in response came from the type III group (identified with the interneurons) and the type I group (bursting neurons).
The interneurons which responded equally to both tones (during the control period) failed to respond to either, following the CB agonist administration. Moreover, bursting cells from group Ia which exhibited a gated response corresponding to the (C) tone during the control period, failed to gate following the CB agonist administration, and responded equally to both tones.
Based on our findings we consider that group IV pyramidal cells represent the group of cells which are not directly activated by the two tone input. The fact that they show a significant decrease of their firing rate could be due to the fact the pyramidal cells also express (in a smaller degree than the interneurons) CB1 receptors and might be activated due to the global effect of exogenous CB agonist. We believe that it is the group III interneurons that express CB1 receptors, and in this way are most affected by the presence of CBs during gating. Moreover, it is likely that the group Ia pyramidal cells are activated directly by afferent fibers transmitting the two tone input. Group II cells are expected to lack CB1 receptors.
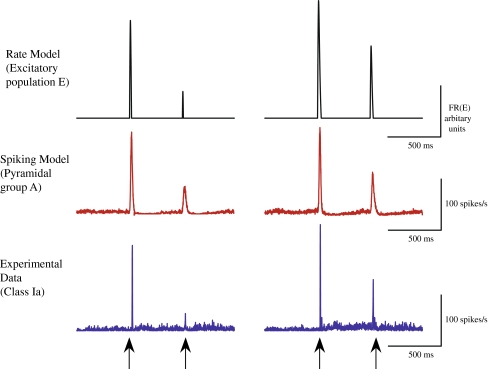
To uncover the basic principles of gating in the presence of CBs we have developed a spiking network model that incorporates their effects on both the strength of GABA-ergic synapses and of the presynaptic GABAB process. By implementing this model in NEURON we have shown that the spike trains and LFPs obtained in a simulated two-tone experiment are in agreement with our experimental data. See Fig. 8 for a further illustrative comparison between experimental data and our modeling. The model reproduces successfully gating and its abolition following the addition of exogenous CBs. By deriving and analyzing a simplified firing rate model we have established that the basic mechanism for the abolition of gating is the retrograde blocking of slow inhibition by CBs. A limitation of our modeling approach (spike or rate) is that it fails to model the diffusion of exogenous CBs and neither does it include the dynamics of endogenous CBs. Both of these extensions are natural within the modeling framework we have developed and are topics worthy of further pursuit.
Fig. 8.
Control period (left) and following the administration of exogenous CBs (right). Upper panel: the output firing rate FR(E) of the excitatory population (E) in the rate model. Middle panel: the average firing rate of group A from the NEURON spiking model across all random trials (n = 20). Lower panel: the average firing rate of the cells from the subgroup Ia of class I across all trials
Acknowledgements
SC would like to acknowledge ongoing support from the EPSRC through the award of an Advanced Research Fellowship, Grant No. GR/R76219. MZ is supported by a studentship from the University of Nottingham. DWND is supported by a studentship from the University of Nottingham and the government of Sri Lanka. MRO and RM acknowledge support from a BBSRC/EPSRC/MRC discipline hopping award (G0401458).
Open Access
This article is distributed under the terms of the Creative Commons Attribution Noncommercial License which permits any noncommercial use, distribution, and reproduction in any medium, provided the original author(s) and source are credited.
References
- Abeles M, Goldstein MH. Multispike train analysis. Proc IEEE. 1977;65:762–773. doi: 10.1109/PROC.1977.10559. [DOI] [Google Scholar]
- Adler LE, Pachtman E, Franks RD, Pecevich M, Waldo MC, Freedman R. Neurophysiological evidence for a defect in neuronal mechanisms involved in sensory gating in schizophrenia. Biol Psychiatry. 1982;17(6):639–654. [PubMed] [Google Scholar]
- Benes FM, Vincent SL, Alsterberg G, Bird ED, SanGiovanni JP. Increased GABAA receptor binding in superficial layers of cingulate cortex in schizophrenics. J Neurosci. 1992;12(3):924–929. doi: 10.1523/JNEUROSCI.12-03-00924.1992. [DOI] [PMC free article] [PubMed] [Google Scholar]
- Benes FM, Vincent SL, Marie A, Khan Y. Up-regulation of GABAA receptor binding on neurons of the prefrontal cortex in schizophrenic subjects. Neuroscience. 1996;75(4):1021–1031. doi: 10.1016/0306-4522(96)00328-4. [DOI] [PubMed] [Google Scholar]
- Bickford-Wimer PC, Nagamoto H, Johnson R, Adler LE, Egan M, Rose GM. Auditory sensory gating in hippocampal neurons: a model system in rat. Biol Phychiatry. 1990;27:183–192. doi: 10.1016/0006-3223(90)90648-L. [DOI] [PubMed] [Google Scholar]
- Bressloff PC, Coombes S. Dynamics of strongly coupled spiking neurons. Neural Comput. 2000;12:91–129. doi: 10.1162/089976600300015907. [DOI] [PubMed] [Google Scholar]
- Carnevale NT, Hines ML (2006) The NEURON book. Cambridge University Press
- Csicsvari J, Hirase H, Czurko A, Buzsáki G. Reliability and state dependence of pyramidal cell-interneuron synapses in the hippocampus an ensemble approach in the behaving rat. Neuron. 1998;21(1):179–189. doi: 10.1016/S0896-6273(00)80525-5. [DOI] [PubMed] [Google Scholar]
- Csicsvari J, Hirase H, Czurko A, Mamiya A, Buzsáki G. Oscillatory coupling of hippocampal pyramidal cells and interneurons in the behaving rat. J Neurosci. 1999;19(1):274–287. doi: 10.1523/JNEUROSCI.19-01-00274.1999. [DOI] [PMC free article] [PubMed] [Google Scholar]
- Flach KA, Adler LE, Gerhardt GA, Bickford P, MacGregor RJ. Sensory gating in a computer model of the CA3 neural network of the hippocampus. Biol Psychiatry. 1996;40:1230–1245. doi: 10.1016/0006-3223(95)00624-9. [DOI] [PubMed] [Google Scholar]
- Freund TF, Katona I, Piomelli D. Role of endogenous cannabinoids in synaptic signalling. Physiol Rev. 2003;83:1017–1066. doi: 10.1152/physrev.00004.2003. [DOI] [PubMed] [Google Scholar]
- Gold C, Henze DA, Koch C, Buzsáki G. On the origin of the extracellular action potential waveform: a modeling study. J Neurophysiol. 2006;95:3113–3128. doi: 10.1152/jn.00979.2005. [DOI] [PubMed] [Google Scholar]
- Henze DA, Wittner L, Buzsáki G. Single granule cells reliably discharge targets in the hippocampal CA3 network in vivo. Nat Neurosci. 2002;5:790–795. doi: 10.1038/nn887. [DOI] [PubMed] [Google Scholar]
- Hershman KM, Freedman R, Bickford PC. GABAB antagonists diminish the inhibitory gating of auditory response in the rat hippocampus. Neurosci Lett. 1995;190:133–136. doi: 10.1016/0304-3940(95)11523-Y. [DOI] [PubMed] [Google Scholar]
- Holt GR, Softky WR, Koch C, Douglas RJ. Comparison of discharge variability in vitro and in vivo in cat visual cortex neurons. J Neurophysiol. 1996;75(5):1806–1814. doi: 10.1152/jn.1996.75.5.1806. [DOI] [PubMed] [Google Scholar]
- Isaacson JS, SolÌs JM, Nicoll RA. Local and diffuse synaptic actions of GABA in the hippocampus. Neuron. 1993;10:165–175. doi: 10.1016/0896-6273(93)90308-E. [DOI] [PubMed] [Google Scholar]
- Joy B, McMahon RP, Shepard PD. Effects of acute and chronic clozapine on d-amphetamine-induced disruption of auditory gating in the rat. Psychopharmacology. 2004;174(2):274–282. doi: 10.1007/s00213-003-1731-4. [DOI] [PubMed] [Google Scholar]
- Katona I, Sperlagh B, Sik A, Kafalvi A, Vizi ES, Mackie K, Freund TF. Presynaptically located CB1 cannabinoid receptors regulate GABA release from axon terminals of specific hippocampal interneurons. J Neurosci. 1999;19(11):4544–4558. doi: 10.1523/JNEUROSCI.19-11-04544.1999. [DOI] [PMC free article] [PubMed] [Google Scholar]
- Katona I, Sperlagh B, Magloczky Z, Santha E, Kofalvi A, Czirjak S, Mackie K, Vizi ES, Freund TF. GABAergic interneurons are the targets of cannabinoid actions in the human hippocampus. Neuroscience. 2000;100(4):797–804. doi: 10.1016/S0306-4522(00)00286-4. [DOI] [PubMed] [Google Scholar]
- Lara DR. Inhibitory deficit in schizophrenia is not necessarily a GABAergic deficit. Cell Mol Neurobiol. 2002;22(3):239–247. doi: 10.1023/A:1020759615977. [DOI] [PMC free article] [PubMed] [Google Scholar]
- McCormick DA, Connors BW, Lighthall JW, Prince DA. Comparative electrophysiology of pyramidal and sparsely spiny stellate neurons of the neocortex. J Neurophysiol. 1985;54:782–806. doi: 10.1152/jn.1985.54.4.782. [DOI] [PubMed] [Google Scholar]
- Miller CL, Freedman R. The activity of hippocampal interneurons and pyramidal cells during the response of the hippocampus to repeated auditory stimuli. Neuroscience. 1995;69(2):371–381. doi: 10.1016/0306-4522(95)00249-I. [DOI] [PubMed] [Google Scholar]
- Miller CL, Bickford PC, Luntz-Leybman V, Adler LE, Gerhardt GA, Freedman R. Phencyclidine and auditory sensory gating in the hippocampus of the rat. Neuropharmacology. 1992;31(10):1041–1048. doi: 10.1016/0028-3908(92)90106-Y. [DOI] [PubMed] [Google Scholar]
- Mizukami K, Sasaki M, Ishikawa M, Iwakiri M, Hidaka S, Shiraishi H, Iritani S. Immunohistochemical localization of gamma-aminobutyric acid (B) receptor in the hippocampus of subjects with schizophrenia. Neurosci Lett. 2000;283(2):101–104. doi: 10.1016/S0304-3940(00)00939-3. [DOI] [PubMed] [Google Scholar]
- Moxon KA, Gerhardt GA, Bickford PC, Austin KA, Rose GM, Woodward DJ, Adler LE. Multiple single units and population responses during inhibitory gating of hippocampal auditory response in freely-moving rats. Brain Res. 1999;825:75–85. doi: 10.1016/S0006-8993(99)01187-7. [DOI] [PubMed] [Google Scholar]
- Moxon KA, Gerhardt GA, Adler LE. Dopaminergic modulation of the P50 auditory-evoked potential in a computer model of the CA3 region of the hippocampus: its relationship to sensory gating in schizophrenia. Biol Cybern. 2003;88:265–275. doi: 10.1007/s00422-002-0372-8. [DOI] [PubMed] [Google Scholar]
- Moxon KA, Gerhardt GA, Gulinello M, Adler LE. Inhibitory control of sensory gating in a computer model of the CA3 region of the hippocampus. Biol Cybern. 2003;88:247–264. doi: 10.1007/s00422-002-0373-7. [DOI] [PMC free article] [PubMed] [Google Scholar]
- Ohno-Shosaku T, Tsubokawa H, Mizushima I, Yoneda N, Zimmer A, Kano M. Presynaptic cannabinoid sensitivity is a major determinant of depolarization-induced retrograde suppression at hippocampal synapses. J Neurosci. 2002;22(10):3864–3872. doi: 10.1523/JNEUROSCI.22-10-03864.2002. [DOI] [PMC free article] [PubMed] [Google Scholar]
- Paxinos G, Watson C (1998) The rat brain in stereotaxic coordinates. Academic Press [DOI] [PubMed]
- Pinsky PF, Rinzel J. Intrinsic and network rhythmogenesis in a reduced Traub model for CA3 neurons. Comput Neurosci. 1994;1:39–60. doi: 10.1007/BF00962717. [DOI] [PubMed] [Google Scholar]
- Pinsky PF, Rinzel J. Synchrony measures for biological neural networks. Biol Cybern. 1995;73(2):129–137. doi: 10.1007/BF00204051. [DOI] [PubMed] [Google Scholar]
- Rentzsch J, Penzhorn A, Kernbichler K, Plöckl D, de Castro AG-C, Gallinat J, Jockers-Scherübl MC. Differential impact of heavy cannabis use on sensory gating in schizophrenic patients and otherwise healthy controls. Exp Neurol. 2007;205(1):241–249. doi: 10.1016/j.expneurol.2007.02.004. [DOI] [PubMed] [Google Scholar]
- Robbe D, Montgomery SM, Thome A, Rueda-Orozco PE, McNaughton BL, Buzsáki G. Cannabinoids reveal importance of spike timing coordination in hippocampal function. Nat Neurosci. 2006;9:1526–1532. doi: 10.1038/nn1801. [DOI] [PubMed] [Google Scholar]
- Ryan D, Drysdale AJ, Pertwee RG, Platt B. Interactions of cannabidiol with endocannabinoid signalling in hippocampal tissue. Eur J Neurosci. 2007;25(7):2093–2102. doi: 10.1111/j.1460-9568.2007.05448.x. [DOI] [PubMed] [Google Scholar]
- Traub RD, Miles R (1991) Neuronal networks of the hippocampus. Cambridge University press
- V Luntz-Leybman PC, Bickford RF. Cholinergic gating of response to auditory stimuli in rat hippocampus. Brain Res. 1992;587(1):130–136. doi: 10.1016/0006-8993(92)91437-J. [DOI] [PubMed] [Google Scholar]
- Viskontas IV, Ekstrom AD, Wilson CL, Fried I. Characterizing interneuron and pyramidal cells in the human medial temporal lobe in vivo using extracellular recordings. Hippocampus. 2007;17(1):49–57. doi: 10.1002/hipo.20241. [DOI] [PubMed] [Google Scholar]
- Wang XJ, Buzsáki G. Gamma oscillation by synaptic inhibition in a hippocampal interneuronal network. J Neurosci. 1996;16:6402–6413. doi: 10.1523/JNEUROSCI.16-20-06402.1996. [DOI] [PMC free article] [PubMed] [Google Scholar]
- Wilson RI, Nicoll RA. Endogenous cannabinoids mediate retrograde signalling at hippocampal synapses. Nature. 2001;410(6828):1–4. doi: 10.1038/35069076. [DOI] [PubMed] [Google Scholar]
- Wilson RI, Nicoll RA. Endocannabinoid signaling in the brain. Science. 2002;296(5568):678–682. doi: 10.1126/science.1063545. [DOI] [PubMed] [Google Scholar]
- Zachariou M, Dissanayake DWN, Owen MR, Mason R, Coombes S. The role of cannabinoids in the neurobiology of sensory gating: a firing rate model study. Neurocomputing. 2007;70(10–12):1902–1906. doi: 10.1016/j.neucom.2006.10.065. [DOI] [Google Scholar]


